Clinical Trial
. 2021 Aug;9(8):e002467.
doi: 10.1136/jitc-2021-002467.

Tumor microenvironment evaluation promotes precise checkpoint immunotherapy of advanced gastric cancer

Affiliations
Clinical Trial

Tumor microenvironment evaluation promotes precise checkpoint immunotherapy of advanced gastric cancer

Dongqiang Zeng et al. J Immunother Cancer. 2021 Aug.

Abstract

Background: Durable efficacy of immune checkpoint blockade (ICB) occurred in a small number of patients with metastatic gastric cancer (mGC) and the determinant biomarker of response to ICB remains unclear.

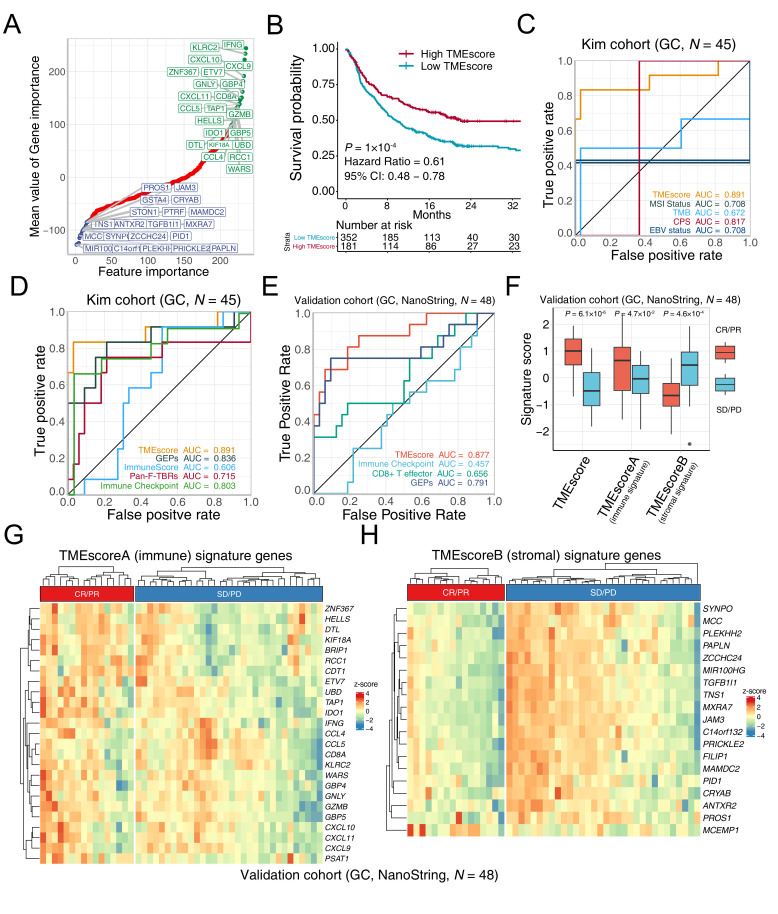
Methods: We developed an open-source TMEscore R package, to quantify the tumor microenvironment (TME) to aid in addressing this dilemma. Two advanced gastric cancer cohorts (RNAseq, N=45 and NanoString, N=48) and other advanced cancer (N=534) treated with ICB were leveraged to investigate the predictive value of TMEscore. Simultaneously, multi-omics data from The Cancer Genome Atlas of Stomach Adenocarcinoma (TCGA-STAD) and Asian Cancer Research Group (ACRG) were interrogated for underlying mechanisms.

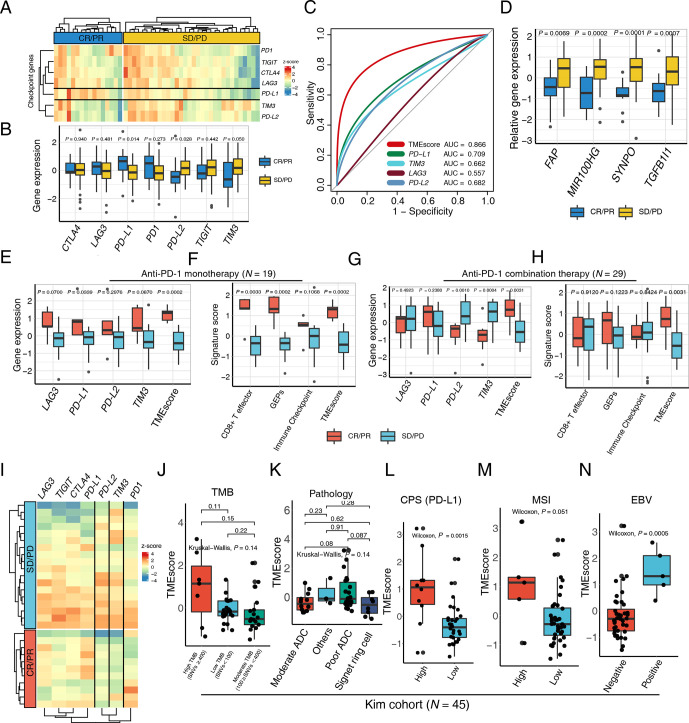
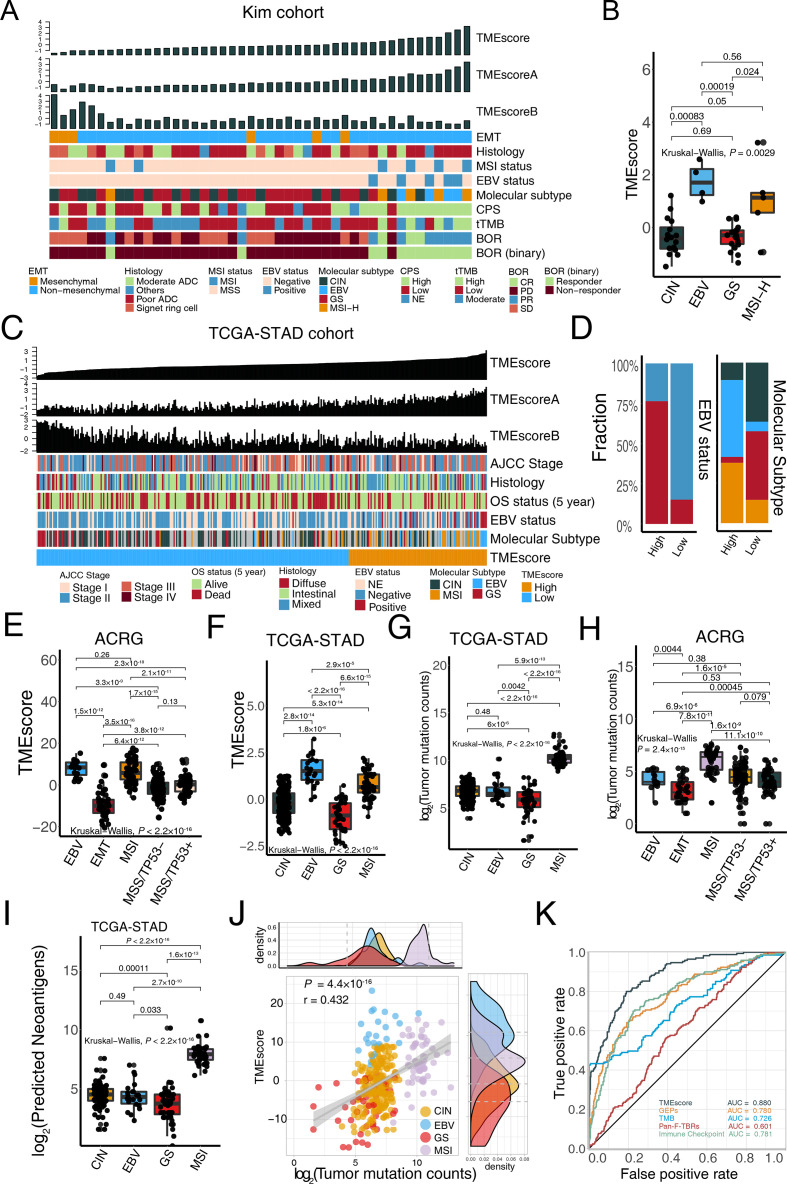
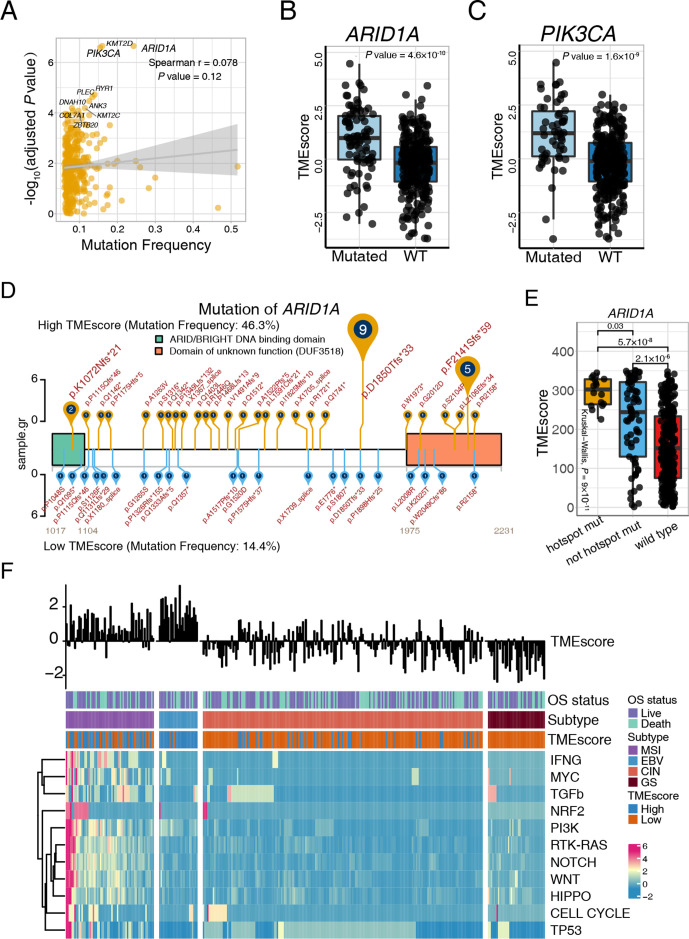
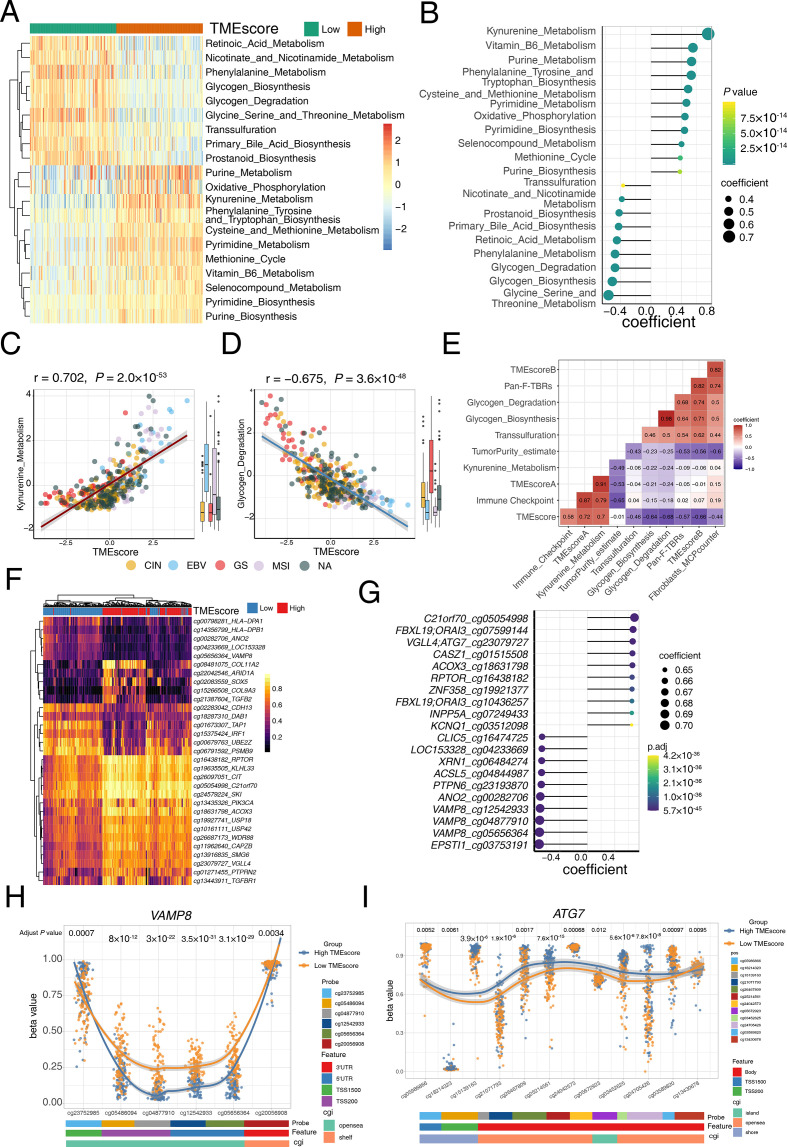
Results: The predictive capacity of TMEscore was corroborated in patient with mGC cohorts treated with pembrolizumab in a prospective phase 2 clinical trial (NCT02589496, N=45, area under the curve (AUC)=0.891). Notably, TMEscore, which has a larger AUC than programmed death-ligand 1 combined positive score, tumor mutation burden, microsatellite instability, and Epstein-Barr virus, was also validated in the multicenter advanced gastric cancer cohort using NanoString technology (N=48, AUC=0.877). Exploration of the intrinsic mechanisms of TMEscore with TCGA and ACRG multi-omics data identified TME pertinent mechanisms including mutations, metabolism pathways, and epigenetic features.

Conclusions: Current study highlighted the promising predictive value of TMEscore for patients with mGC. Exploration of TME in multi-omics gastric cancer data may provide the impetus for precision immunotherapy.

Keywords: computational biology; gastrointestinal neoplasms; immunotherapy; tumor microenvironment.


Conflict of interest statement

Competing interests: None declared.

Figures

Figure 1
Figure 1
TMEscore holds promise in predicting immunotherapeutic response. (A) Feature engineering was conducted to minimize the number of TMEscore signature genes. Gene importance was exhibited with genes significantly associated with favorable immune checkpoint blockade (ICB) responses (top right, green), and genes correlated positively with immune exclusion and negatively with immunotherapeutic efficacy (bottom left, blue). (B) Kaplan-Meier survival analysis demonstrated that a high TMEscore was significantly related to more favorable overall survival in the study of multiple meta-data (p=1×10⁻⁴, HR=0.61, 95% CI: 0.48 to 0.78, cut-off=0.08). (C) Receiver operating characteristic (ROC) analyses indicated that the TMEscore harbored the highest area under the curve (AUC) (AUC=0.891) in comparison with other reported biomarkers of ICB, comprizing microsatellite instability (MSI) status, tumor mutation burden (TMB), programmed death-ligand 1 combined positive score (CPS), and Epstein-Barr virus (EBV) status in gastric cancer (AUC=0.708, 0.672, 0.817, 0.708, respectively; p values of pair comparison test see online supplemental table S7). (D) Tumor microenvironment (TME) relevant signatures and the TMEscore are estimated to compare the predictive sensitivity for responses. ROC analyses suggested that the TMEscore substantially outperformed these published transcriptomic-based methodologies for prediction of ICB treatment response, including gene expression profile scores (GEPs), ImmunoScore, pan-fibroblast transforming growth factor-beta (TGF-β) response signature (pan-fibroblast TGF-β response signature), and immune checkpoint (AUC=0.836, 0.606, 0.715, 0.803, respectively; detailed p values of pair comparison test see online supplemental table S7) (E–H) The predictive capacity of TMEscore for treatment response is corroborated in a multicenter clinical gastric cancer cohort. TMEscore possessed highest AUC surpassing immune checkpoint, CD8+ effector T cell and GEPs (AUC=0.877, 0.457, 0.656, 0.791, respectively); (E). Box plot supported that elevated TMEscore and TMEscoreA, as well as decreased TMEscoreB of responders (CR/PR) versus non-responder (SD/PD) in multicenter cohort (p=6.1×10⁻⁶, 4.7×10⁻², 4.6×10⁻⁴, respectively); (F). Heatmaps exhibited the signature genes expression of TMEscoreA (G) and TMEscoreB (H), respectively, in the responsive (CR/PR) and the progressive (SD/PD) gastric cancer, validating prior results. CR, complete response; PD, progressive disease; PR, partial response; SD, stable disease.
Figure 2
Figure 2
TMEscore predicts efficacy of checkpoint immunotherapy alone or combination with chemotherapy. (A) A heatmap numerated the expression of various immune checkpoint genes in the responder (blue) and the non-responder (yellow) subsets, highlighting upregulation of programmed death-ligand 1 (PD-L1) in responsive patients in a multicenter cohort of gastric cancer. (B) The box plot compared the expression levels of immune checkpoint genes in the responsive (blue) and non-responsive (yellow) cancer settings and corresponding p values were displayed on the top. (C) Receiver operating characteristic curve analysis demonstrated that the TMEscore with highest predictive efficacy for therapy sensitivity (area under the curve (AUC)=0.866), outperforming all the immune checkpoints comprizing PD-L1, TIM3, LAG3, and PD-L2 (AUC=0.709, 0.662, 0.557, 0.682, respectively). (D) An elevation of stromal activation indexes, including FAP, MIR100HG, SYNPO and TGFB1l1 (p=0.0069, 0.0002, 0.0001, 0.0007, respectively), was discovered in the patients with complete response (CR) or partial response (PR) relative to the counterparts. (E–H) An upregulation of the aforementioned immune checkpoints (E) and immunotherapy pertinent biomarkers (F) including TMEscore, was measured in the context of anti-programmed cell death protein 1 (PD-1) monotherapy, as well as anti-PD-1 combination therapy (G–H). Relevant p values were depicted on the top. (I) Heatmap demonstrated aforementioned immune checkpoint expression discrepancies in the setting of anti-PD-1 combination therapy responder (red) and non-responder (blue), indicative of the upregulation of PD-L2 and TIM3 in the non-responsive subset. (J) No statistical significance was observed between tumor mutation burden (TMB) and TMEscore (Kruskal-Wallis test, p=0.14). The number of non-synonymous single nucleotide variant ≥400 was defined as high mutational load (high TMB); 100–400, moderate mutation load (moderate TMB); and <100, low mutation load (low TMB). (K) A boxplot exhibited bare statistical significance in TMEscore diversity among different pathologies of gastric cancers (Kruskal-Wallis test, p=0.14). (L) An increase of TMEscore was observed in PD-L1 combined positive score (CPS) positive patients (Wilcoxon, p=0.0015). The specimen was considered to have high PD-L1 expression if CPS≥1. (M–N) A boxplot demonstrated that gastric cancers with high microsatellite instability (MSI) status (M) (Wilcoxon, p=0.051) and positive Epstein-Barr virus (EBV) infective status (N) (Wilcoxon, p=0.0005) harbored an elevated TMEscore. ADC, adenocarcinoma; PD, progressive disease; SD, stable disease.
Figure 3
Figure 3
TMEscore is closely correlated with microsatellite instability-high (MSI-H) and Epstein-Barr virus (EBV) infective status in gastric cancer. (A) For each patient (columns) with metastatic gastric cancer, clinicopathological features and molecular characterizations were annotated. Column annotations represent epithelial–mesenchymal transition (EMT) (mesenchymal, non-mesenchymal); histology (moderate adenocarcinoma (ADC), poor ADC, signet ring cell, others); MSI status (MSS, MSI); EBV status (negative, positive); molecular subtype (chromosomal instability (CIN), EBV, genomically stable (GS), MSI-H); programmed death-ligand 1 combined positive score (CPS) (high, low, NE); tissue tumor mutation burden (tTMB); best overall response (BOR) (CR, PR, PD, SD); and binary BOR (responder, non-responder) for each sample. TMEscore, TMEscoreA, and TMEscoreB are displayed at the top of the panel. A high TMEscore is capable of identifying patients with EBV positive and MSI-H and responders to immune checkpoint blockade. (B) EBV and MSI gastric molecular subtype were substantially associated with higher TMEscore in the Kim cohort (Kruskal-Wallis test, p=0.0029). (C–D) For each patient (columns) in The Cancer Genome Atlas of Stomach Adenocarcinoma (TCGA-STAD) cohort, the landscape of clinicopathological features and molecular characterizations are displayed. Column annotations represent the AJCC stage (stage I, II, III, IV); OS 5-year (alive, dead); histology (diffuse, intestinal, mixed); EBV status (negative, positive, NE); molecular subtype (CIN, EBV, GS, MSI-H); and TME subtype (high, low) for each sample. TMEscore, TMEscoreA, and TMEscoreB are displayed at the top of the panel (C). Analysis of TCGA-STAD cohort corroborated that patients with EBV positive and MSI-H harbored a higher TMEscore (D) (Fisher’s exact test, p<2.2×10⁻¹⁶). (E–H) Boxplots indicated the TMEscore is substantially elevated in EBV and MSI molecular subtype either in both Asian Cancer Research Group (ACRG) (E) (Kruskal-Wallis test, p<2.2×10⁻¹⁶) and TCGA-STAD cohorts (F) (Kruskal-Wallis test, p<2.2×10⁻¹⁶). However, TMB is positively related to the MSI subtype but is not predictive of EBV status in both TCGA-STAD cohort (G) (Kruskal-Wallis test, p<2.2×10⁻¹⁶) and ACRG cohort (H) (Kruskal-Wallis test, p=2.4×10⁻¹⁵). (I) Neoantigens failed to identify EBV status in TCGA-STAD cohort, despite its significant correlation with MSI-H subtype (Kruskal-Wallis test, p<2.2×10⁻¹⁶). (J) A dotplot demonstrated a close correlation between TMB and the TMEscore. Every single dot represents one sample, corresponding molecular subtypes are identified in different colors (CIN: yellow, EBV: blue, GS: red, MSI: pink) (Spearman test, r=0.432, p=4.4×10⁻¹⁶). (K) ROC analyses suggested the TMEscore was predictive of EBV and MSI status of gastric cancer in TCGA-STAD and ACRG cohorts (n=634), with a higher AUC than that of gene expression profile scores and TMB (AUC=0.88, 0.78, 0.726, respectively). AJCC, The American Joint Committee on Cancer; OS, overall survival; CR, complete response; NE, unknown; PD, progressed disease; PR, partial response; SD, stable disease.
Figure 4
Figure 4
ARID1A and PIK3CA mutation potentiate antitumor immunity. (A) Mutation frequency and corresponding levels of TMEscores are exhibited in the dotplot, and the significance of ARID1A, PIK3CA, and KMT2D mutations are highlighted. Every single spot represents a gene, and statistical significance was shown through y-axis (Spearman test, r=0.078, p=0.12). (B–C) ARID1A (B) and PIK3CA (C) mutations were significantly associated with an increase of TMEscore. ARID1A (Wilcoxon, p=4.8×10⁻¹⁰) and PIK3CA (Wilcoxon, p=1.6×10⁻⁹) mutations were categorized in a binary way. (D–E) The landscape of the ARID1A mutation positions and corresponding TMEscore was displayed and highlighted p.D18550Tfs*33 and p.F2141Sfs*59 of ARID1A mutation in the high-TMEscore tumors. The mutation rates of high (yellow) and low (blue) TMEscores are shown (D). The ARID1A recurrent mutation is correlated with the higher TMEscore (Kruskal-Wallis test, p=9×10⁻¹¹) (E). (F) The landscape of intrinsic pathway mutations (rows) is characterized for each sample (columns). Column annotations represent OS status (live, dead), molecular subtype (chromosomal instability (CIN), Epstein-Barr virus (EBV), genomic stable (GS) and microsatellite instability (MSI)); and tumor microenvironment (TME) subtype (high, low). The TMEscore is displayed in the top panel. Genomic mutations were limitedly enriched in the EBV molecular subtype, which exhibited a high TMEscore. Colors (blue to red) represent the corresponding expression levels (low to high). WT, wild type; OS, overall survival.
Figure 5
Figure 5
Tumor microenvironment (TME) associated metabolism and methylation characteristics. (A) Wilcoxon test show the differentially express metabolism pathway in high and low TMEscore tumor. For each patient (columns), signaling pathways (rows) are characterized in the heatmap. Colors (blue to red) represent the corresponding expression levels (low to high). Column annotations high (orange) and low (green) TMEscore. (B) Correlation analysis highlighted the most significant metabolism pathways in the high and low TMEscore tumors. Annotations of the pathways are listed on the left. Colors (yellow to green) represent p values, and the size of each dot represents the spearman coefficient. (C) A scatter plot demonstrated a close correlation between the TMEscore and kynurenine metabolism. Every single dot represents one sample, and corresponding molecular subtypes are identified in different colors (chromosomal instability (CIN): yellow, Epstein-Barr virus (EBV): blue, genomically stable (GS): red, microsatellite instability (MSI): pink; Spearman test, r=0.702, p=2.0×10−53). Kynurenine metabolism was significantly activated in EBV and MSI subtype (Kruskal-Wallis test, p=3.3×10⁻¹⁰). (D) A scatter plot demonstrated a close correlation between the TMEscore and glycogen metabolism. Every single dot represents one sample, and corresponding molecular subtypes are identified in different colors (CIN: yellow, EBV: blue, GS: red, MSI: pink; Spearman test, r=−0.675, p=3.6×10−48). Glycogen metabolism was significantly activated in GS subtype (Kruskal-Wallis test, p<2.2×10⁻¹⁶). (E) A corrplot displays correlations among kynurenine metabolism, glycogen metabolism and TME-related signatures. Coefficients are characterized in number. Colors red and purple represent positive and negative correlations. (F) The heatmap exhibited the landscape of differentially methylated genes in high and low TMEscore tumors. For each patient (columns), significant methylated regions of specific genes (rows, annotated on the right) are characterized. The column annotations represent high (red) and low (blue) TMEscore. Colors (yellow to purple) represent the corresponding methylation levels (low to high). (G) Correlation analysis highlighted the top 20 methylated probes and genes in the high and low TMEscore tumors. Annotations of the probes and genes are listed on the left. Colors (green to purple) represent p values, and the size of each dot represents the spearman coefficient. (H) The discrepancy of VAMP8 methylation in different regions in high (blue) and low (yellow) TMEscore. Annotations of probes (cg23752985, cg05486094, cg04877910, cg12542933, cg05656364, cg20056908), features (3′UTR, 5′UTR, TSS1500, TSS200), and CpG islands (CGI) (opensea, shelf) are exhibited on the bottom panel. (I) The discrepancy of ATG7 methylation in different regions in high (blue) and low (yellow) TMEscore. Pan-F-TBRs, pan-fibroblast TGF-β response signature.

References

    1. Kang Y-K, Boku N, Satoh T, et al. . Nivolumab in patients with advanced gastric or gastro-oesophageal junction cancer refractory to, or intolerant of, at least two previous chemotherapy regimens (ONO-4538-12, ATTRACTION-2): a randomised, double-blind, placebo-controlled, phase 3 trial. Lancet 2017;390:2461–71. 10.1016/S0140-6736(17)31827-5 - DOI - PubMed
    1. Fuchs CS, Doi T, Jang RW, et al. . Safety and efficacy of pembrolizumab monotherapy in patients with previously treated advanced gastric and gastroesophageal junction cancer: phase 2 clinical KEYNOTE-059 trial. JAMA Oncol 2018;4:e180013. 10.1001/jamaoncol.2018.0013 - DOI - PMC - PubMed
    1. Shitara K, Özgüroğlu M, Bang Y-J, et al. . Pembrolizumab versus paclitaxel for previously treated, advanced gastric or gastro-oesophageal junction cancer (KEYNOTE-061): a randomised, open-label, controlled, phase 3 trial. Lancet 2018;392:123–33. 10.1016/S0140-6736(18)31257-1 - DOI - PubMed
    1. Nanda R, Chow LQM, Dees EC, et al. . Pembrolizumab in patients with advanced triple-negative breast cancer: phase Ib KEYNOTE-012 study. J Clin Oncol 2016;34:2460–7. 10.1200/JCO.2015.64.8931 - DOI - PMC - PubMed
    1. Kim ST, Cristescu R, Bass AJ, et al. . Comprehensive molecular characterization of clinical responses to PD-1 inhibition in metastatic gastric cancer. Nat Med 2018;24:1449–58. 10.1038/s41591-018-0101-z - DOI - PubMed

Publication types

Substances