. 2021 Aug 10;4(10):e202000942.
doi: 10.26508/lsa.202000942. Print 2021 Oct.

Extracellular matrix mediates moruloid-blastuloid morphodynamics in malignant ovarian spheroids

Affiliations

Extracellular matrix mediates moruloid-blastuloid morphodynamics in malignant ovarian spheroids

Jimpi Langthasa et al. Life Sci Alliance. .

Abstract

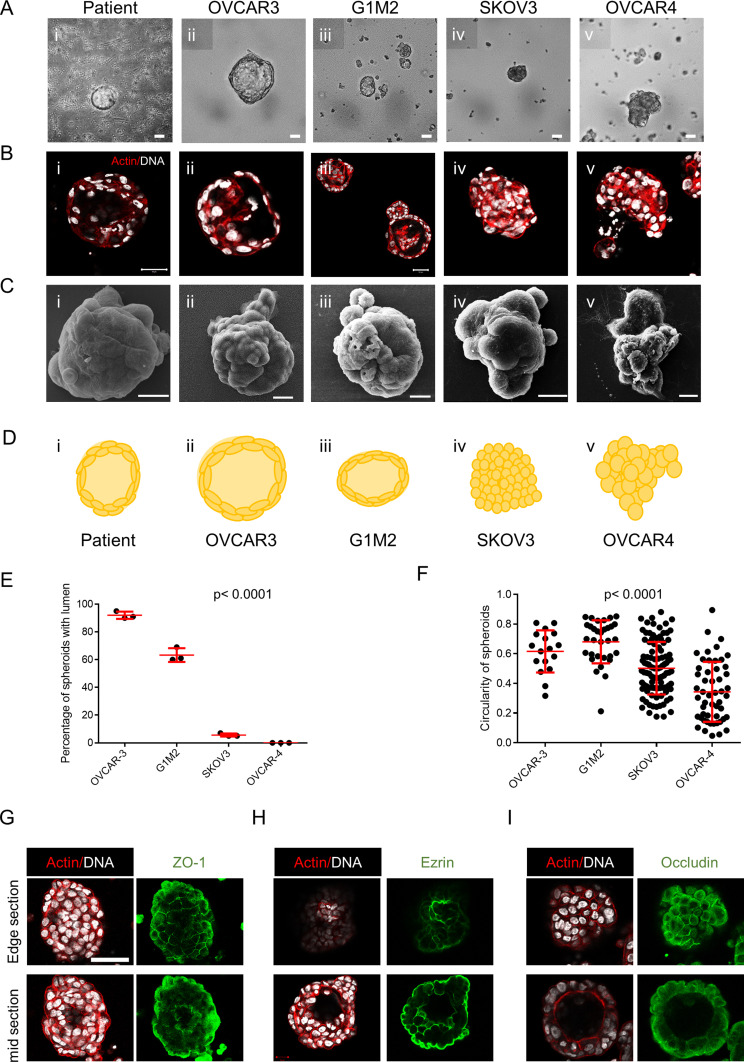
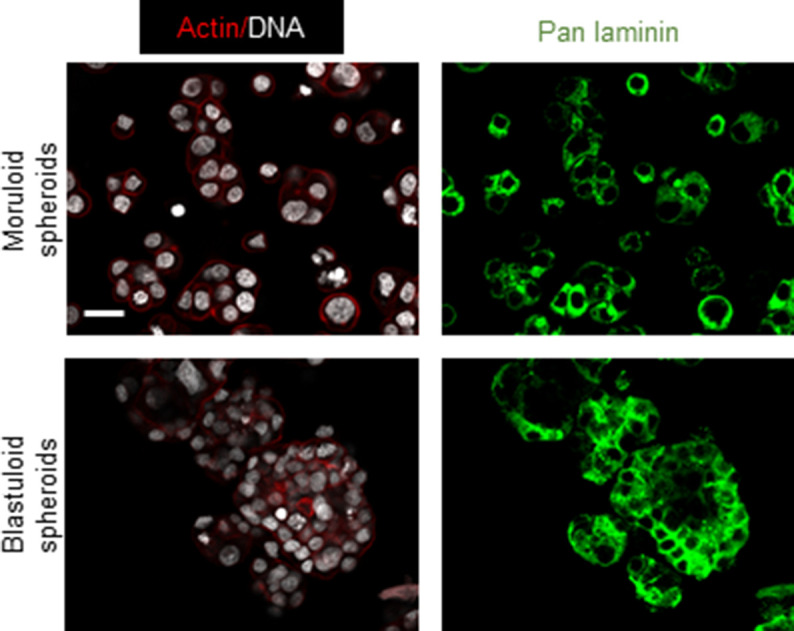
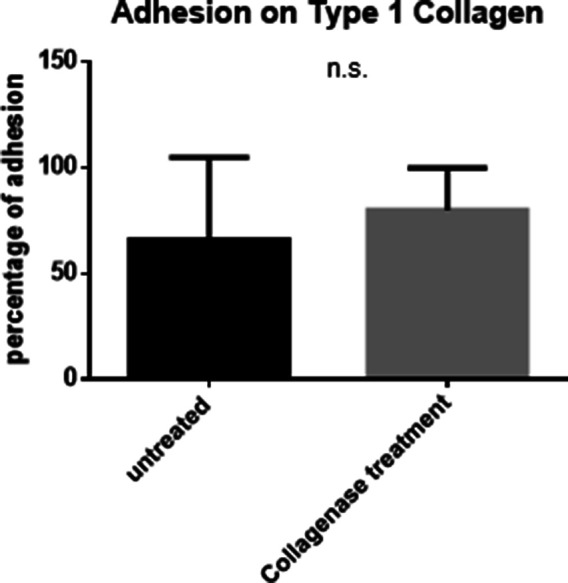
Ovarian cancer metastasizes into peritoneum through dissemination of transformed epithelia as multicellular spheroids. Harvested from the malignant ascites of patients, spheroids exhibit startling features of organization typical to homeostatic glandular tissues: lumen surrounded by smoothly contoured and adhered epithelia. Herein, we demonstrate that cells of specific ovarian cancer lines in suspension, aggregate into dysmorphic solid "moruloid" clusters that permit intercellular movement, cell penetration, and interspheroidal coalescence. Moruloid clusters subsequently mature into "blastuloid" spheroids with smooth contours, a temporally dynamic lumen and immotile cells. Blastuloid spheroids neither coalesce nor allow cell penetration. Ultrastructural examination reveals a basement membrane-like extracellular matrix coat on the surface of blastuloid, but not moruloid, spheroids. Quantitative proteomics reveals down-regulation in ECM protein Fibronectin-1 associated with the moruloid-blastuloid transition; immunocytochemistry also confirms the relocalization of basement membrane ECM proteins: collagen IV and laminin to the surface of blastuloid spheroids. Fibronectin depletion accelerates, and enzymatic basement membrane debridement impairs, lumen formation, respectively. The regulation by ECM dynamics of the morphogenesis of cancer spheroids potentially influences the progression of the disease.


Conflict of interest statement

The authors declare that they have no conflict of interest.

Figures

Figure S1.
Figure S1.. Bright-field images of patient spheroids showing lumen-less dysmorphic clusters (red arrowhead), lumen-containing spheroids (yellow arrowhead), and single cells (blue arrowhead) in a same sample.
Scale bar: 50 μm (n ≥ 3).
Figure 1.
Figure 1.. Spheroids of ovarian cancer epithelia show multicellular organization.
(A, B, C) Photomicrographs of spheroids/clusters from patient malignant ascites (i), OVCAR3 (ii), G1M2 (iii), SKOV3 (iv), and OVCAR4 (v) cells imaged using bright-field microscopy (A), laser confocal microscopy staining DNA (DAPI; white) and F-actin (phalloidin; red) (B) and scanning electron microscopy (C) (n = 3, multiple spheroids analyzed for each repeat). (D) Cartoon depiction of the morphology of spheroids/clusters, highlighting lumen formation and outer contour based on (A, B, C). (E) Graph showing the percentage of lumen-containing spheroids from OVCAR3, G1M2, SKOV3, and OVCAR4 (n = 3, multiple spheroids analyzed for each repeat). Bars represent mean ± SD. Significance measured using one-way ANOVA. (F) Graph showing mean circularity of OVCAR3, G1M2, SKOV3, and OVCAR4 clusters from a representative experiment (n = 3, multiple spheroids analyzed for each repeat) Bars represent mean ± SD. Significance measured using one-way ANOVA. (G, H, I) Photomicrographs of OVCAR3 spheroids imaged using laser confocal photomicrography OVCAR3 spheroids stained for (G) ZO-1, (H) ezrin, and (I) occludin (all in green) and counterstaining for F-actin (red) and DNA (white) with the top row representing top edge z section of spheroids and bottom row representing mid Z section of the spheroids (n ≥ 2, multiple spheroids analyzed for each repeat). (E, F) Bars in (E, F) represent means ± SEM. (A, B, C, G, H, I) Scale bar for (A, B, G, H, I) is 50 μm and for (C) is 10 μm.
Figure S2.
Figure S2.. Laser confocal photomicrograph middle stack–orthogonal axes confirming the lumen present in the spheroids of patients (left) and OVCAR3 (middle) and G1M2 (right).
Scale bar: 50 μm (n = 3).
Figure S3.
Figure S3.. OVCAR3 and G1M2 blastuloid spheroids show similar cavitational morphologies.
(Ai, Aii, Bi, Bii) A smooth cavitational contour seen for OVCAR3 spheroids based on laser confocal micrography (middle Z slice) (Ai) and scanning electron microscopy (Aii) as well as for G1M2 spheroids using laser confocal micrography (middle Z slice) (Bi), scanning electron microscopy (Bii). Scale bar for (Ai–ii) and (Bi): 50 μm, for (Bii): 10 μm (n = 3).
Figure S4.
Figure S4.. Staining of polarity markers (ZO-1, Ezrin and Occludin) in G1M2 blastuloid spheroids.
(A, B, C) Photomicrographs of G1M2 blastuloid spheroids imaged using laser confocal photomicrography OVCAR3 spheroids stained for (A) ZO-1, (B) ezrin, and (C) occludin (all in green) and counterstaining for F-actin (red) and DNA (white) with the top row representing top edge z section of spheroids and bottom row representing mid Z section of the spheroids (n ≥ 2, multiple spheroids analyzed for each repeat). Scale bar: 50 μm.
Figure S5.
Figure S5.. Graph showing the proportion of cells per spheroid that are staining for Edu compared between moruloid and blastuloid morphologies.
Bars represent means ± SEM. Significance was measured using unpaired t test with Welch’s correction (n = 3).
Figure 2.
Figure 2.. Distinctive features of moruloid and blastuloid morphologies in ovarian cancer spheroids.
(A, B, C) Photomicrographs imaged using bright-field (i: moruloid, ii: blastuloid), laser confocal (iii: moruloid, iv: blastuloid; staining for DNA using DAPI [white] and for F-actin using phalloidin [red]), and scanning electron-microscopy (v: moruloid, vi: blastuloid) of OVCAR3 (A), G1M2 (B) and SKOV3 (C) spheroids (n = 3, multiple spheroids analyzed for each repeat). (D, E) Graphs showing change in size (D) and circularity (E) of OVCAR3 spheroids with moruloid (left) and blastuloid (right) morphologies from a representative morphometric experiment (n = 3 multiple spheroids analyzed for each repeat). Bars represent mean ± SD. Significance was tested using unpaired t test with Welch’s correction. (F) SEM photomicrographs of patient-derived spheroids showing moruloid (left) and blastuloid (right) morphologies (n ≥ 3, multiple spheroids analyzed for each repeat). (G) Photomicrographs taken at 0 and 6 h from time-lapse laser confocal videography of moruloid and blastuloid spheroids (constituted from a suspension of GFP- and red fluorescent protein (RFP)-expressing OVCAR3 cells) showing rearrangement of motile cells within them (white dotted lines highlight the position of motile cells) (edges rendered for fluorescence using Image J to show cell boundaries; see Videos S1 and S2). Graph on the right shows the difference in intercellular distance per unit time during time lapse videography (n = 3 multiple spheroids analyzed for each repeat). Bars represent mean ± SEM. Significance was tested using unpaired t test with Welch’s correction. (H) Bright-field micrographs of representative blastuloid spheroids from patient ascites (top), OVCAR3 (bottom left) and G1M2 (bottom right) imaged at regular time intervals showing temporal fluctuations in lumen size; see Videos S3–S5. (n = 3 independent repeats with multiple spheroids observed within the repeats). (D, E, G) Error bars in (D, E, G) signify median with interquartile range. Significance was measured using unpaired t test with Welch’s correction. (A, B, Ci–iv, v–vi, F) Scale bar for (A, B, Ci–iv) is 50 μm and for (A, B, Cv–vi) and (F) is 10 μm.
Figure S6.
Figure S6.. G1M2 blastuloid spheroids are bigger and more circular than moruloid spheroids.
(A, B) Graphs showing change in size (A) and circularity (B) of G1M2 spheroids with moruloid (left) and blastuloid (right) morphologies in a representative morphometric experiment. Error bars signify mean ± SD. Significance was measured using unpaired t test with Welch’s correction (n = 3 independent experiments with multiple spheroids studied in each experiment).
Figure S7.
Figure S7.. Graph showing change in solidity of OVCAR3 spheroids with moruloid (left) and blastuloid (right) morphologies.
Error bars signify mean ± SD from a representative morphometric experiment. Significance was measured using unpaired t test with Welch’s correction (n = 2 independent experiments with multiple spheroids analyzed).
Figure S8.
Figure S8.. Rendering of GFP- and RFP-expressing cells through the “Find edges” plugin for Image J, wherein only cell edges are highlighted for better visualization of intercellular movement.
Scale bar = 50 μm.
Figure S9.
Figure S9.. Scanning electron photomicrographs of patient, OVCAR3, and G1M2 spheroids showing a porous non-fibrillar ECM-like coating on the surface.
Scale bar = 10 μm.
Figure 3.
Figure 3.. Moruloid and blastuloid OVCAR3 spheroids show distinct ECM expression dynamics.
(A) Quantitative proteomic heat map clustered hierarchically between triplicate samples of OVCAR3 moruloid and blastuloid spheroids showing significantly up-regulated (green) and down-regulated (red) proteins. (A, B) Statistically significant enrichment of ontologies of the protein set shown in (A) based on cellular location (n = 3, cutoff: P < 0.005). (C) qPCR shows mRNA levels of Fibronectin-1 mRNA levels are decreased in blastuloid OVCAR3 spheroids compared with moruloid counterparts (18sRNA used as internal control; n = 3 independent biological experiments with at least duplicate samples run in each experiment). Error bars denote mean ± SEM. Paired t test was performed on ΔCt values for statistical significance (*P < 0.05). (D) Micrographs of OVCAR3 with laser confocal microscopy cultured as monolayers (top) moruloid spheroids (middle) and blastuloid spheroids (bottom) stained for Fibronectin-1 (green) and counterstained with F-actin (phalloidin; red) and DNA (DAPI; white) (n = 3). (E) Micrographs of OVCAR3 with laser confocal microscopy cultured as monolayers transduced with scrambled control shRNA (top) and shRNA against fibronectin (bottom) stained for Fibronectin (green) and counterstained with F-actin (phalloidin; red) and DNA (DAPI; white) (n = 3). (F) Phase contrast micrographs of representative OVCAR3 spheroids imaged at day 3 showing incipient lumen at day 3 upon fibronectin-1 knock down (bottom) compared with scrambled control (top) with a significant increase in lumen-containing spheroids in fibronectin-depleted spheroids (G) (n = 4, bars denote mean ± SEM). Significance tested using unpaired t test with Welch’s correction. Scale bar: 50 μm.
Figure S10.
Figure S10.. Statistically significant enrichment of ontologies of the protein set shown in Fig 3A (moruloid versus blastuloid spheroids) based on molecular function (n = 3, cutoff: P < 0.005).
Figure S11.
Figure S11.. Micrographs of G1M2 with laser confocal microscopy cultured as monolayers (top), moruloid spheroids (middle) and blastuloid spheroids (bottom) stained for Fibronectin (green) and counterstained with F-actin (phalloidin; red) and DNA (DAPI; white) (n = 1).
Scale bar: 50 μm.
Figure S12.
Figure S12.. qPCR confirmation of Fn1 knock down in OVCAR3 cell line.
Showing decreased mRNA level in Fn1 knock down compared to scrambled control (18sRNA used as internal control; n = 2 independent biological experiments with at least duplicate samples run in each experiment). Error bars denote mean ± SEM.
Figure 4.
Figure 4.. The presence of basement membrane-like ECM coat correlates with lumen formation in spheroids.
(A, B) Laser confocal photomicrographs showing collagen IV (green) (A) and pan-laminin (green) (B) localization using indirect immunofluorescence in monolayers (top row) moruloid-(middle row) and blastuloid- (bottom row) spheroids from OVCAR3 cells counterstained for F-actin with phalloidin (red) and DNA with DAPI (white). (C, D) Laser confocal photomicrographs showing collagen IV (green) (C) and pan-laminin (green) (D) localization using indirect immunofluorescence in patient spheroids counterstained for F-actin with phalloidin (red) and DNA with DAPI (white). (E) Laser confocal photomicrographs stained for Collagen IV (green) and DNA (DAPI; white) in untreated control OVCAR3 spheroids (left) and upon treatment with Collagenase IV (right). (F) Phase-contrast photomicrographs showing the morphologies of spheroids with no treatment (control, left) and upon treatment with Collagenase IV (right). (G) Bright-field photomicrographs taken at 0, 16, and 48 h from time-lapse videography of blastuloid OVCAR3 spheroids initiated after addition of collagenase IV (see Video S6). (G) White dotted lines in the black background highlight the changes in the contour of lumen in (G). (three independent repeats with multiple spheroids analyzed for each repeat) Graph on the right shows change in lumen size calculated using paired t test. Bars represent mean ± SD from a representative experiment. (H) Bright-field photomicrographs taken at 0, 6,, and 18 h from time-lapse videography of OVCAR3 spheroids pretreated with Collagenase IV with videography initiated after the removal of Collagenase IV (see Video S7). (H) White dotted lines in the black background highlight the changes in the contour of lumen in (H). (n = 3 independent repeats with multiple spheroids analyzed for each repeat) Graph on the right shows change in lumen size calculated using paired t test. Bars represent mean ± SD from a representative experiment. (A, B, C, D, E, F, G, H) Scale bar for (A, B, C, D, E, F, G, H): 50 μm.
Figure S13.
Figure S13.. Laser confocal photomicrographs showing pan-laminin (green) localization using indirect immunofluorescence moruloid- (top row) and blastuloid- (bottom row) spheroids from G1M2 cells counterstained for F-actin with phalloidin (red) and DNA with DAPI (white) (n = 2).
Scale bar: 20 μm.
Figure S14.
Figure S14.. Laser confocal photomicrographs showing NCAM1 (green) localization using indirect immunofluorescence in monolayers (top row) moruloid-(middle row) and blastuloid- (bottom row) spheroids from OVCAR3 cells counterstained for F-actin with phalloidin (red) and DNA with DAPI (white) (n = 2).
Scale bar: 50 μm.
Figure S15.
Figure S15.. Scanning electron microscopy photomicrographs of blastuloid OVCAR3 spheroids untreated (left) and 600 U collagenase treated (right), confirming removal of ECM (n = 3).
Scale bar = 10 μm.
Figure S16.
Figure S16.. Micrographs of OVCAR3 blastuloid spheroids untreated (top) and collagenase treated (bottom) with laser confocal microscopy showing calcein AM-positive (green) and propidium iodide (red) (n = 2).
Scale bar: 50 μm.
Figure S17.
Figure S17.. Graph showing relative percentage of lumen containing G1M2 blastuloid spheroids, untreated (left), and upon treatment with collagenase IV (right).
Bars represent means ± SEM. Significance was measured using unpaired t test with Welch’s correction (n = 2).
Figure 5.
Figure 5.. Blastuloid spheroids are morphogenetically more stable than moruloid spheroids.
(A, B) Laser confocal photomicrographs of moruloid (A) and blastuloid (B) spheroids expressing GFP, which were cultured with single cells expressing RFP for 24 h and counterstained for DNA (DAPI; white) (n = 3 independent repeats with multiple spheroids analyzed for each repeat). Graph on the right shows differences in proportion of spheroids incorporating cells calculated using unpaired t test with Welch’s correction. Bars represent mean ± SD. (C, D) Laser confocal photomicrographs of spheroids initially formed from separate suspensions of GFP- and RFP-expressing OVCAR3 cells and then cultured together for 24 h and counterstained for DNA (DAPI; white) (n = 3 independent repeats with multiple spheroids analyzed for each repeat). Graph on the right shows differences in proportion of spheroids exhibiting coalescence calculated using unpaired t test with Welch’s correction. Bars represent mean ± SD. (E) Laser confocal photomicrographs of blastuloid spheroids expressing GFP, pretreated with collagenase IV and then cultured with single OVCAR3 cells expressing RFP for 24 h and counterstained for DNA (DAPI; white) (n = 3). (F) Laser confocal photomicrographs of blastuloid spheroids expressing GFP, pretreated with Collagenase IV and then cultured with blastuloid spheroids expressing RFP (also pretreated with Collagenase IV for 24 h and counterstained for DNA) (DAPI; white) (n = 3). (G, H, I, J) Bar graphs showing relative adhesion of blastuloid spheroids, untreated, and pretreated with collagenase IV, when cultured on top of laminin-rich basement membrane scaffolds (G), and 4–6-wk BALB/c murine mesenteries that are placed as substrata using transwells (schematic, H). Phase contrast micrographs of control (top) and collagenase-treated spheroids adhered to murine mesentery shown in (I) and proportion of adhesion shown in (J) (n = 3 independent repeats with multiple spheroids analyzed for each repeat). Bars represent means ± SEM. Significance was measured using ratio paired t test. (A, B, C, D, E, F) Scale bar for (A, B, C, D, E, F) 50 μm.
Figure S18.
Figure S18.. Graphs showing the proportion of blastuloid spheroids that show interspheroidal coalescence (left) or single cell incorporation (right) into their morphology with or without collagenase treatment.
Bars represent means ± SEM. Significance was measured using unpaired t test (n = 3).
Figure S19.
Figure S19.. Bar graph showing relative adhesion of OVCAR3 blastuloid spheroids, untreated (left), and pretreated with Collagenase IV (right) when cultured on top of collagen I scaffold.
Bars represent means ± SEM. Significance was measured using unpaired t test with Welch’s correction (n = 3).
Figure S20.
Figure S20.. Phase contrast images of OVCAR3 spheroids which were treated with cilengitide (100 μg/ml) or vehicle control.
(A) In the first experiment, cells were treated with vehicle (left) or cilengitide (right) before spheroidogenesis began. (B) In the second experiment, moruloid spheroids were treated with vehicle (left) and cilengitide (right) and observed after 3 d of culture (n = 1). Scale bar is 100 μm.
Figure S21.
Figure S21.. Stage-specific changes in expression of laminin encoding genes, as well as effects of their expression on overall survival in patients with cystadenocarcinoma curated within the cancer genome atlas database through UALCAN (Chandrashekar et al, 2017).

Similar articles

Cited by

References

    1. Achilli TM, Meyer J, Morgan JR (2012) Advances in the formation, use and understanding of multi-cellular spheroids. Expert Opin Biol Ther 12: 1347–1360. 10.1517/14712598.2012.707181 - DOI - PMC - PubMed
    1. Benítez M, Hernández-Hernández V, Newman SA, Niklas KJ (2018) Dynamical patterning modules, biogeneric materials, and the evolution of multicellular plants. Front Plant Sci 9: 871. 10.3389/fpls.2018.00871 - DOI - PMC - PubMed
    1. Bhat R, Bissell MJ (2014) Of plasticity and specificity: Dialectics of the microenvironment and macroenvironment and the organ phenotype. Wiley Interdiscip Rev Dev Biol 3: 147–163. 10.1002/wdev.130 - DOI - PubMed
    1. Bissell MJ, Hines WC (2011) Why don’t we get more cancer? A proposed role of the microenvironment in restraining cancer progression. Nat Med 17: 320–329. 10.1038/nm.2328 - DOI - PMC - PubMed
    1. Burleson KM, Boente MP, Pambuccian SE, Skubitz AP (2006) Disaggregation and invasion of ovarian carcinoma ascites spheroids. J Transl Med 4: 6. 10.1186/1479-5876-4-6 - DOI - PMC - PubMed

Publication types