. 2021 Aug 10;12(1):4829.
doi: 10.1038/s41467-021-25025-4.

Adipose tissue hyaluronan production improves systemic glucose homeostasis and primes adipocytes for CL 316,243-stimulated lipolysis

Affiliations

Adipose tissue hyaluronan production improves systemic glucose homeostasis and primes adipocytes for CL 316,243-stimulated lipolysis

Yi Zhu et al. Nat Commun. .

Abstract

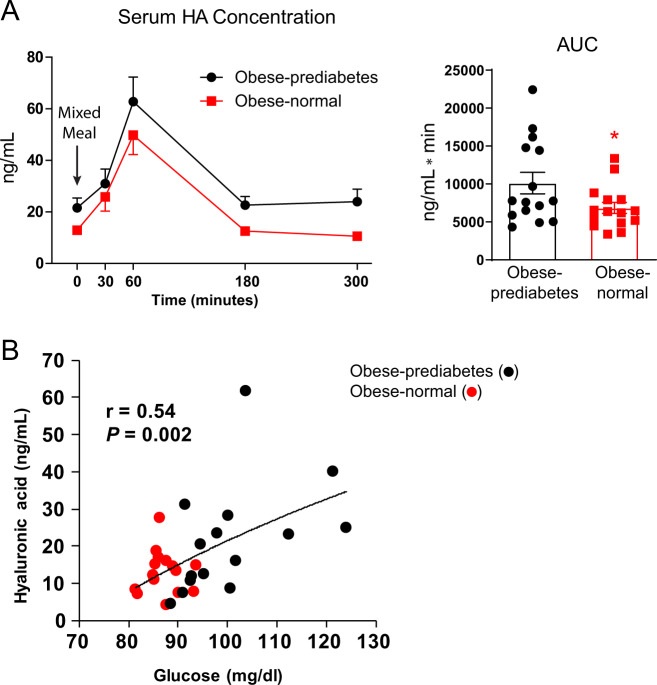
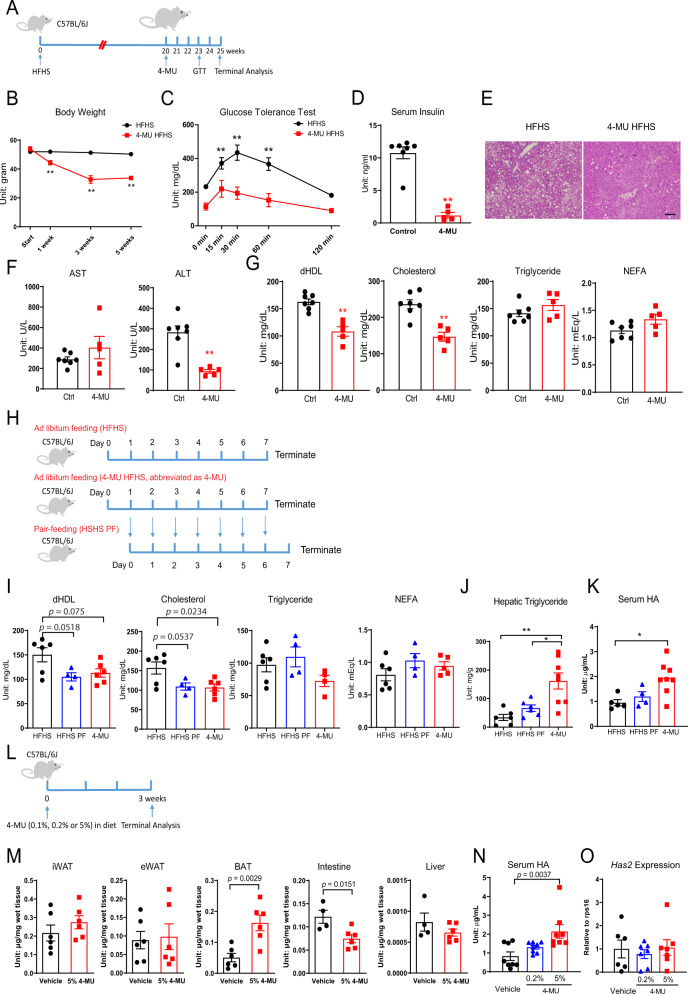
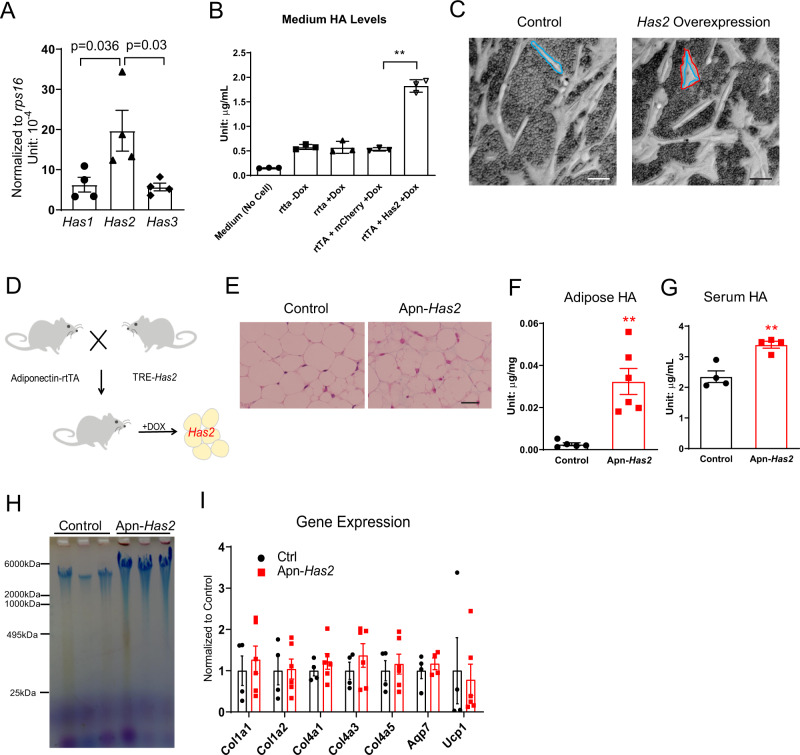
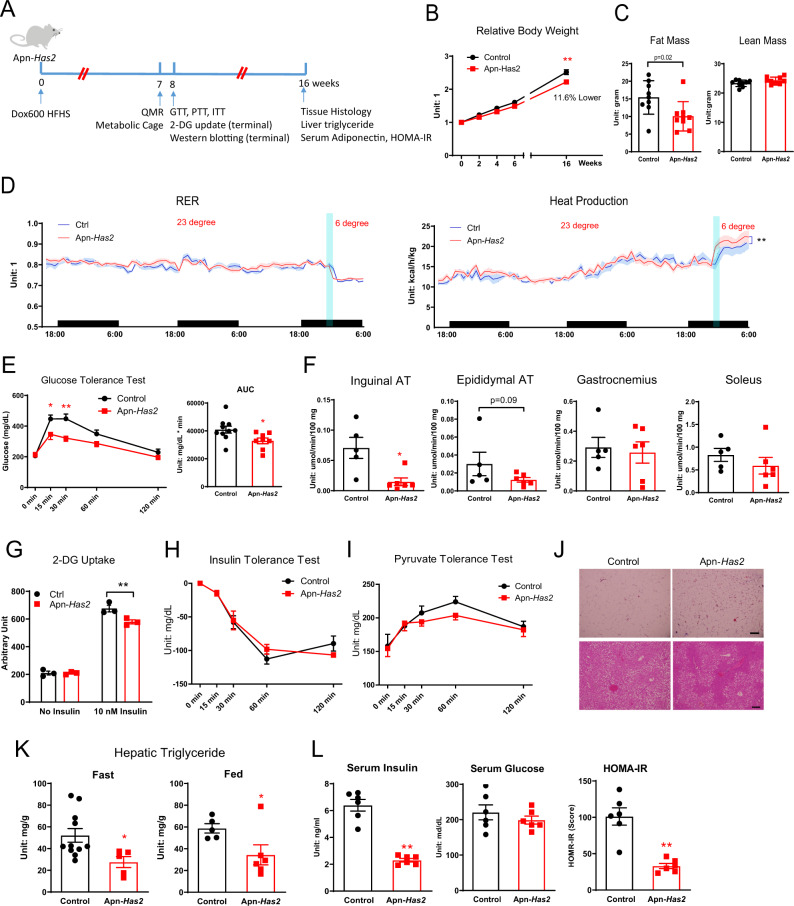
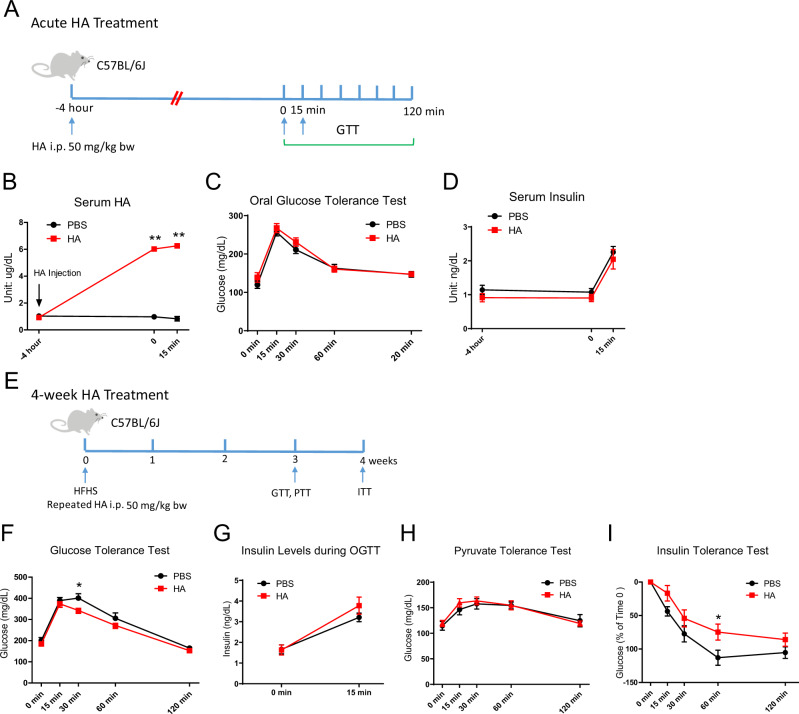
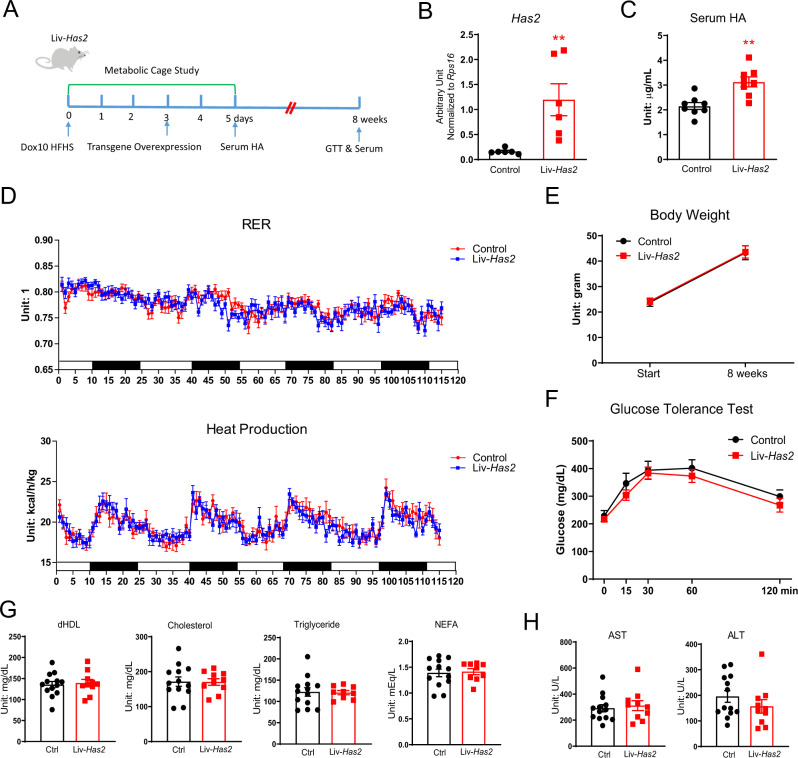
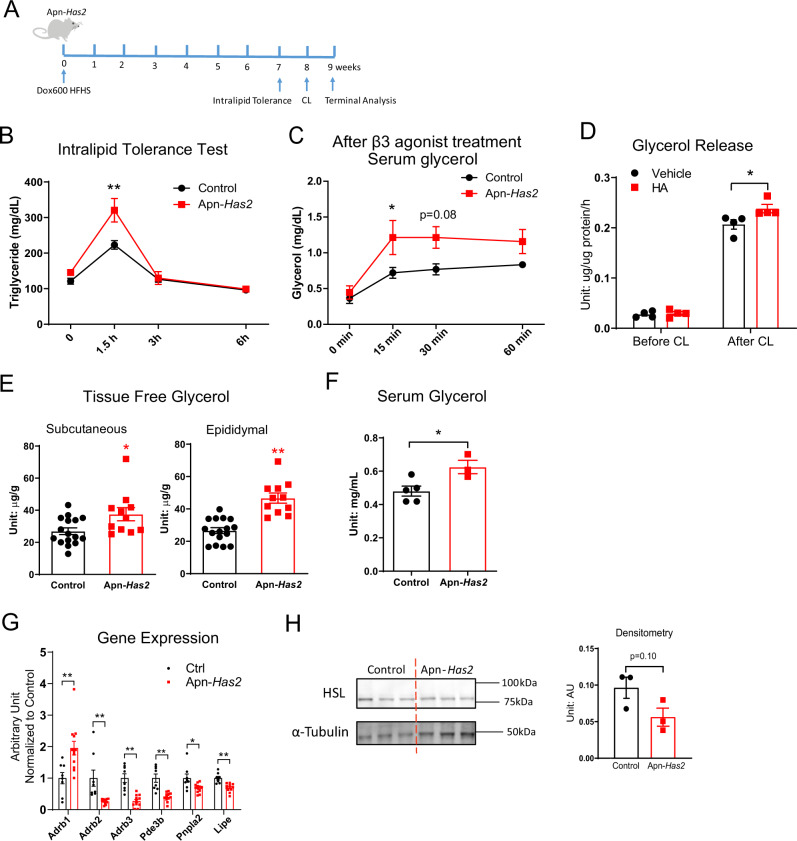
Plasma hyaluronan (HA) increases systemically in type 2 diabetes (T2D) and the HA synthesis inhibitor, 4-Methylumbelliferone, has been proposed to treat the disease. However, HA is also implicated in normal physiology. Therefore, we generated a Hyaluronan Synthase 2 transgenic mouse line, driven by a tet-response element promoter to understand the role of HA in systemic metabolism. To our surprise, adipocyte-specific overproduction of HA leads to smaller adipocytes and protects mice from high-fat-high-sucrose-diet-induced obesity and glucose intolerance. Adipocytes also have more free glycerol that can be released upon beta3 adrenergic stimulation. Improvements in glucose tolerance were not linked to increased plasma HA. Instead, an HA-driven systemic substrate redistribution and adipose tissue-liver crosstalk contributes to the systemic glucose improvements. In summary, we demonstrate an unexpected improvement in glucose metabolism as a consequence of HA overproduction in adipose tissue, which argues against the use of systemic HA synthesis inhibitors to treat obesity and T2D.


Conflict of interest statement

The authors declare no competing interests.

Figures

Fig. 1
Fig. 1. Circulating HA inversely correlates with metabolic fitness in the human.
A Obese-prediabetes (Obese-prediabetes; n = 15 patients) patients have higher levels of circulating HA compared to obese-normal (Obese-normal; n = 15 patients) patients. Subjects ingested a mixed meal at the indicated time point. Mean ± s.e.m; For AUC, two-tailed t-test, p = 0.0499. *indicates p ≤ 0.05. B Plasma HA concentrations (t = 0’) were directly correlated with basal plasma glucose concentrations. Logarithmic regression analysis was used to determine the line of best fit to the data.
Fig. 2
Fig. 2. 4-MU treatment on HA levels, glucose, and lipid metabolism.
A Schematic representation of mouse treatment for panels BG. B Body weight after 5 weeks of 4-MU HFHS treatment (n = 7 mice for HFHS, n = 6 mice for 4-MU HFHS treatment group). Two-way ANOVA followed by Sidak’s multiple comparisons test, adjusted p-value = 0.7473, 0.0006, <0.0001, <0.0001 for start, 1 week, 3 weeks and 5 weeks, respectively. C Glucose tolerance after 3 weeks of 4-MU HFHS treatment (n = 7 mice for HFHS, n = 6 mice for 4-MU HFHS treatment group). Two-way ANOVA followed by Sidak’s multiple comparisons test, adjusted p-value = 0.0646, 0.0084, <0.0001, 0.0001, 0.238 for 0, 15, 30, 60, and 120 min, respectively. D Fasting insulin levels after 5 weeks of 4-MU HFHS treatment (n = 7 mice for HFHS, n = 6 mice for 4-MU HFHS treatment group). Two-tailed t-test, p < 0.0001. E Representative pictures of hepatic lipid accumulation. Scale bar = 100 μm. F Serum AST and ALT enzymatic activity after 5 weeks of 4-MU treatment (n = 7 mice for HFHS, n = 5 mice for 4-MU HFHS treatment group). Two-tailed t-test, p = 0.2547 and 0.0006 for AST and ALT, respectively. G Serum dHDL, Cholesterol, Triglyceride and NEFA levels after 5 weeks of 4-MU HFHS treatment (n = 7 mice for HFHS, n = 5 mice for 4-MU HFHS treatment group). Two-tailed t-test, p = 0.0002, 0.0005, 0.2057, 0.0691 for dHDL, Cholesterol, Triglyceride and NEFA, respectively. H Schematic representation of mouse treatment for panels IK. The average amount of food eaten by mice on day “N” in ad libitum 4-MU HFHS feeding group will be given to pair-fed group on day “N + 1”. I Serum dHDL, Cholesterol, Triglycerides and NEFA levels (n = 6 mice for HFHS, n = 4 mice for HFHS PF, n = 8 mice for 4-MU treatment group). One-way ANOVA followed by Tukey’s multiple comparisons test. p-values are reported on the graph. J Hepatic triglyceride content (n = 6 mice for HFHS, n = 6 mice for HFHS PF, n = 8 mice for 4-MU treatment group). One-way ANOVA followed by Tukey’s multiple comparisons test. Adjusted p = 0.0014 for HFHS vs. 4-MU, adjusted p = 0.0139 for HFHS PF vs. 4-MU. K Serum HA levels (n = 5 mice for HFHS, n = 4 mice for HFHS PF, n = 8 mice for 4-MU treatment group). One-way ANOVA followed by Tukey’s multiple comparisons test. Adjusted p = 0.0131 for HFHS vs. 4-MU, adjusted p = 0.0851 for HFHS PF vs. 4-MU. L Schematic representation of mouse treatment for panels MO. Multiple cohorts of mice were used. M Tissue HA levels from mice treated with 5% 4-MU in diet. iWAT: inguinal adipose tissue, eWAT: epididymal adipose tissue, BAT: brown adipose tissue (n = 6 mice for each group). Intestines and livers were harvested from a different cohort of mice undergoing the same treatment (n = 4 mice for vehicle treatment, n = 6 mice for 5% 4-MU treatment). Two-tailed t-test. N Serum HA levels from mice treated with 0.2% or 5% 4-MU HFHS (n = 8 mice for each group). One-way ANOVA followed by Tukey’s multiple comparisons test. O Adipose tissue Has2 expression from mice treated with 0.2% or 5% 4-MU HFHS (n = 6 mice for control group, n = 7 mice for 0.2% 4-MU and 5% 4-MU). One-way ANOVA followed by Tukey’s multiple comparisons test. All data are presented as mean ± s.e.m. *indicates p ≤ 0.05, **indicates p ≤ 0.01.
Fig. 3
Fig. 3. Has2 overexpression increases HMW HA.
AHas1, Has2, and Has3 expression levels in the adipose tissue from 16-week-old C57BL/6J mice fed with normal chow diet (n = 4). One-way ANOVA followed by Tukey’s multiple comparisons test. B HEK293 cells overexpressing Has2 increase medium HA levels (n = 3). Two-tailed t-test to compare rtTA + mCherry + Dox vs. rtTA + Has2 + Dox, p < 0.0001. C Representative picture showing Met1 cells overexpressing Has2 have increased extracellular space revealed by adding mouse red blood cells into the culture before the microscopic imaging. Blue line indicates the cell’s body, red line indicates the boundary of cell’s extracellular matrix. The space between two lines is the extracellular matrix. Scale bar = 50 µm. D Schematic of mouse cross to generate adipose tissue-specific doxycycline-inducible Has2 overexpressing mice (Apn-Has2). E Representative pictures of inguinal adipose tissue slides stained with Alcian blue (Scale Bar = 50 µm). Mice were treated with Dox600 chow diet for 5 days. F Tissue HA concentration after adipose tissue Has2 overexpression induced by Dox600 chow diet treatment for 5 days (n = 5 for control, n = 6 for Apn-Has2 transgenic mice). Two-tailed t-test, p = 0.0019. G Serum HA concentration after adipose tissue Has2 overexpression induced by Dox600 chow diet treatment for 5 days (n = 4). Two-tailed t-test, p = 0.0032. H  Electrophoresis of HA extracted from control and Apn-Has2 mice treated by Dox600 chow diet for 5 days, demonstrating Has2 overexpression mainly increases very high molecular weight HA. I Gene expression in adipose tissue overexpressing Has2 after 5 days of Dox600 chow diet treatment (n = 4 for control, n = 6 for Apn-Has2 mice). Two samples were not detected for Aqp7 gene. Two-tailed t-test for each gene. All data are presented as mean ± s.e.m. **indicates p ≤ 0.01.
Fig. 4
Fig. 4. Adipose tissue Has2 overexpression improves glucose tolerance on HFHS.
A Schematic representation of Apn-Has2 mouse treatment for panels BL. Multiple cohorts of mice were used. B Relative body weights of Apn-Has2 animals on Dox600 HFHS diet (n = 9 mice per each genotype for period 0–6 weeks, n = 6 mice per each genotype for body weight measured at 16 weeks). Two-way ANOVA followed by Sidak’s multiple comparisons test, adjusted p-value > 0.9999, 0.6705, 0.2137, 0.1131, <0.0001 for 0, 2, 4, 6, 16 weeks, respectively. C Fat mass and lean mass of Apn-Has2 mice 7 weeks on Dox600 HFHS diet (n = 9 mice per each genotype). Two-tailed t-test. D RER and heat production of Apn-Has2 mice measured in metabolic cages. Cage temperature was reduced from 23 degree to 6 degree in the middle of the third night. Heat production in control and Apn-Has2 mice after temperature change was analyzed using two-way ANOVA. (n = 8 mice per each genotype). Two-way ANOVA test for time points after ramping to 6 °C (time points 66-75), p = 0.0008 for genotype factor, p = 0.0084 for time factor. E Glucose tolerance in Apn-Has2 mice. (n = 10 mice for control, n = 8 mice for Apn-Has2). Two-way ANOVA followed by Sidak’s multiple comparisons test, adjusted p-value = 0.9994, 0.0174, 0.0014, 0.2834, 0.8711 for 0, 15, 30, 60, and 120 min, respectively. AUC was analyzed by two-tailed t-test, p = 0.0252. F 2-DG uptake in inguinal, epididymal adipose tissues (AT), and gastrocnemius and soleus muscles. (n = 5 mice for control, n = 6 mice for Apn-Has2). Two-tailed t-test, p = 0.0099, 0.0899, 0.7387, 0.3488, for inguinal, epididymal adipose tissues (AT), and gastrocnemius and soleus muscles, respectively. G Insulin-stimulated 2-DG uptake in differentiated adipocytes derived from SVF isolated from apn-Has2 transgenic mice (n = 3 wells). Two-way ANOVA test, p < 0.0001 for treatment factor, p = 0.016 for genotype factor. Ctrl vs. Apn-Has2, p = 0.9995 (no insulin) and 0.0054 (10 nM insulin) for post-hoc Sidak’s multiple comparisons test. H Insulin tolerance in Apn-Has2 mice (n = 3 mice for control, n = 4 mice for Apn-Has2). Two-way ANOVA test. I Pyruvate tolerance in Apn-Has2 mice (n = 8 mice for control, n = 7 for Apn-Has2). Two-way ANOVA test. J Representative histology of inguinal adipose tissue (upper panels) and liver (lower panels) from Apn-Has2 mice after 16 weeks Dox600 HFHS diet treatment. Scale bar = 100 µm. K Quantification of liver triglyceride from Apn-Has2 mice under fast or fed conditions after 16 weeks Dox600 HFHS diet treatment. (Under fasting condition: n = 11 mice for control, n = 5 mice for Apn-Has2; under fed condition: n = 5 mice for control, n = 6 mice for Apn-Has2). Two-tailed t-test, p = 0.0286, and 0.0481 for fast and fed conditions, respectively. L Fasting insulin, fasting glucose, and HOMA-IR of Apn-Has2 mice after 16 weeks Dox600 HFHS diet treatment. (n = 6 mice per genotype). Two-tailed t-test, p < 0.0001, =0.3828, and 0.0003 for fasting serum insulin, fasting glucose, and HOMA-IR, respectively. All data are presented as mean ± s.e.m. *indicates p ≤ 0.05, **indicates p ≤ 0.01.
Fig. 5
Fig. 5. Effects of HA i.p. injections on glucose metabolism.
A Schematic representation of mouse treatment for panels BD. B Serum HA levels after an HA i.p. injection (n = 6 mice per group). Two-way ANOVA followed by Sidak’s multiple comparisons test, adjusted p-value = 0.8642, <0.0001, <0.0001 for -4 h, 0, and 15 min, respectively. C Oral glucose tolerance test 4 h after an HA i.p. injection (n = 12 mice per group). D Serum insulin levels assayed at times indicated by blue arrows in panel A (n = 12 mice per group). E Schematic representation of mouse treatment for panels FI. Two cohorts of mice were used. F Repeated HA treatment effects on oral glucose tolerance (n = 8 mice per group). Two-way ANOVA followed by Sidak’s multiple comparisons test, adjusted p-value = 0.9546, 0.9700, 0.0467, 0.4970, 0.9873 for 0, 15, 30, 60, and 120 min, respectively. G Serum insulin levels after an oral glucose challenge (n = 4 mice for PBS, n = 6 mice for HA treatment). H Repeated HA treatment effects on pyruvate tolerance test (n = 8 mice for PBS, n = 9 mice for HA treatment). I Repeated HA treatment effects on insulin sensitivity. Glucose levels are plotted as the percentage of Time 0 (n = 8 mice). Two-way ANOVA followed by Sidak’s multiple comparisons test, adjusted p-value = 1, 0.2196, 0.3748, 0.0375, 0.6450 for 0, 15, 30, 60, and 120 min, respectively. All data are presented as mean ± s.e.m. *indicates p ≤ 0.05, **indicates p ≤ 0.01. Two-way ANOVA (C) (D) (G) (H).
Fig. 6
Fig. 6. Hepatic Has2 overexpression has no effect on glucose tolerance.
A Schematic representation of Liv-Has2 mouse treatment for panels BH. Multiple cohorts of mice were used. B Has2 gene expression in Liv-Has2 livers on Dox10 HFHS diet for 3 days (n = 6 mice). Two-tailed t-test, p = 0.0013. C Serum HA for Liv-Has2 mice on Dox10 HFHS diet for 5 days (n = 8 mice). Two-tailed t-test, p = 0.009. D RER and calculated heat production in Liv-Has2 mice during 5-day of Dox10 HFHS diet feeding starting on the day 0 of metabolic cage study (n = 12 mice). E Body weight of Liv-Has2 mice before and after Dox10 HFHS diet for 8 weeks (n = 6 mice for control, n = 7 mice for Liv-Has2). F Glucose tolerance test of Liv-Has2 mice after 8 weeks of Dox10 HFHS treatment (n = 6 mice for control, n = 7 mice for Liv-Has2). G Serum lipids levels of Liv-Has2 mice after 8 weeks of Dox10 HFHS treatment (n = 13 mice for control, n = 10 mice for Liv-Has2). H Serum AST and ALT levels of Liv-Has2 mice after 8 weeks of Dox10 HFHS treatment. (n = 13 mice for control, n = 10 mice for Liv-Has2). All data are presented as mean ± s.e.m. **indicates p ≤ 0.01. Two-tailed t-test (G) (H); two-way ANOVA (D) (E) (F).
Fig. 7
Fig. 7. Cellular Has2 overexpression primes cells for lipolysis.
A Schematic representation of Apn-Has2 mouse treatment for panels BH. Multiple cohorts of mice were used; CL: CL 316,243. B Intralipid tolerance test for Apn-Has2 mice (n = 6 mice per genotype). Two-way ANOVA followed by Sidak’s multiple comparisons test, adjusted p-value = 0.7001, 0.0002, 0.9997, 1 for 0, 1.5, 3, and 6 h, respectively. C Glycerol release after β3 adrenergic receptor agonist CL 316,243 treatment (n = 5 mice per group). Two-way ANOVA followed by Sidak’s multiple comparisons test, adjusted p-value = 0.9869, 0.0439, 0.0813, 0.3049 for 0, 15, 30, and 60 min, respectively. D Glycerol release from in vitro differentiated adipocytes treated with HMW HA (10 µg/mL, 5 h) before and with CL 316,243 (1 µM) stimulation for 2 h (n = 4 mice per group). Two-way ANOVA followed by Sidak’s multiple comparisons test, adjusted p-value = 0.9749, 0.0125 for Vehicle vs. HA treatment before CL and after CL, respectively. E Tissue glycerol levels in Apn-Has2 mice (n = 16 mice for control, n = 11 mice for Apn-Has2). Two-tailed t-test, p = 0.0187, <0.0001 for Subcutaneous and Epididymal depot, respectively. F Serum glycerol of Apn-Has2 mice after overnight fasting (n = 5 mice for control, n = 3 mice for Apn-Has2). Two-tailed t-test, p = 0.0266. G Expression of lipolysis related genes in inguinal adipose tissue from mice treated with 5 days of Dox600 chow diet (n = 8 mice for control, n = 12 mice for Apn-Has2). Multiple two-tailed t-test, p = 0.0053, 0.0024, 0.00003, 0.00008, 0.014, 0.002 for Adrb1, Adrb2, Adrb3, Pde3b, Pnpla2, Lipe, respectively. H Western blot of HSL protein. Tissue lysates were prepared from the white adipose tissue dissected from mice treated with 9 weeks of Dox600 HFHS diet. HSL and Tubulin were blotted on two membranes in parallel. Densitometry result of HSL signal normalized to α-Tubulin is shown on the right (n = 3 mice per genotype). Two-tailed t-test, p = 0.10. All data are presented as mean ± s.e.m. *indicates p ≤ 0.05, **indicates p ≤ 0.01.

References

    1. Theocharis AD, Skandalis SS, Gialeli C, Karamanos NK. Extracellular matrix structure. Adv. Drug Deliv. Rev. 2016;97:4–27. doi: 10.1016/j.addr.2015.11.001. - DOI - PubMed
    1. Bonnans C, Chou J, Werb Z. Remodelling the extracellular matrix in development and disease. Nat. Rev. Mol. Cell Biol. 2014;15:786–801. doi: 10.1038/nrm3904. - DOI - PMC - PubMed
    1. Zhu Y, Crewe C, Scherer PE. Hyaluronan in adipose tissue: Beyond dermal filler and therapeutic carrier. Sci. Transl. Med. 2016;8:323ps324. doi: 10.1126/scitranslmed.aad6793. - DOI - PMC - PubMed
    1. Zhu, Y., Kruglikov, I. L., Akgul, Y., Scherer, P. E. Hyaluronan in adipogenesis, adipose tissue physiology and systemic metabolism. Matrix Biol. 78–79, 284–291 (2018). - PMC - PubMed
    1. Spicer AP, et al. Chromosomal localization of the human and mouse hyaluronan synthase genes. Genomics. 1997;41:493–497. doi: 10.1006/geno.1997.4696. - DOI - PubMed

Publication types

MeSH terms

Substances

LinkOut - more resources