. 2021 Aug 10;12(1):4797.
doi: 10.1038/s41467-021-24917-9.

The developing mouse coronal suture at single-cell resolution

Affiliations

The developing mouse coronal suture at single-cell resolution

D'Juan T Farmer et al. Nat Commun. .

Abstract

Sutures separate the flat bones of the skull and enable coordinated growth of the brain and overlying cranium. The coronal suture is most commonly fused in monogenic craniosynostosis, yet the unique aspects of its development remain incompletely understood. To uncover the cellular diversity within the murine embryonic coronal suture, we generated single-cell transcriptomes and performed extensive expression validation. We find distinct pre-osteoblast signatures between the bone fronts and periosteum, a ligament-like population above the suture that persists into adulthood, and a chondrogenic-like population in the dura mater underlying the suture. Lineage tracing reveals an embryonic Six2+ osteoprogenitor population that contributes to the postnatal suture mesenchyme, with these progenitors being preferentially affected in a Twist1+/-; Tcf12+/- mouse model of Saethre-Chotzen Syndrome. This single-cell atlas provides a resource for understanding the development of the coronal suture and the mechanisms for its loss in craniosynostosis.


Conflict of interest statement

The authors declare no competing interests.

Figures

Fig. 1
Fig. 1. Single-cell RNA-sequencing analysis of the E15.5 and E17.5 coronal suture.
a Schematic of dissection strategy for E15.5 and E17.5 coronal sutures. Yellow dashed lines outline dissected regions. b Uniform Manifold Approximation and Projection (UMAP) plot of integrated E15.5 (8279 cells) and E17.5 (8682 cells) datasets. Osteogenic and mesenchymal cell types outlined by dashed lines. c Dot plot depicting selected markers (determined by adjusted p-value = 0 from the Wilcoxon Rank Sum test using FindAllMarkers in Seurat) enriched for each ancillary cell type outside of the osteogenic and mesenchymal population. d UMAP analysis of reclustered osteogenic and mesenchymal subset outlined in (b) resolves 14 clusters. e The osteogenic and mesenchymal subset separated by developmental stage. f Graphical depiction of the cluster proportions from the osteogenic/mesenchymal subset, plotted as ratio between E15.5 and E17.5 cells within each cluster. g Dot plot showing markers enriched for each cluster within the osteogenic/mesenchymal subset.
Fig. 2
Fig. 2. Diverse meningeal cell types are resolved by scRNA-seq.
a Dot plot depicting selected markers previously associated with the pia mater, the arachnoid, and the dura mater. b Feature plots of genes validated by in situ experiments. cf Combinatorial in situ analysis of coronal sutures for indicated markers at E15.5. Sp7 marks the frontal (F) and parietal (P) bones, except for insets (boxed regions) below. c Crabp2 and Gjb6. Arrow, Crabp2+/Gjb6+; arrowhead, Crabp2+. d Crabp2 and Nppc. Arrow, Crabp2+/Nppc+; arrowhead, Nppc+. e Matn4 and Crabp2. Arrow, Matn4+; arrowhead, Crabp2+. f Matn4 and Nppc. Arrow, Matn4+/Nppc+; arrowhead, Nppc+; double arrows, Matn4+. g Model summarizing gene expression patterns of meningeal layers captured from single-cell analysis. B, Brain. In situs were performed in biological triplicate. Scale bar = 50 µm; the upper panels in (cf) are at the same magnification.
Fig. 3
Fig. 3. Multiple ectocranial layers overlay the coronal suture.
a Feature plots of genes validated by in situ experiments. be Combinatorial in situ analysis of coronal sutures for indicated markers at E15.5. Sp7 marks the frontal (F) and parietal (P) bones. b Ly6a and Pi16. c Ly6a and Dpt. Arrow, Dpt+; arrowhead, Ly6a+/Dpt+. d Pi16 and C1qtnf3. Arrows, C1qtnf3+ layers; Arrowhead, Pi16+ layer. e Tnmd and C1qtnf3. Arrow, C1qtnf3+; arrowhead, Tnmd+/C1qtnf3+. Asterisk, Tnmd expression in MG1. f Model summarizing gene expression patterns of ectocranial layers captured from single-cell analysis. In situs were performed in biological triplicate. Scale bars = 50 µm; images in (be) are at the same magnification.
Fig. 4
Fig. 4. Ligament-like mesenchyme above the coronal suture.
a Feature plots of genes validated by in situ experiments. bd Combinatorial in situ analysis of coronal sutures for indicated markers at E15.5. Sp7 marks the frontal (F) and parietal (P) bones. Arrowheads denote the ligament-like population, and the asterisk suture mesenchyme weakly labeled by Scx. eg At the indicated postnatal stages, Scx-GFP labels a ligament (arrowheads) in a similar position to the embryonic ligament-like population (n = 2 per stage). Nuclei are labeled by DAPI. h Model summarizing location of the LIG layer. cs = coronal suture. In situs were performed in biological triplicate. Scale bars = 50 µm; images (b, c) are at the same magnification, as are (eg).
Fig. 5
Fig. 5. scRNA-seq captures various subtypes of osteoblasts at the coronal suture.
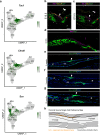
a Lineage analysis and (b) pseudotime analysis of the osteoblast subset using Monocle 3. The gray lines in (a) indicate the lineage relationship between cells in the trajectory. In (b) cells further along the single-cell trajectory are indicated by progressively lighter colors. c Feature plot of selected markers within the osteogenic subset. d Expression plots of selected genes across pseudotime. e, j Feature plots of genes validated by in situ experiments. fi, k Combinatorial in situ analysis of coronal sutures for indicated markers at E15.5. Sp7 marks the frontal (F) and parietal (P) bones. f Ifitm5 and Sost. Arrows indciate Sp7+ expression in presumptive newly formed osteoblasts, and the arrowhead Sost expression. g Lef1 and Inhba. Arrowheads mark Lef1+/Inhba+ expression near bone tips. h Podnl1 and Mmp13. Arrowheads mark Podnl1+/Mmp13+ expression in periosteum distant from suture. i Erg and Pthlh. Arrowhead marks Erg+/Pthlh+ expression in suture mesenchyme. k Six2 and Erg. Arrowhead marks Six2+/Erg+ expression in suture mesenchyme. l, m Immunostaining for Sp7 and tdTomato in a Six2:Cre;Ai9 coronal suture at E16.5 (n = 3) and DAPI staining of a Six2:Cre;Ai9 coronal suture at 3 weeks (n = 4). Asterisk, labeled cells above the frontal bone. Arrows, coronal suture. Arrowheads, osteocytes. Dashed lines outline bones. n Images of the coronal suture (cs, arrowhead) and adjacent bones from a P7 Six2:CreERT2; R26-CAG-LSL-Sun1-sfGFP-myc mouse treated with tamoxifen at P0 (n = 3). Converted cells display strong nuclear GFP; the diffuse green signal in the bones is autofluorescence. Top views are from above the cranium, with digital cross-sections through the suture shown below. o Model summarizing gene expression patterns within the developing bones and coronal suture mesenchyme. In situs were performed in biological triplicate. Scale bars = 50 µm; images (fi) are at the same magnification.
Fig. 6
Fig. 6. Comparison of frontal and coronal datasets.
a UMAP analysis of osteogenic and mesenchymal cells from integrated E17.5 coronal and E18.5 frontal datasets. b, c Cell clusters separated by suture type and labeled with respective names. d, e Dot plot showing the intersection of cluster markers from the coronal suture datasets (Fig. 1g) and for the frontal suture datasets from Holmes et al., mapped onto to integrated dataset split by suture. Red box labels OG1 markers. fh Violin plots highlight enriched expression of OG1 markers Pthlh, Erg, Net1 in cluster 1 cells from the coronal versus frontal suture.
Fig. 7
Fig. 7. Enrichment and requirements of coronal synostosis genes for osteogenic cells.
a Dot plot of genes associated with coronal suture synostosis. The size and color intensity of the dots correspond respectively to the percentage of cells within each cluster expressing the indicated gene, and the average expression level. b Module score for coronal synostosis genes plotted on to the osteogenic/mesenchymal subset UMAP. ci Combinatorial in situ analysis of coronal sutures for indicated markers at E14.5 or E15.5. Sp7 marks the frontal (F) and parietal (P) bones. c, d Twist1 expression overlaps with markers for PO1 (Cenpf) and OG1 (Erg) within coronal suture mesenchyme of wild-type E15.5 mice. ei, expression of OG1 markers Erg and Six2 is lost in the suture mesenchyme (arrowheads) of Twist1+/−; Tcf12+/− mice, yet EC1-3 marker Pi16 and LIG marker Tac1 are unaffected. In situs were performed in biological triplicate. Scale bars = 50 µm; images in (ci) are at the same magnification.

References

    1. Rice DP. Developmental anatomy of craniofacial sutures. Front. Oral. Biol. 2008;12:1–21. doi: 10.1159/000115028. - DOI - PubMed
    1. Al-Rekabi Z, Cunningham ML, Sniadecki NJ. Cell mechanics of craniosynostosis. ACS Biomater. Sci. Eng. 2017;3:2733–2743. doi: 10.1021/acsbiomaterials.6b00557. - DOI - PMC - PubMed
    1. Lee C, Richtsmeier JT, Kraft RH. A coupled reaction-diffusion-strain model predicts cranial vault formation in development and disease. Biomech. Model Mechanobiol. 2019;18:1197–1211. doi: 10.1007/s10237-019-01139-z. - DOI - PMC - PubMed
    1. Lajeunie E, Le Merrer M, Bonaïti-Pellie C, Marchac D, Renier D. Genetic study of nonsyndromic coronal craniosynostosis. Am. J. Med. Genet. 1995;55:500–504. doi: 10.1002/ajmg.1320550422. - DOI - PubMed
    1. Cornelissen M, et al. Increase of prevalence of craniosynostosis. J. Craniomaxillofac. Surg. 2016;44:1273–1279. doi: 10.1016/j.jcms.2016.07.007. - DOI - PubMed

Publication types

MeSH terms

Substances