. 2021 Aug 10;12(1):4814.
doi: 10.1038/s41467-021-25079-4.

Two parallel pathways connect glutamine metabolism and mTORC1 activity to regulate glutamoptosis

Affiliations

Two parallel pathways connect glutamine metabolism and mTORC1 activity to regulate glutamoptosis

Clément Bodineau et al. Nat Commun. .

Abstract

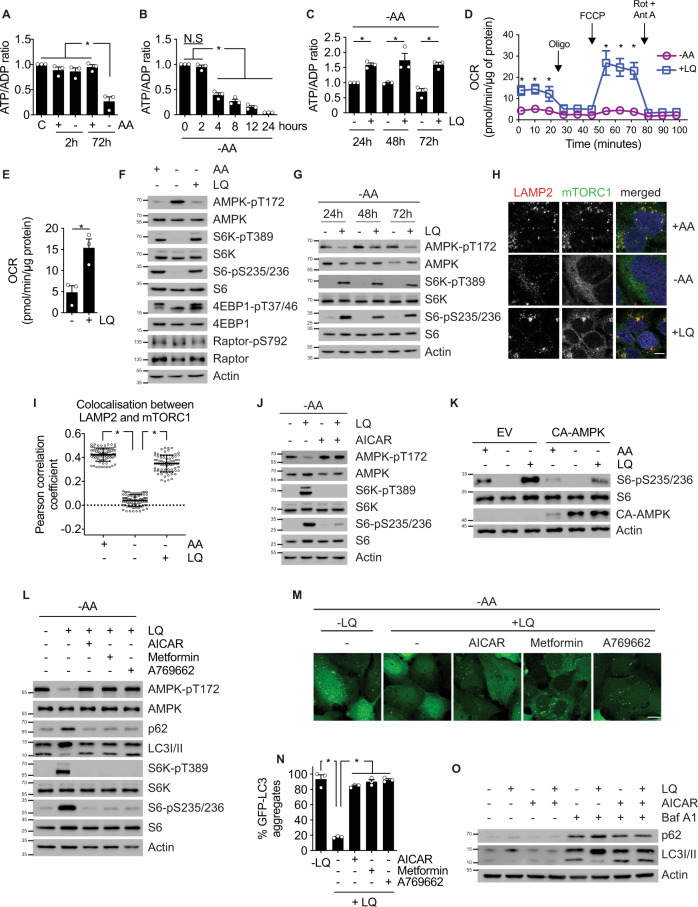
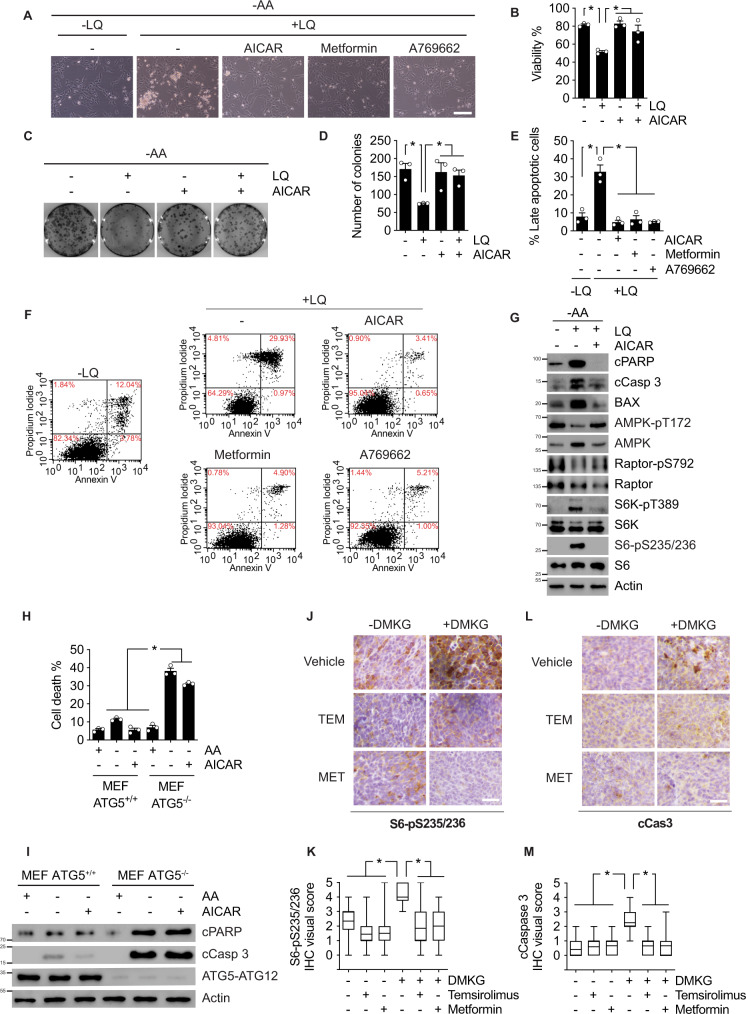
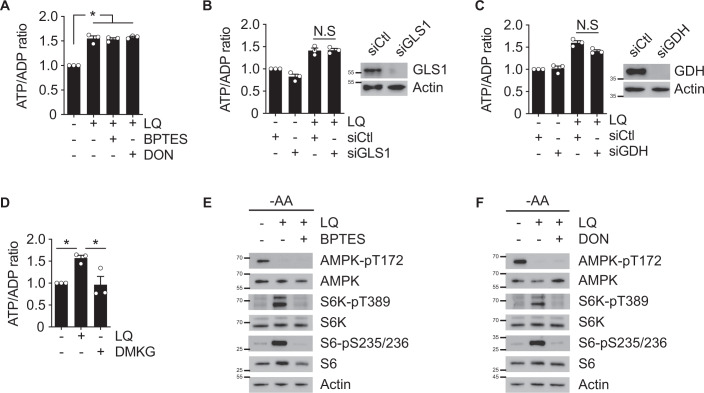
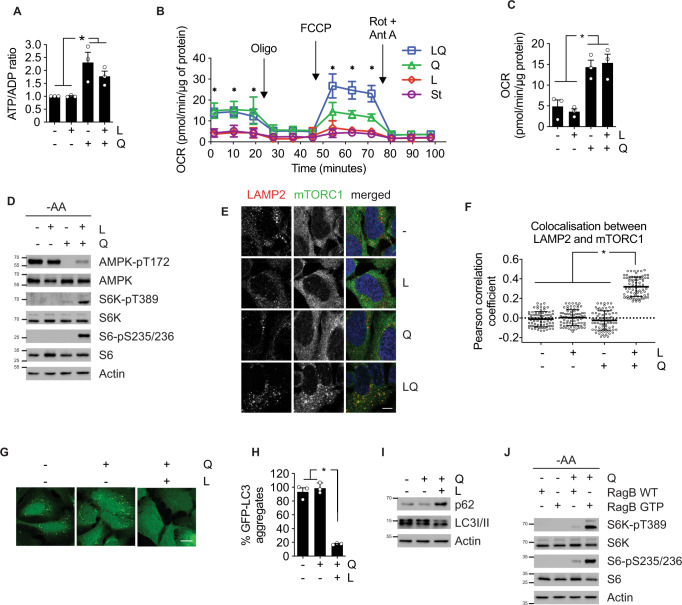
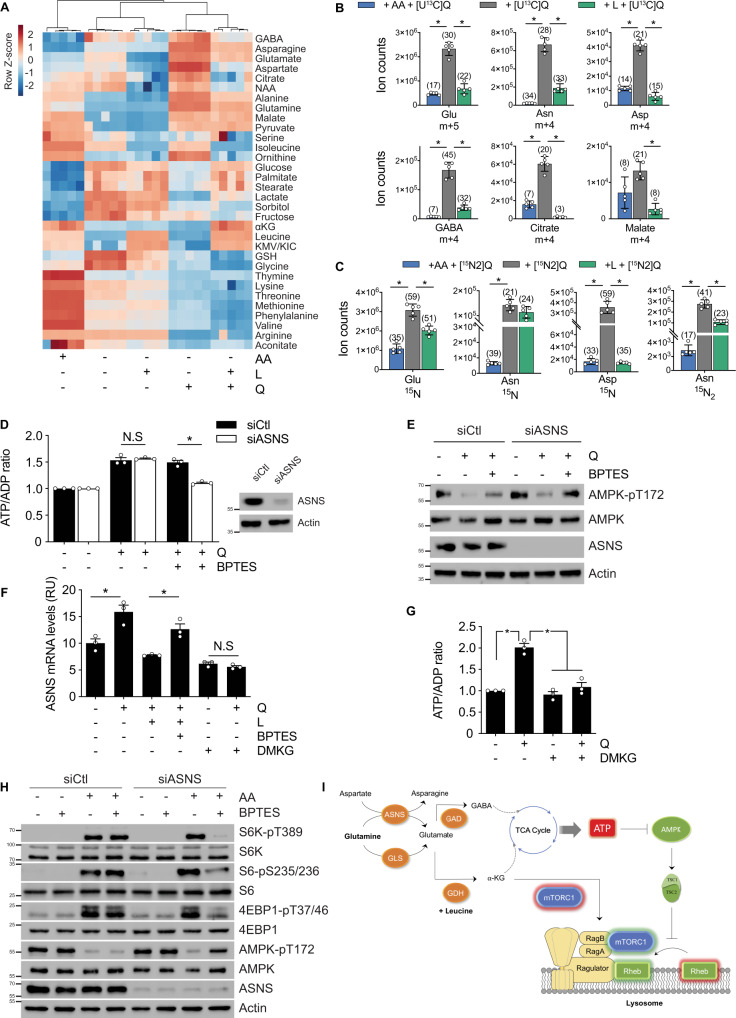
Glutamoptosis is the induction of apoptotic cell death as a consequence of the aberrant activation of glutaminolysis and mTORC1 signaling during nutritional imbalance in proliferating cells. The role of the bioenergetic sensor AMPK during glutamoptosis is not defined yet. Here, we show that AMPK reactivation blocks both the glutamine-dependent activation of mTORC1 and glutamoptosis in vitro and in vivo. We also show that glutamine is used for asparagine synthesis and the GABA shunt to produce ATP and to inhibit AMPK, independently of glutaminolysis. Overall, our results indicate that glutamine metabolism is connected with mTORC1 activation through two parallel pathways: an acute alpha-ketoglutarate-dependent pathway; and a secondary ATP/AMPK-dependent pathway. This dual metabolic connection between glutamine and mTORC1 must be considered for the future design of therapeutic strategies to prevent cell growth in diseases such as cancer.


Conflict of interest statement

The authors declare no competing interests.

Figures

Fig. 1
Fig. 1. Glutaminolysis sustains the production of ATP to inhibit AMPK and to activate mTORC1.
A ATP/ADP ratio of U2OS cells incubated in the presence or the absence of all amino acids for 2 or 72 h. Fed cells (C) are used as control. B ATP/ADP ratio of U2OS cells incubated in absence of amino acid for the indicated time. C ATP/ADP ratio of amino acid-starved U2OS cells incubated in the presence or absence of LQ during the indicated times. D OCR analysis by Seahorse® technology of amino acid-starved U2OS cells incubated in the presence (blue) or absence (purple) of LQ during 72 h. OCR was measured either in basal conditions or after the injection of oligomycin, FCCP, and rotenone/antimycin A. Data are mean ± SEM of three biologically independent experiments performed with five replicates. E Basal respiration used to drive ATP production as determined by OCR quantification of data obtained in (D). F Immunoblot of mTORC1 activity markers (S6K, S6, and 4EBP1 phosphorylation) and AMPK phosphorylation of U2OS cells incubated with or without amino acids, in the presence or absence of LQ during 72 h. G Immunoblot of mTORC1 activity markers (S6K and S6 phosphorylation) and AMPK phosphorylation of amino acid-starved U2OS cells incubated in the presence or absence of LQ during 24, 48, or 72 h. H Immunofluorescence microscopy captions of U2OS cells incubated with or without amino acids, in the presence or absence of LQ during 72 h. Cells were stained against LAMP2 (lysosomal marker, red), mTORC1 (green) and DAPI (blue). Scale bar represents 10 µm. I Quantification of the colocalization between LAMP2 and mTORC1 as shown in (H). Person’s R value was evaluated using ImageJ coloc2 plugin on 25 ROI in three biologically independent experiments (75 ROI in total per condition). J Immunoblot of mTORC1 activity markers (S6K and S6 phosphorylation) and AMPK phosphorylation of amino acid-starved U2OS cells incubated in the presence or absence of LQ, with or without AICAR, during 72 h. K Immunoblot analysis of mTORC1 activity marker (S6 phosphorylation) of U2OS cells expressing a myc-tagged, constitutively active AMPK mutant in the presence or absence of amino acids and LQ as indicated. L Immunoblot of autophagy (p62 and LC3-I/II) and mTORC1 (S6K and S6 phosphorylation) markers of amino acid-starved U2OS cells incubated in absence or presence of LQ, AICAR, metformin or A769662 for 72 h, as indicated. M Fluorescence microscopy captions of GFP-LC3 expressing amino acid-starved U2OS cells incubated in the presence or absence of LQ, with or without AICAR, metformin or A769662 for 72 h. Autophagosome formation upon GFP-LC3 aggregation was assayed using confocal microscopy. The scale bar represents 10 µm. N Quantification of the number of GFP-LC3 dots per cell of captions obtained in (M). >100 cells were counted per experiment. O Immunoblot analysis of autophagy markers (p62 and LC3I/II) of U2OS cells treated with LQ, AICAR and/or Bafilomycin A1 as indicated for 72 h. Graphs show mean values ± SEM (n = 3 biologically independent experiments). *p < 0.05 (ANOVA analysis followed by a post hoc Bonferroni test). Source data are provided as a Source Data file.
Fig. 2
Fig. 2. AMPK inhibition is necessary for glutamoptosis both in vitro and in vivo.
A Representative microscopy images of amino acid-starved U2OS cells incubated in absence or presence of LQ, AICAR, metformin, or A769662 for 72 h, as indicated. Scale bar represents 100 µm. B Cell viability as estimated by a trypan blue exclusion assay of amino acid-starved U2OS cells incubated in the presence or absence of LQ and AICAR during 72 h. C Representative images of clonogenic assay of U2OS cells treated as in (B). D Colony quantification of images obtained in (C). E Quantification of late apoptosis population of three biologically independent experiments (double positive, annexin V and PI) as obtained in (F) for the indicated condition. F Flow cytometry analysis of annexin V/PI staining of amino acid-starved U2OS cells incubated with or without LQ in combination with AICAR, metformin, or A769662 during 72 h. G Immunoblot of the pro-apoptotic markers (BAX, cleaved caspase 3, and cleaved PARP), mTORC1 activity markers (Raptor, S6K, and S6 phosphorylation), and AMPK phosphorylation of amino acid-starved U2OS cells incubated in the presence or absence of LQ, with or without AICAR, during 72 h. H Cell viability as estimated by a trypan blue exclusion assay of ATG5+/+ and ATG5−/− MEFs incubated in the presence or absence of amino acids (AA) and AICAR during 72 h. I Immunoblot analysis of pro-apoptotic markers of ATG5+/+ and ATG5−/− MEFs incubated as in (H). JL Representative immunohistochemistry microscopy pictures (×40 magnification) of xenograft tumors of mice treated as indicated (TEM: Temsirolimus; MET: Metformin). Samples were stained against S6-pS235/236 (J) and cleaved caspase 3 (L). Scale bars represent 100 µm. KM IHC visual score of S6-pS235/236 (K) and caspase 3 (M) of images from (J) and (L), respectively. The upper and lower limits of the boxes represent quartiles, with the line within the boxes indicating the median and the whiskers showing the extremes (n ≥ 10 images per treatment). Graphs show mean values ± SEM (n = 3 biologically independent experiments). *p < 0.05 (ANOVA analysis followed by a post hoc Bonferroni test). Source data are provided as a Source Data file.
Fig. 3
Fig. 3. Glutamine is sufficient to sustain ATP levels, but not to activate mTORC1.
A ATP/ADP ratio of amino acid-starved U2OS cells incubated in the presence or absence of LQ with or without BPTES or DON during 72 h. B, C GLS or GDH expressions were knocked down using small interfering RNA (siRNA) in U2OS cells for 48 h. Cells were then treated with LQ for 72 h and the ATP/ADP ratio was measured. Scramble non-targeting siRNA was used as a control. Immunoblots of GLS or GDH levels are presented as a control of the knockdown. D ATP/ADP ratio of amino acid-starved U2OS cells treated with LQ or DMKG for 72 h. E, F Immunoblot of amino acid-starved U2OS cells treated with or without LQ in combination with BPTES (E) or DON (F) for 72 h. Activity markers of AMPK and mTORC1 were analysed. Graphs show mean values ± SEM (n = 3 biologically independent experiments). *p < 0.05 (ANOVA analysis followed by a post hoc Bonferroni test). Source data are provided as a Source Data file.
Fig. 4
Fig. 4. Glutamine metabolism activates mTORC1 following two parallel, necessary branches.
A ATP/ADP ratio of amino acid-starved U2OS cells incubated with leucine and/or glutamine during 72 h. B OCR analysis by Seahorse® technology of amino acid-starved (purple) U2OS cells incubated with leucine (red) and/or glutamine (Q green, LQ blue) during 72 h. OCR was measured either in basal conditions or after the injection of oligomycin, FCCP, and rotenone/antimycin A. Data are mean ± SEM of three biologically independent experiments performed with five replicates. C Basal respiration used to drive ATP production as determined by OCR quantification of data obtained in (B). D Immunoblot of mTORC1 activity markers (S6K and S6 phosphorylation) and AMPK phosphorylation of amino acid-starved U2OS cells incubated with leucine and/or glutamine during 72 h. E Immunofluorescence microscopy captions of U2OS cells incubated with leucine and/or glutamine during 72 h. Cells were stained against LAMP2 (lysosomal marker, red), mTORC1 (green) and DAPI (blue). Scale bar represents 10 µm. F Quantification of the colocalization between LAMP2 and mTORC1 as shown in (E). Person’s R value was evaluated using ImageJ coloc2 plugin on 25 ROI in three biologically independent experiments (75 ROI in total per condition). G Fluorescence microscopy captions of GFP-LC3 expressing amino acid-starved U2OS cells incubated in the presence of glutamine and/or leucine during 72 h. Autophagosome formation upon GFP-LC3 aggregation was assayed using confocal microscopy. The scale bar represents 10 µm. H Quantification of the number of GFP-LC3 dots per cell of captions obtained in (G). >100 cells were counted per experiment. I Immunoblot of autophagy (p62 and LC3-I/II) markers of amino acid-starved U2OS cells incubated in the presence of glutamine and/or leucine during 72 h. J U2OS cells were transfected with RagB WT plasmid or RagB 54 L plasmid. Amino acid-starved cells were then incubated with or without glutamine for 72 h. Downstream targets of mTORC1 (S6K and S6 phosphorylation) were assessed by immunoblot. Graphs show mean values ± SEM (n = 3 biologically independent experiments). *p < 0.05 (ANOVA analysis followed by a post hoc Bonferroni test). Source data are provided as a Source Data file.
Fig. 5
Fig. 5. ASNS and GABA shunt are alternative pathways to metabolize glutamine.
A Heatmap representation of metabolite levels, as determined by LC–MS analysis, in amino acid-starved U2OS cells incubated with glutamine and/or leucine. The heatmap was created with MetaboAnalyst3.0 with the total pools of the detected metabolites. B 13C-labeled metabolite levels, as determined by LC–MS analysis, in U2OS cells incubated with or without all amino acids or leucine alone as indicated, in the presence of (U)-13C-glutamine during 72 h. Total ion counts of glutamate m + 5, asparagine m + 4, aspartate m + 4, GABA m + 4, citrate m + 4, and malate m + 4 are graphed. The percentage of labeling with respect to total metabolite levels is shown in parenthesis for each metabolite. C 15N-labeled metabolite levels, as determined by LC–MS analysis, in U2OS cells incubated with or without all amino acids or leucine alone as indicated, in the presence of 15N2-glutamine during 72 h. Ion counts of 15N -glutamate, 15N -asparagine, 15N aspartate, and 15N2-asparagine are plotted. The percentage of labeling relative to the total metabolite is shown in parenthesis for each metabolite. D ASNS expression was knocked down using small interfering RNA (siRNA) in U2OS cells during 48 h. Cells were then treated with glutamine and BPTES as indicated for 72 h and the ATP/ADP ratio was measured. Scramble non-targeting siRNA was used as a control. Immunoblot of ASNS levels is presented as a control of the knockdown. E Immunoblot analysis of AMPK phosphorylation in U2OS cells treated as in (D). F Relative mRNA expression levels of ASNS as determined by qPCR in amino acid-starved U2OS cells incubated as indicated during 72 h. G ATP/ADP ratio of amino acid-starved U2OS cells incubated with glutamine and/or DMKG during 72 h. H Immunoblot analysis of mTORC1 downstream target (S6K, S6, and 4EBP1 phosphorylation) and AMPK phosphorylation in U2OS cells incubated during 24 h in the presence of all amino acids with dual inhibition of GLS and/or ASNS. ASNS expression was knocked down using small interfering RNA (siRNA) in U2OS cells during 48 h. Scramble non-targeting siRNA was used as a control. Cells were then incubated in the presence of absence of all amino acids and/or BPTES as indicated during 24 h. I Schematic representation of the two branches model connecting glutamine metabolism and mTORC1 signaling. Graphs show mean values ± SEM (n = 3 biologically independent experiments). *p < 0.05 (ANOVA analysis followed by a post hoc Bonferroni test). Source data are provided as a Source Data file.

References

    1. Stein WH, Moore S. The free amino acids of human blood plasma. J. Biol. Chem. 1954;211:915–926. doi: 10.1016/S0021-9258(18)71179-4. - DOI - PubMed
    1. Deberardinis RJ, Cheng T. Q’s next: The diverse functions of glutamine in metabolism, cell biology and cancer. Oncogene. 2010;29:313–324. doi: 10.1038/onc.2009.358. - DOI - PMC - PubMed
    1. Villar VH, Merhi F, Djavaheri-Mergny M, Durán RV. Glutaminolysis and autophagy in cancer. Autophagy. 2015;11:1198–1208. doi: 10.1080/15548627.2015.1053680. - DOI - PMC - PubMed
    1. Sener A, Malaisse WJ. L-leucine and a nonmetabolized analogue activate pancreatic islet glutamate dehydrogenase. Nature. 1980;288:187–189. doi: 10.1038/288187a0. - DOI - PubMed
    1. Durán RV, et al. Glutaminolysis activates Rag-mTORC1 Signaling. Mol. Cell. 2012;47:349–358. doi: 10.1016/j.molcel.2012.05.043. - DOI - PubMed

Publication types

MeSH terms