. 2021 Aug 10;12(1):4818.
doi: 10.1038/s41467-021-25146-w.

The sugar-responsive enteroendocrine neuropeptide F regulates lipid metabolism through glucagon-like and insulin-like hormones in Drosophila melanogaster

Affiliations

The sugar-responsive enteroendocrine neuropeptide F regulates lipid metabolism through glucagon-like and insulin-like hormones in Drosophila melanogaster

Yuto Yoshinari et al. Nat Commun. .

Abstract

The enteroendocrine cell (EEC)-derived incretins play a pivotal role in regulating the secretion of glucagon and insulins in mammals. Although glucagon-like and insulin-like hormones have been found across animal phyla, incretin-like EEC-derived hormones have not yet been characterised in invertebrates. Here, we show that the midgut-derived hormone, neuropeptide F (NPF), acts as the sugar-responsive, incretin-like hormone in the fruit fly, Drosophila melanogaster. Secreted NPF is received by NPF receptor in the corpora cardiaca and in insulin-producing cells. NPF-NPFR signalling resulted in the suppression of the glucagon-like hormone production and the enhancement of the insulin-like peptide secretion, eventually promoting lipid anabolism. Similar to the loss of incretin function in mammals, loss of midgut NPF led to significant metabolic dysfunction, accompanied by lipodystrophy, hyperphagia, and hypoglycaemia. These results suggest that enteroendocrine hormones regulate sugar-dependent metabolism through glucagon-like and insulin-like hormones not only in mammals but also in insects.


Conflict of interest statement

The authors declare no competing interests.

Figures
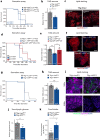
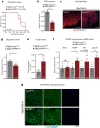
Fig. 1
Fig. 1. NPF from midgut EECs maintains metabolic homoeostasis.
a–i Phenotypes of the midgut EEC-specific NPF knockdown animals (TKg>NPFRNAi) (a-c), NPF genetic mutant animals with or without midgut-specific NPF reintroduction (TKg>NPF; NPFsk1/Df) (df), and adult EEC-specific NPF knockdown animals (TKgts>NPFRNAi) (gi). a, d, g Survival during starvation. b, e, h Relative TAG amount. c, f, i LipidTOX (red or magenta) and DAPI (blue) staining of dissected fat body tissue. Scale bar, 50 µm in c and f, 200 µm (100×) and 50 µm (400×) in i. j Relative circulating glucose levels. k Feeding quantity measurement with CAFÉ assay. For RNAi experiments, LacZ knockdown (TKg>LacZRNAi) was used as the negative control. For all bar graphs, the number of samples assessed (n) is indicated in each graph. Mean ± SEM with all data points is shown. Statistics: Log rank test with Holm’s correction (a, d, and g), two-tailed Student’s t-test (b, h, j, and k), one-way ANOVA followed by Tukey’s multiple comparisons test (e). *p < 0.05, **p < 0.01. p-values: a p < 0.0001 (TKg>LacZRNAi vs. TKg>NPFRNAiTRiP), p < 0.0001 (TKg>LacZRNAi vs. TKg>NPFRNAiKK); b p = 0.0005, d p < 0.0001 (TKg>+; NPFsk1/+ vs. TKg>+; NPFsk1/NPFDf), p < 0.0001 (TKg>+; NPFsk1/ NPFDf vs. TKg>NPF; NPFsk1/NPFDf); e p = 0.0027 (TKg>+; NPFsk1/+ vs. TKg>+; NPFsk1/NPFDf), p = 0.0112 (TKg>+; NPFsk1/ NPFDf vs. TKg>NPF; NPFsk1/NPFDf); g p < 0.0001; h p = 0.0008; j p = 0.0316; k p = 0.0363.
Fig. 2
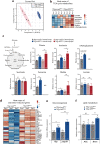
Fig. 2. Midgut-derived NPF regulates systemic carbohydrate/lipid metabolism.
a Principal component analysis plot of metabolome data as in Supplementary Fig. 5. Note that NPF knockdown animals indicate dispersed cluster with control animals. b Heat maps of selected metabolites in whole-body samples. Red and blue indicate increased and decreased metabolites relative to median metabolite levels of TKg>LacZRNAi, respectively; the ratios were plotted on a colour scale (right). c LC–MS/MS measurement of whole-body or haemolymph metabolites in control and TKg>NPFRNAi. ND; no data. The number of samples assessed (n) is indicated in each graph. d Expression heatmap of a curated set of starvation-induced genes. Red and blue indicate increased and decreased gene expressions relative to median gene expression levels of TKg>LacZRNAi, respectively; the ratios were plotted on a colour scale (upper right corner). Gene expression levels are represented by TMM-normalised FPKM. e and f Relative fold change for starvation-induced genes (e: fbp and pepck, f: ACC and Bmm) in dissected abdomens of female adult control and TKg>NPFRNAi animals, as determined by qPCR. Samples are normalised to rp49. The number of samples assessed (n) is indicated in each graph. For RNAi experiments, LacZ knockdown (TKg>LacZRNAi) was used as the negative control. For all bar graphs, mean ± SEM with all data points is shown. Statistics: two-tailed Student’s t-test (c, e, and f). *p < 0.05, **p < 0.01; NS, non-significant (p > 0.05). p-values: c (Citrate) Whole Body (WB), p = 0.0019, Haemolymph (Hm), p = 0.0031, (Isocitrate) WB, p = 0.0048, Hm, p = 0.0436, (α-Ketoglutarate) WB, p = 0.1101, (Succinate) WB, p = 0.2639, Hm, p = 0.7650, (Fumarate) WB, p = 0.0023 (Malate) WB, p = 0.0403, Hm, p = 0.2410, (Lactate) WB, p = 0.6794, Hm, p = 0.6588; e p = 0.0349 (fbp), p = 0.0022 (pepck1); f p = 0.9753 (ACC), p = 0.0165 (Bmm).
Fig. 3
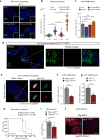
Fig. 3. NPF in midgut EECs is regulated by dietary nutrients.
a Immunostaining for NPF (green/white) and DAPI (blue) in the adult middle midguts collected from 6-day-old control (w1118) animals fully fed, 48 h starved animals, and animals re-fed with sucrose or Bacto peptone following 24 h starvation (sucrose-refed/peptone-refed). Scale bar, 50 µm. b Quantifications of NPF fluorescent intensity under the conditions described for (a). The number of EECs (n) analysed in each genotype is indicated in the graph. Each point represents NPF fluorescent intensity in a single EEC. For each genotype, more than eight guts were used. c RT-qPCR analysis of NPF mRNA level under the conditions described for (a). d Immunofluorescence of sut1KI-T2A-GAL4-driven UAS-GFP (sut1KI-T2A>GFP) in the midgut. The sample was co-stained with anti-NPF antibody (magenta) and DAPI (blue). The GFP signal (green) was detected in NPF+ EECs (arrows). Of note, sut1KI-T2A-GAL4 driven GFP signal were visible in ~40% of NPF+ EECs. Scale bar, 50 µm. e Immunofluorescence of TKg-GAL4-driven UAS-sut1::mVenus (TKg>sut1::mVenus) in the midgut. The sample was co-stained with anti-NPF antibody (white), anti-Prospero antibody (red), and DAPI (blue). Sut1::mVenus (green) is localised on the cell membrane of EECs. Scale bar, (left) 50 µm, (right) 10 µm. f, g RT-qPCR analysis of NPF mRNA level in EEC-specific sut1 knockdown (TKg>sut1RNAi) (f) and sut1 genetic mutant (g) animals. h Survival during starvation of EEC-specific sut1 knockdown animals. i Relative whole-body TAG levels of EEC-specific sut1 knockdown animals. j LipidTOX (red) and DAPI (blue) staining of dissected fat body tissue from EEC-specific sut1 knockdown animals. Scale bar, 50 µm. The number of samples assessed (n) is indicated in each graph. For RNAi experiments, LacZ knockdown (TKg>LacZRNAi) was used as the negative control. For all bar graphs, mean ± SEM with all data points is shown. For dot blots, the three horizontal lines indicate lower, median, and upper quartiles. Statistics: Wilcoxon rank sum test with Holm’s correction (b), one-way ANOVA followed by Tukey’s multiple comparisons test (c), two-tailed Student’s t-test (f, g, and i), Log rank test (h) *p < 0.05, **p < 0.01, ***p < 0.001; NS, non-significant (p > 0.05). p-values: b p < 0.0001 (Fed vs. Starved), p < 0.0001 (Starved vs. Sucrose-refed), p < 0.0001 (Starved vs. Peptone-Refed); c p = 0.0472 (Fed vs. Starved), p = 0.9521 (Fed vs. Sucrose-refed), p = 0.2107 (Fed vs. Peptone-refed); f p < 0.0001; g p = 0.0005; h p < 0.0001; i p = 0.0136.
Fig. 4
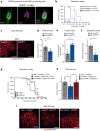
Fig. 4. NPFR in the CC is responsible for lipid metabolism.
a Immunofluorescence of corpora cardiaca (CC) in adult flies expressing UAS-GFP (green) reporter under NPFRKI-T2A-GAL4. Cell bodies of CC are stained by anti-AKH (magenta). Scale bar, 10 µm. Note, AKH-negative GFP+ cells are the enteric neurons producing sNPF. See Supplementary Fig. 11c. b Survival during starvation in flies of control (Akh>LacZRNAi) and Akh>NPFRRNAi. The number of animals assessed (n) is indicated in the graphs. c LipidTOX (red) and DAPI (blue) staining of dissected fat body tissue from indicated genotypes. Scale bar, 50 µm. d Relative whole-body TAG levels. The number of samples assessed (n) is indicated in the graphs. e Feeding amount measurement with CAFÉ assay. The number of samples assessed (n) is indicated in the graphs. Each sample contained four adult female flies. f Relative glycaemic levels in control and Akh>NPFRRNAi. The number of samples assessed (n) is indicated in the graphs. g Survival during starvation in flies of the indicated genotypes. The number of animals assessed (n) is indicated in the graphs. h Relative whole-body TAG levels of indicated genotypes. The number of samples assessed (n) is indicated in the graphs. i LipidTOX (red) and DAPI (blue) staining of dissected fat body tissue from indicated genotypes. Scale bar, 50 µm. For RNAi experiments, LacZ knockdown (Akh>LacZRNAi) was used as negative control. For all bar graphs, mean and SEM with all data points are shown. Statistics: Log rank test with Holm’s correction (b and g), two-tailed Student’s t-test (df), one-way ANOVA followed by Tukey’s multiple comparisons test (h). *p < 0.05, **p < 0.01. p-values: b p < 0.0001 (Akh>LacZRNAi vs. Akh>NPFRRNAiTRiP), p < 0.0001 (Akh>LacZRNAi vs. Akh>NPFRRNAiKK); d p = 0.0039; e p = 0.0024; f, p = 0.0256; g, p < 0.0001 (Akh>+; NPFRsk8/+ vs. +>NPFR; NPFRsk8/NPFRDf), p < 0.0068 (+>NPFR; NPFRsk8/NPFRDf vs. Akh>NPFR; NPFRsk8/NPFRDf); h p = 0.0183 (Akh>+; NPFRsk8/+ vs. +>NPFR; NPFRsk8/NPFRDf), p = 0.0476 (+>NPFR; NPFRsk8/NPFRDf vs. Akh>NPFR; NPFRsk8/NPFRDf).
Fig. 5
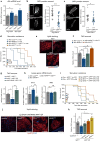
Fig. 5. NPF/NPFR signalling regulates metabolic homoeostasis through Akh/AkhR signalling.
a RT-qPCR analysis of Akh mRNA expression following TKg-GAL4-mediated knockdown of NPF or Akh-GAL4-mediated knockdown of NPFR. The number of samples assessed (n) is indicated in the graphs. b, c Immunostaining and quantification of AKH protein level (white) in adult CC of TKg-GAL4-mediated knockdown of NPF (TKg>NPFRNAi) (b) or Akh-GAL4-mediated knockdown of NPFR (Akh>NPFRRNAi) (c). The number (n) of CCs analysed in each genotype is indicated in the graph. Scale bar, 20 µm. d, i Survival during starvation in flies of each genotype. The number of animals assessed (n) is indicated in the graphs. e, j LipidTOX (red) and DAPI (blue) staining of dissected fat body tissue from indicated genotypes. Scale bar, 50 µm in c, 20 µm in j. f, g, k, Relative whole-body TAG levels of each genotype. The number of animals assessed (n) is indicated in the graphs. h RT-qPCR analysis of Bmm (left) and dHSL (right) mRNA levels in the abdomens dissected from each genotype. The number of samples assessed (n) is indicated in the graphs. For RNAi experiments, LacZ knockdown (TKg>LacZRNAi and Akh>LacZRNAi) was used as negative control. For all bar graphs, mean and SEM with all data points are shown. For dot blots, the three horizontal lines indicate lower, median, and upper quartiles. Statistics: two-tailed Student’s t-test (ac), Log rank test with Holm’s correction (d and i), one-way ANOVA followed by Tukey’s multiple comparisons test (f, g, h, and k). *p < 0.05, **p < 0.01, ***p < 0.001; NS, non-significant (p > 0.05). p-values: a p = 0.0470 (TKg>LacZRNAi vs. TKg>NPFRNAi), p = 0.0142 (Akh>LacZRNAi vs. Akh>NPFRRNAi); b p = 0.0007; c p = 0.0300; d p < 0.0001 (Akh>LacZRNAi vs. Akh>NPFRRNAi), p < 0.0001 (Akh>NPFRRNAi vs. Akh>NPFRRNAi+AkhRNAi), p < 0.0001 (Akh>LacZRNAi vs. Akh>AkhRNAi, Akh>NPFRRNAi vs. Akh>AkhRNAi, Akh>NPFRRNAi+AkhRNAi vs. Akh>AkhRNAi); f p = 0.0028 (Akh>LacZRNAi vs. Akh>NPFRRNAi), p = 0.0108 (Akh>NPFRRNAi vs. Akh>NPFRRNAi+AkhRNAi), p = 0.0155 (Akh>LacZRNAi vs. Akh>AkhRNAi), p < 0.0001 (Akh>NPFRRNAi vs. Akh>AkhRNAi), p = 0.0294 (Akh>NPFRRNAi+AkhRNAi vs. Akh>AkhRNAi); g p = 0.0208 (AkhR1/+; NPFsk1/+ vs. AkhR1/+; NPFsk1/NPFDf), p = 0.0007 (AkhR1/+; NPFsk1/NPFDf vs. AkhR1/ AkhR1; NPFsk1/NPFDf); h Bmm, p = 0.0218 (Akh>LacZRNAi vs. Akh>NPFRRNAi), p = 0.0005 (Akh>NPFRRNAi vs. Akh>NPFRRNAi+AkhRNAi), dHSL, p = 0.7966 (Akh>LacZRNAi vs. Akh>NPFRRNAi), p = 0.8188 (Akh>NPFRRNAi vs. Akh>NPFRRNAi+AkhRNAi); i p < 0.0001 (Cg>+; NPFsk1/+ vs. Cg>+; NPFsk1/NPFDf), p < 0.0001 (Cg>+; NPFsk1/NPFDf vs. Cg>AkhRRNAi; NPFsk1/NPFDf), p < 0.0001 (Cg>+; NPFsk1/NPFDf vs. Cg>BmmRNAi; NPFsk1/NPFDf), p < 0.0001 (Cg>+; NPFsk1/NPFDf vs. Cg>dHSLRNAi; NPFsk1/NPFDf); k p = 0.0073 (Cg>+; NPFsk1/+ vs. Cg>+; NPFsk1/NPFDf), p = 0.0230 (Cg>+; NPFsk1/ NPFDf vs. Cg>AkhRRNAi; NPFsk1/NPFDf), p = 0.0015 (Cg>+; NPFsk1/ NPFDf vs. Cg>BmmRNAi; NPFsk1/NPFDf), p < 0.0001 (Cg>+; NPFsk1/ NPFDf vs. Cg>dHSLRNAi; NPFsk1/NPFDf).
Fig. 6
Fig. 6. Midgut-derived NPF controls DILPs level.
a, b FOXO (white) immunostaining of the fat body in adult flies of each genotype. Scale bar, 20 µm. Note that FOXO nuclear localisation was induced in TKg>NPFRNAi and Akh>NPFRRNAi. c RT-qPCR analysis of FOXO-target gene mRNA levels in the abdomens dissected from each genotype. The number of samples assessed (n) is indicated in the graphs. d RT-qPCR analysis of Dilps mRNA level following TKg-GAL4 mediated knockdown of NPF. The number of samples assessed (n) is indicated in the graphs. e DILP2, 3, and 5 (white) immunostaining and quantification in the brain of adult flies of TKg-GAL4-mediated NPF RNAi animals. Scale bar, 20 µm. The number of samples assessed (n) is indicated in the graphs. For RNAi experiments, LacZ knockdown (TKg>LacZRNAi and Akh>LacZRNAi) was used as negative control. For all bar graphs, mean and SEM with all data points are shown. For dot blots, the horizontal lines indicate median quartile. Statistics: two-tailed Student’s t-test (ce), Wilcoxon rank sum test (f). *p < 0.05, **p < 0.01, ***p < 0.001; NS, non-significant (p > 0.05). p-values: c (left), p = 0.9604 (InR), p = 0.0437 (4E-BP); c (right), p = 0.0023 (4E-BP); d p = 0.5609 (Dilp2), p = 0.0003 (Dilp3), p = 0.0036 (Dilp5); e p < 0.0001 (DILP2), p < 0.0001 (DILP3), p < 0.0001 (DILP5).
Fig. 7
Fig. 7. NPFR in the insulin-producing cells regulates DILPs level.
a Immunofluorescence of the IPCs in adult flies expressing UAS-GFP (green) reporter under NPFRKI-T2A-GAL4. Cell bodies of IPCs are stained by anti-DILP2 (magenta). Scale bar, 20 µm. b RT-qPCR analysis of Dilps mRNA level following Dilp2-GAL4-mediated knockdown of NPFR. The number of samples assessed (n) is indicated in the graphs. c DILP2, 3, and 5 (white) immunostaining in the brain of adult flies of Dilp2-GAL4-mediated NPFR RNAi animals. Scale bar, 20 µm. The sample number (n) analysed in each genotype is indicated in the graph. d Measurements of circulating DILP2HF abundance. The number of samples assessed (n) is indicated in each graph. e (left) Immunofluorescent staining of IPCs following Dilp2-GAL4-mediated NPFR knockdown, including overexpression of the Ca2+ sensor CaLexA. Fluorescence signals are pseudocoloured; high (Max: 255) to low (Minimum: 0) intensity is displayed as warm (yellow) to cold (blue) colours with a colour scale. IPCs were visualised by immunostaining with anti-DILP2 antibody (magenta). IPCs are marked by white dashed line. Scale bar, 20 µm. (right) Quantification of the CaLexA signal intensity normalised by ad libitum feeding controls. The sample number (n) analysed in each genotype is indicated in the graph. f (left) Immunofluorescence staining in the fat bodies of adults expressing the insulin signalling sensor tGPH (green) following Dilp2-GAL4-mediated NPFR knockdown. Scale bar, 50 µm. (right) Quantification of tGPH levels. The relative tGPH level is defined as membrane tGPH intensity divided by cellular tGPH intensity. Each point represents signal intensity of a single fat body cell. The number (n) analysed in each genotype is indicated in the graph. g Western blotting analysis of phospho-AKT, pan-AKT, and Actin. The expected protein size of non-phosphorylated AKT is 59.92 kDa. The sample number (n) analysed in each genotype is indicated in the graph. Full scan images of blot are represented in the Source Data file. For RNAi experiments, LacZ knockdown (Dilp2>LacZRNAi) was used as negative control. For all bar graphs, mean and SEM with all data points are shown. Statistics: two-tailed Student’s t-test (b, d, and g), Wilcoxon rank sum test with Holm’s correction (c, e, and f). *p < 0.05, **p < 0.01, ***p < 0.001; NS, non-significant (p > 0.05). p-values: b p = 0.0452 (Dilp2), p = 0.0264 (Dilp3), p = 0.0132 (Dilp5); c p = 0.0028 (DILP2), p = 0.0118 (DILP3), p = 0.8783 (DILP5); d p = 0.0012; e p < 0.0001 (Control Fed vs. Control Starved), p = 0.0099 (Control Fed vs. NPFRRNAi Fed), p < 0.0001 (NPFRRNAi Fed vs. NPFRRNAi Starved); f p < 0.0001, g (left) p = 0.0222, (right) p = 0.0067.
Fig. 8
Fig. 8. NPFR in the insulin-producing cells regulates carbohydrate/lipid metabolism.
a Survival during starvation in flies of each genotype. The number of animals assessed (n) is indicated in the graphs. b Relative whole-body TAG levels of each genotype. The number of animals assessed (n) is indicated in the graphs. c LipidTOX (red) and DAPI (blue) staining of dissected fat body tissue from indicated genotypes. Scale bar, 20 µm. d Relative glycaemic levels in control and Dilp2>NPFRRNAi. The number of samples assessed (n) is indicated in the graphs. e Feeding amount measurement of each genotype with CAFÉ assay. n = 4 samples, each point contained four adult female flies. f RT-qPCR analysis of FOXO-target gene mRNA levels in the fat body dissected from each genotype. The number of samples assessed (n) is indicated in the graphs. g FOXO (white) immunostaining of the fat body in adult flies of each genotype. Scale bar, 50 µm. For RNAi experiments, LacZ knockdown (Dilp2>LacZRNAi) was used as negative control. For all bar graphs, mean and SEM with all data points are shown. For dot blots, the three horizontal lines indicate lower, median, and upper quartiles. Statistics: Log rank test (a), two-tailed Student’s t-test (b, df). *p < 0.05, **p < 0.01, ***p < 0.001; NS, non-significant (p > 0.05). p-values: a, p = 0.0100; b p < 0.0001; d p = 0.0417; e p = 0.0269; f p = 0.6468 (Bmm), p = 0.0146 (Thor), p = 0.1098 (InR), p = 0.0024 (pepck1).
Fig. 9
Fig. 9. Midgut-derived NPF regulates AKH and DILPs level in response to dietary sugar.
a A working model illustrating dual pathway coordination of FOXO and FOXO-target genes. (i) The loss of NPF/NPFR signalling in the CC—enhanced AKH/AKHR signalling induces FOXO nuclear localisation and carbohydrate/lipid metabolism—and (ii) the loss of NPF/NPFR signalling in the IPCs—attenuation of insulin signalling induces FOXO nuclear localisation and enhances carbohydrate/lipid metabolism. The balance of AKH/AKHR and insulin signalling is coordinated by gut-derived NPF that responds dietary sugars. b (left) In D. melanogaster, enteroendocrine cells respond to the dietary sugars by secreting a neuropeptide, NPF, which signals via its neuronal receptor NPFR. NPF/NPFR signalling regulates energy consumption through dual neuronal relay which are restriction of glucagon-like, AKH production, and enhancement of insulin-like peptides (DILPs). Subsequent modulation of AKHR and insulin signalling within the fat body/adipose tissue maintains lipid/carbohydrate catabolism; thus, impaired NPF/NPFR signalling leads to depletion of energy stores. (right) The EEC-IPC and the EEC-CC axes in D. melanogaster are similar to the gut EECs-pancreas axis in mammals. Mammalian enteroendocrine hormone, GLP-1 also controls insulin and glucagon levels in response to dietary nutrients.

Similar articles

Cited by

References

    1. Unger RH. Glucagon and the insulin: glucagon ratio in diabetes and other catabolic illnesses. Diabetes. 1971;20:834–838. doi: 10.2337/diab.20.12.834. - DOI - PubMed
    1. Haselton AT, Fridell Y-WC. Adult Drosophila melanogaster as a model for the study of glucose homeostasis. Aging. 2010;2:523–526. doi: 10.18632/aging.100185. - DOI - PMC - PubMed
    1. Ojha A, Ojha U, Mohammed R, Chandrashekar A, Ojha H. Current perspective on the role of insulin and glucagon in the pathogenesis and treatment of type 2 diabetes mellitus. Clin. Pharmacol. Adv. Appl. 2019;11:57–65. - PMC - PubMed
    1. Bansal P, Wang Q. Insulin as a physiological modulator of glucagon secretion. Am. J. Physiol. Metab. 2008;295:E751–E761. - PubMed
    1. Baggio LL, Drucker DJ. Biology of Incretins: GLP-1 and GIP. Gastroenterology. 2007;132:2131–2157. doi: 10.1053/j.gastro.2007.03.054. - DOI - PubMed

Publication types

MeSH terms

LinkOut - more resources