. 2021 Aug 10;11(1):16252.
doi: 10.1038/s41598-021-95320-z.

In vivo multimodal retinal imaging of disease-related pigmentary changes in retinal pigment epithelium

Affiliations

In vivo multimodal retinal imaging of disease-related pigmentary changes in retinal pigment epithelium

Ratheesh K Meleppat et al. Sci Rep. .

Abstract

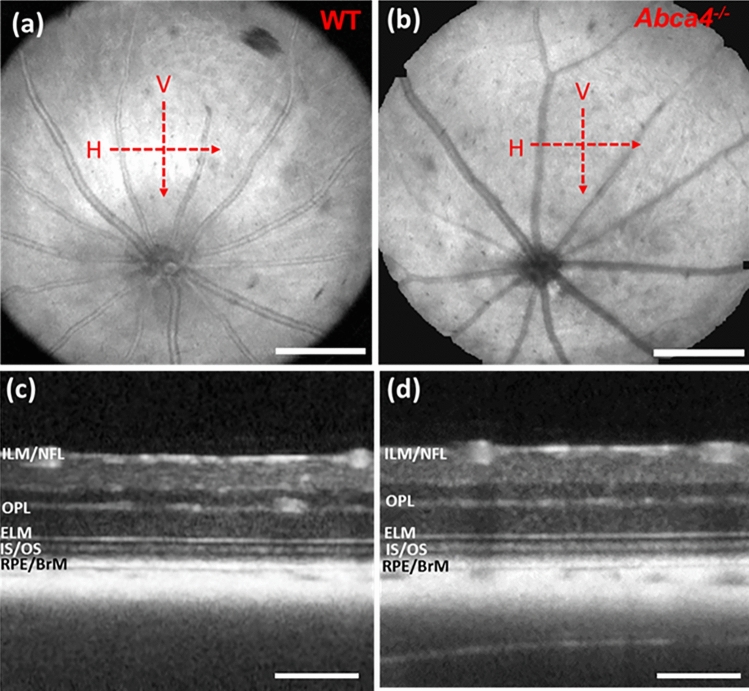
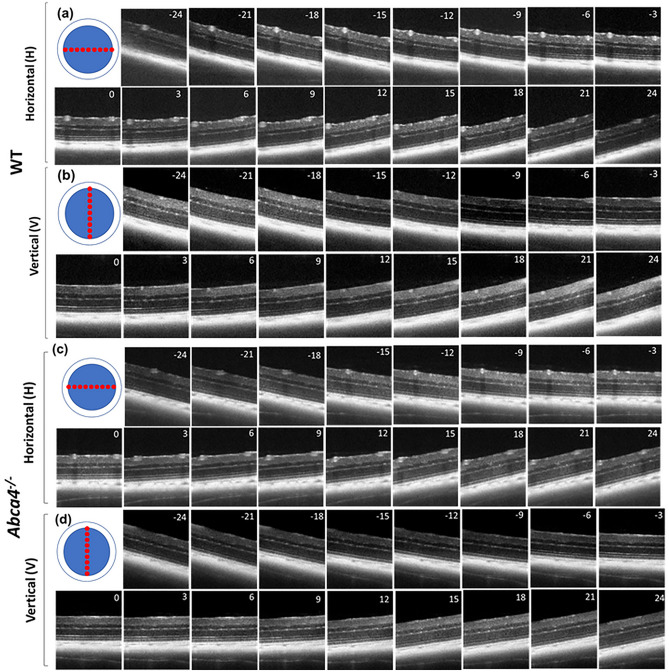
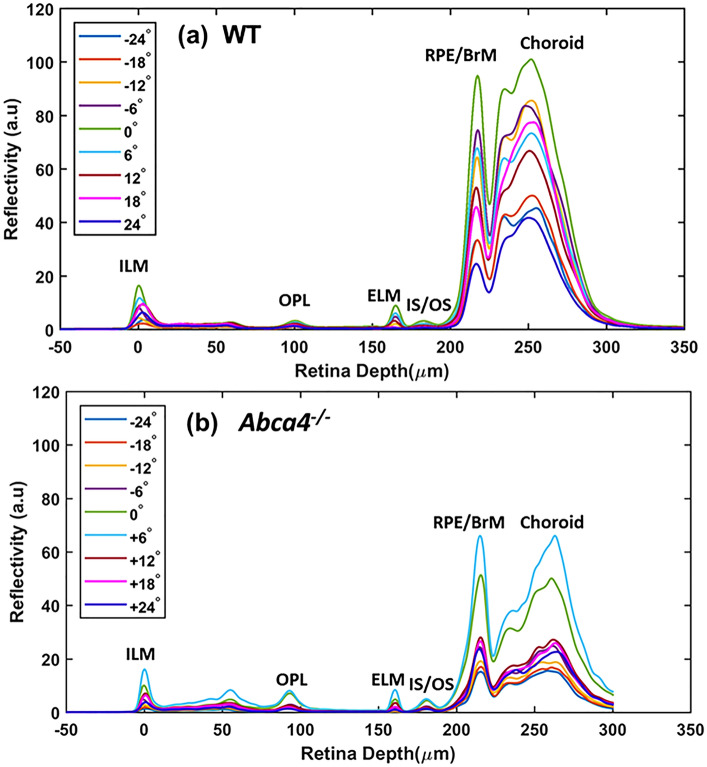
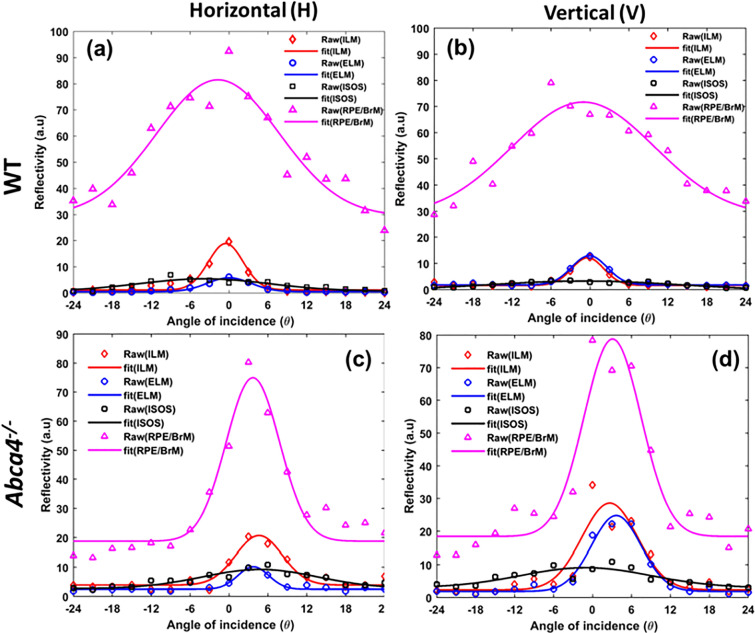
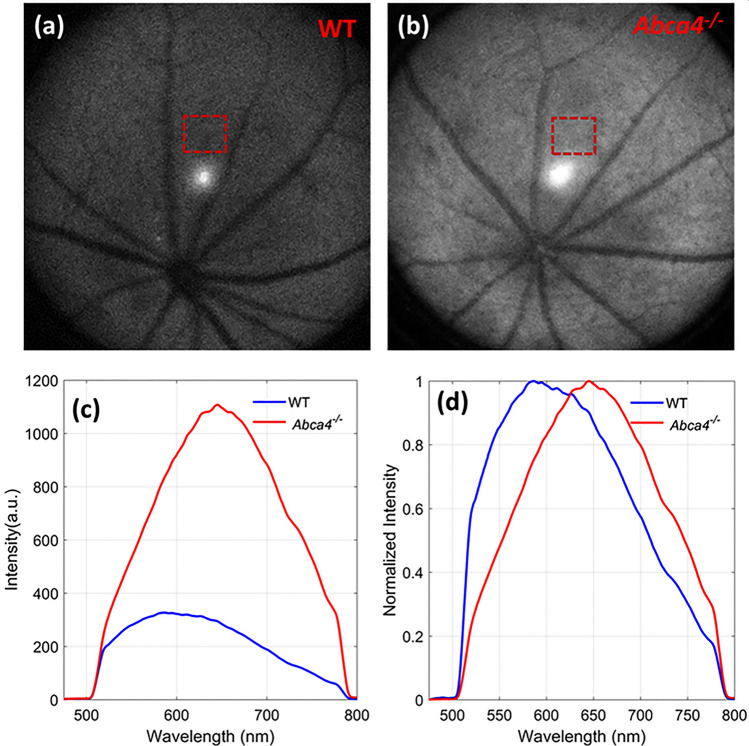
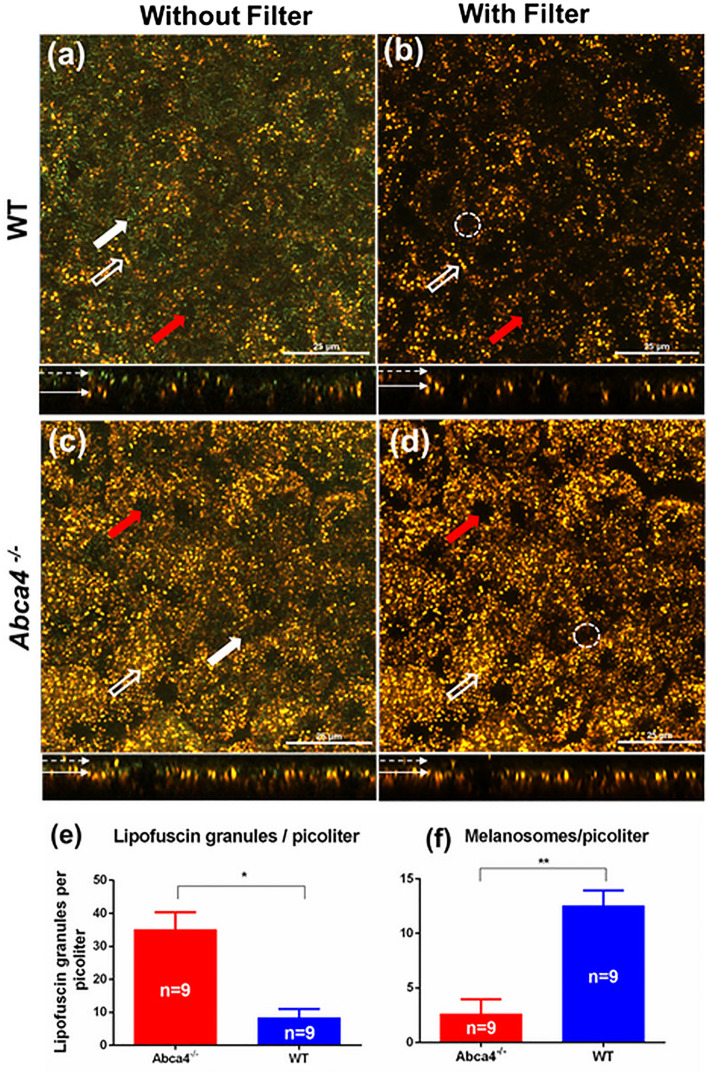
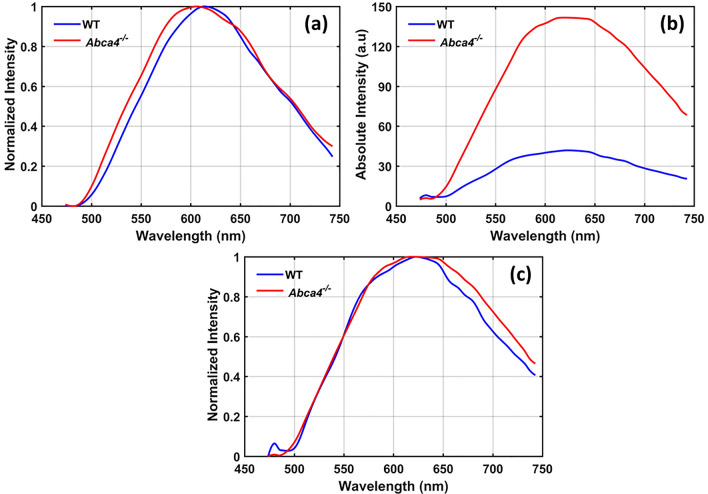
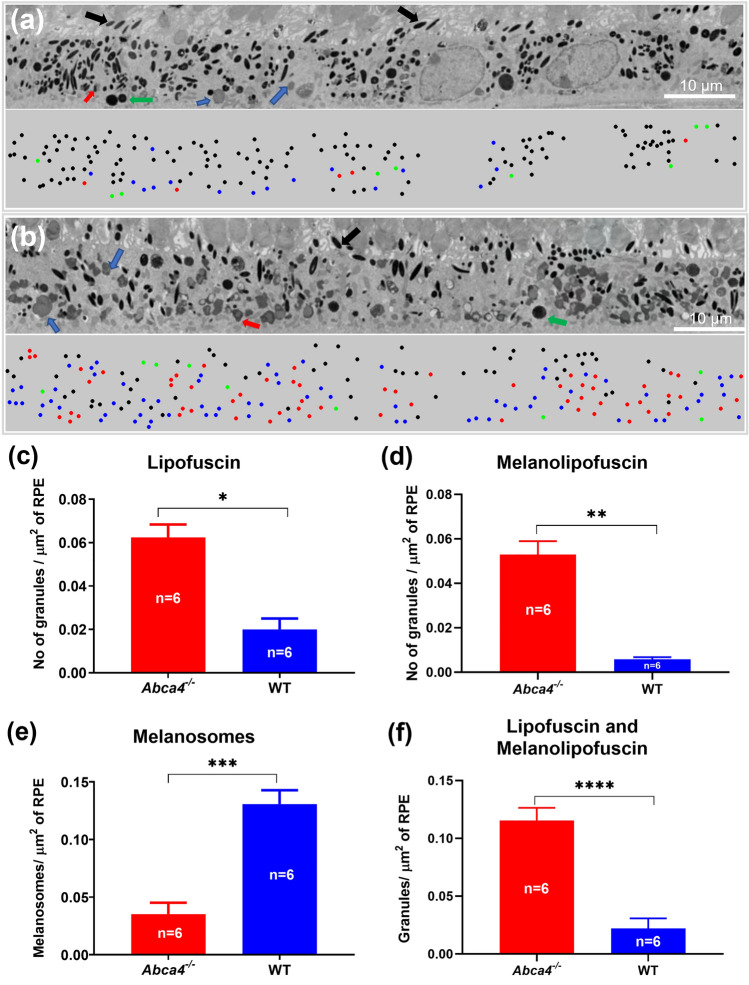
Melanosomes, lipofuscin, and melanolipofuscin are the three principal types of pigmented granules found in retinal pigment epithelium (RPE) cells. Changes in the density of melanosomes and lipofuscin in RPE cells are considered hallmarks of various retinal diseases, including Stargardt disease and age-related macular degeneration (AMD). Herein, we report the potential of an in vivo multimodal imaging technique based on directional back-scattering and short-wavelength fundus autofluorescence (SW-FAF) to study disease-related changes in the density of melanosomes and lipofuscin granules in RPE cells. Changes in the concentration of these granules in Abca4-/- mice (a model of Stargardt disease) relative to age-matched wild-type (WT) controls were investigated. Directional optical coherence tomography (dOCT) was used to assess melanosome density in vivo, whereas the autofluorescence (AF) images and emission spectra acquired with a spectrometer-integrated scanning laser ophthalmoscope (SLO) were used to characterize lipofuscin and melanolipofuscin granules in the same RPE region. Subcellular-resolution ex vivo imaging using confocal fluorescence microscopy and electron microscopy was performed on the same tissue region to visualize and quantify melanosomes, lipofuscin, and melanolipofuscin granules. Comparisons between in vivo and ex vivo results confirmed an increased concentration of lipofuscin granules and decreased concentration of melanosomes in the RPE of Abca4-/- mice, and provided an explanation for the differences in fluorescence and directionality of RPE scattering observed in vivo between the two mouse strains.


Conflict of interest statement

The authors declare no competing interests.

Figures

Figure 1
Figure 1
Representative en face OCT fundus and B-scan images. (a) En face fundus image of a WT mouse. (b) En face fundus image of an Abca4−/− mouse. Red dashed arrows show the location and direction of OCT scanning in horizontal (H) and vertical (V) directions. (c) Averaged B-scan acquired (zero-degree incident angle) from a WT mouse along the H direction. (d) Averaged B-scan acquired (zero-degree incident angle) from an Abca4−/− mouse along the H direction. Scale bar (a,b): 400 μm; scale bar (c,d): 200 μm.
Figure 2
Figure 2
Averaged representative directional OCT B-scans (log scale) acquired from a WT and an Abca4−/− mouse. (a) B-scans from a WT mouse corresponding to 17 beam entry positions along the H direction. (b) B-scans from a WT mouse corresponding to 17 beam entry positions along the V direction. (c) B-scans from an Abca4−/− mouse corresponding to 17 beam entry positions along the H direction. (d) B-scans from an Abca4−/− mouse corresponding to 17 beam entry positions along the V direction. The number provided in each B-scan represents the incidence angle of retinal illumination.
Figure 3
Figure 3
Representative average A-scans (linear scale) obtained for different angles of incidence from WT and Abca4−/− mice. (a) Average A-scans obtained along the H direction from a WT mouse. (b) Average A-scans obtained along the H direction from an Abca4−/− mouse.
Figure 4
Figure 4
Representative Gaussian fits to the dOCT based layer-specific and incident angle-dependent reflectivity profiles for WT (a,b) and Abca4−/− mice (c,d). (a,c) reflectance of different retina layers as a function of angle of incidence measured along the H direction. (b,d) reflectance of different retina layers as a function of angle of incidence measured along the V direction.
Figure 5
Figure 5
In vivo FAF images and emission spectra acquired with 488 nm excitation. Representative FAF images from (a) a WT and (b) an Abca4−/− mouse. (c) Absolute emission spectra measured from a WT control and an Abca4−/− mouse. (d) Normalized emission spectra from (c). Dashed red rectangles in (a,b) show the locations where AF spectra were measured. The sharp decline in fluorescence in (c,d) at about 510 nm and 780 nm are due to dichroic cutoff filter.
Figure 6
Figure 6
Confocal images of flat-mounted RPE from WT and Abca4−/−mice. (a,c) Confocal images of the RPE cell mosaic acquired without emission filter. (b,d) Confocal images of RPE cell mosaic acquired with emission filter. (e,f) bar graphs showing the density of lipofuscin and melanosomes as number of granules per picoliter. The average number of lipofuscin granules and melanosomes were calculated from 9 confocal volumes per strain. White solid arrows on top panels indicate representative melanosomes, whereas the hollow arrows indicate representative lipofuscin granules. The red arrows indicate representative nuclei. White dashed-circles in (b,d) indicate the absesnce of melanosomes in the same region indicated by thick white arrows in (a,c). The melanosomes are not visible in (b,d) because the scattered light from the melanosomes is fully blocked by the fluorescense emission filter. The bottom panels in (ad) show side views of the RPE volume. The dotted arrows in the bottom panel show the apical side of the RPE cells, whereas the solid arrows indicate the basal side of the RPE. (*p < 0.001,**p < 0.001). Scale bars: 25 μm.
Figure 7
Figure 7
AF emission spectra obtained with ex vivo confocal imaging for an excitation wavelength of 488 nm. (a) Average emission spectra acquired from 50 lipofuscin granules (spectra were normalized to the emission peak). (b) Average emission spectra measured from the whole confocal volume with identical excitation power. (c) Normalized spectra from (b).
Figure 8
Figure 8
Representative EM images showing cross sections of the RPE cell layer and RPE granules. (a) The RPE cell layer of a WT mouse. (b) The RPE cell layer of an Abca4−/− mouse. The bottom panels of (a,b) are the color-coded classified granules showing their locations. Number of granules per μm2 calculated for (c) lipofuscin, (d) melanolipofuscin, (e) melnaosomes, and (f) combined lipofuscin and melanolipofuscin. The values shown are means and standard error. Six images were quantified per strain (one eye each from 2 animals per group were analyzed and 3 images per eye were counted). Black arrows and dots: melanosomes; Blue arrows and dots: lipofuscin; Green arrows and dots: phagocytosed outer segments; red arrows and dots: melanolipofuscin, Scale bars: 10 μm. (*p < 0.001, **p < 0.01, ***p < 0.001, ***p < 0.001).

References

    1. Sparrrow JR, Hicks D, Hamel CP. The retinal pigment epithelium in health and disease. Curr. Mol. Med. 2010;10:802–823. doi: 10.2174/156652410793937813. - DOI - PMC - PubMed
    1. Somasundaran S, Constable IJ, Mellough CB, Carvalho LS. Retinal pigment epithelium and age-related macular degeneration: a review of major disease mechanisms. Clin. Exp. Ophthalmol. 2020;48:1043–1056. doi: 10.1111/ceo.13834. - DOI - PMC - PubMed
    1. Katz ML, Robison WG. What is lipofuscin? Defining characteristics and differentiation from other autofluorescent lysosomal storage bodies. Arch. Gerontol. Geriatr. 2002;34:169–184. doi: 10.1016/S0167-4943(02)00005-5. - DOI - PubMed
    1. Moreno-García A, Kun A, Calero O, Medina M, Calero M. An overview of the role of lipofuscin in age-related neurodegeneration. Front. Neurosci. 2018 doi: 10.3389/fnins.2018.00464. - DOI - PMC - PubMed
    1. Kennedy CJ, Rakoczy PE, Constable IJ. Lipofuscin of the retinal pigment epithelium: a review. Eye. 1995;9:763–771. doi: 10.1038/eye.1995.192. - DOI - PubMed

Publication types

MeSH terms