

De novo transcriptome characterization of Iris atropurpurea (the Royal Iris) and phylogenetic analysis of MADS-box and R2R3-MYB gene families
- PMID: 34376711
- PMCID: PMC8355218
- DOI: 10.1038/s41598-021-95085-5
De novo transcriptome characterization of Iris atropurpurea (the Royal Iris) and phylogenetic analysis of MADS-box and R2R3-MYB gene families
Erratum in
-
Author Correction: De novo transcriptome characterization of Iris atropurpurea (the Royal Iris) and phylogenetic analysis of MADS-box and R2R3-MYB gene families.Sci Rep. 2021 Sep 7;11(1):18154. doi: 10.1038/s41598-021-97920-1. Sci Rep. 2021. PMID: 34493789 Free PMC article. No abstract available.
Abstract
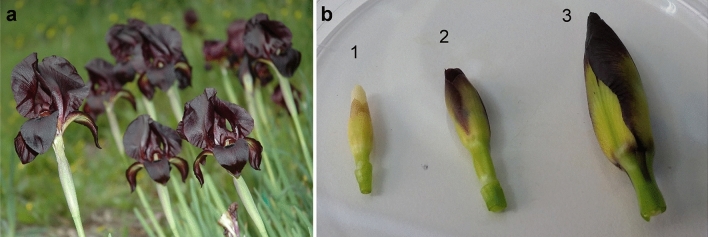
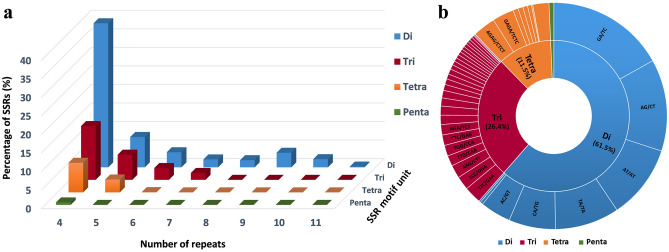
The Royal Irises (section Oncocyclus) are a Middle-Eastern group of irises, characterized by extremely large flowers with a huge range of flower colors and a unique pollination system. The Royal Irises are considered to be in the course of speciation and serve as a model for evolutionary processes of speciation and pollination ecology. However, no transcriptomic and genomic data are available for these plants. Transcriptome sequencing is a valuable resource for determining the genetic basis of ecological-meaningful traits, especially in non-model organisms. Here we describe the de novo transcriptome assembly of Iris atropurpurea, an endangered species endemic to Israel's coastal plain. We sequenced and analyzed the transcriptomes of roots, leaves, and three stages of developing flower buds. To identify genes involved in developmental processes we generated phylogenetic gene trees for two major gene families, the MADS-box and MYB transcription factors, which play an important role in plant development. In addition, we identified 1503 short sequence repeats that can be developed for molecular markers for population genetics in irises. This first reported transcriptome for the Royal Irises, and the data generated, provide a valuable resource for this non-model plant that will facilitate gene discovery, functional genomic studies, and development of molecular markers in irises, to complete the intensive eco-evolutionary studies of this group.
© 2021. The Author(s).
Conflict of interest statement
The authors declare no competing interests.
Figures
References
-
- Matthews V. A guide to species irises: Their identification and cultivation. Edinb. J. Bot. 1997;54:367–369. doi: 10.1017/S0960428600004261. - DOI
-
- Makarevitch I, Golovnina K, Scherbik S, Blinov A. Phylogenetic relationships of the siberian Iris species inferred from noncoding chloroplast DNA sequences. Int. J. Plant Sci. 2003;164:229–237. doi: 10.1086/346160. - DOI
-
- Wilson CA, Padiernos J, Sapir Y. The royal irises (Iris subg. Iris sect. Oncocyclus): Plastid and low-copy nuclear data contribute to an understanding of their phylogenetic relationships. Taxon. 2016;65:35–46. doi: 10.12705/651.3. - DOI
-
- Shmida A, Pollak G. Red Data Book: Endangered Plants of Israel. Authority Press; 2007.
-
- Sapir Y, Shmida A. Species concepts and ecogeographical divergence of Oncocyclus irises. Israel J. Plant Sci. 2002;50:119–127. doi: 10.1560/DJXH-QX0M-5P0H-DLMW. - DOI
Publication types
MeSH terms
Substances
LinkOut - more resources
Full Text Sources
Molecular Biology Databases
