. 2021 Aug 10;11(1):16238.
doi: 10.1038/s41598-021-95702-3.

Geographic source estimation using airborne plant environmental DNA in dust

Affiliations

Geographic source estimation using airborne plant environmental DNA in dust

Chelsea Lennartz et al. Sci Rep. .

Abstract

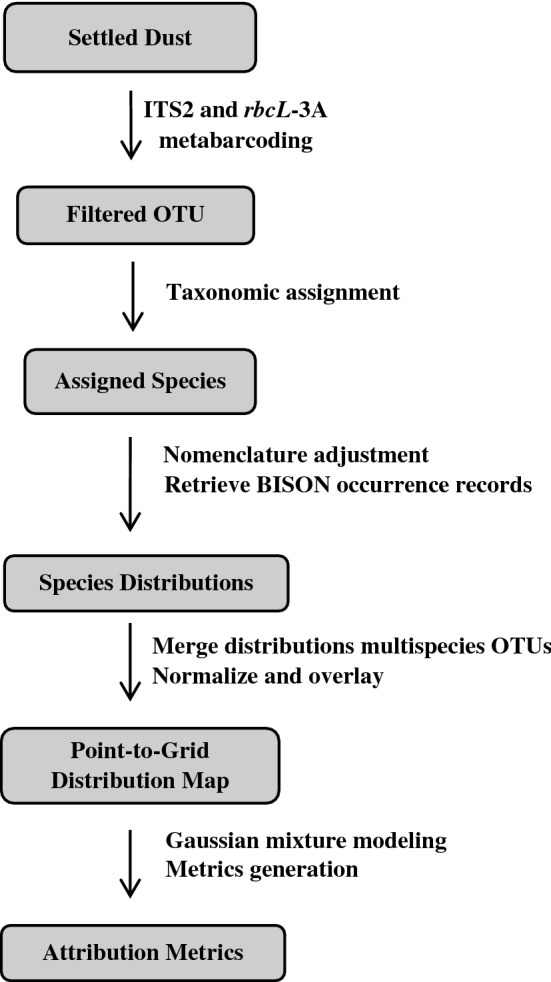
Information obtained from the analysis of dust, particularly biological particles such as pollen, plant parts, and fungal spores, has great utility in forensic geolocation. As an alternative to manual microscopic analysis of dust components, we developed a pipeline that utilizes the airborne plant environmental DNA (eDNA) in settled dust to estimate geographic origin. Metabarcoding of settled airborne eDNA was used to identify plant species whose geographic distributions were then derived from occurrence records in the USGS Biodiversity in Service of Our Nation (BISON) database. The distributions for all plant species identified in a sample were used to generate a probabilistic estimate of the sample source. With settled dust collected at four U.S. sites over a 15-month period, we demonstrated positive regional geolocation (within 600 km2 of the collection point) with 47.6% (20 of 42) of the samples analyzed. Attribution accuracy and resolution was dependent on the number of plant species identified in a dust sample, which was greatly affected by the season of collection. In dust samples that yielded a minimum of 20 identified plant species, positive regional attribution was achieved with 66.7% (16 of 24 samples). For broader demonstration, citizen-collected dust samples collected from 31 diverse U.S. sites were analyzed, and trace plant eDNA provided relevant regional attribution information on provenance in 32.2% of samples. This showed that analysis of airborne plant eDNA in settled dust can provide an accurate estimate regional provenance within the U.S., and relevant forensic information, for a substantial fraction of samples analyzed.


Conflict of interest statement

The authors declare no competing interests.

Figures

Figure 1
Figure 1
Diagram summarizing the plant eDNA geographic attribution pipeline used in this study. Starting from settled dust, DNA is extracted then subjected to metabarcoding with ITS2 and rbcL-3A, sequencing, and data processing to obtain an estimate of the site of origin.
Figure 2
Figure 2
Number of total OTU per sample generated with ITS2 and rbcL-3A minibarcodes from dust samples collected in Lexington, MA. Samples were collected on the date indicated after 14 (blue), 28 (orange), or 56 (gray) days of environmental exposure prior to analysis.
Figure 3
Figure 3
Heat map of the 40 most abundant OTUs found in 14-day dust samples collected in Lexington, MA. The OTU number, barcode used, and assigned genus according to NCBI Genbank are listed, as is the relative abundance in the sample collected on the date indicated. The shade of color indicates the number of reads from a minimum of 10 (light green) to roughly 50,000 (dark green).
Figure 4
Figure 4
(A) Point-to-grid maps displaying overlaid distributions from OTU using ITS2 and rbcL-3A minibarcodes generated from 14-day dust samples collected from four locations on the dates indicated. Grid color represents the percentage of total OTU in that sample that had a threshold number of point occurrence records within that grid. The location of sample collection is indicated (pink star). (B) Maps showing the result of Gaussian modeling model fitting to the data generated in the point-to-grid map. The location of sample collection is indicated (pink star) as are the locations of the top five peaks used to calculate AT5PE. Maps were generated using python packages interacting with ArcGIS v10.4, as described in “Methods”.
Figure 5
Figure 5
Correlation of total mapped OTU in a sample to its attribution accuracy metrics. Dust samples collected after 14-day exposure in MA (gray), FL (blue), NM (red), or SC (orange) were subject to plant metabarcoding and the resulting OTUs were mapped using our attribution pipeline. (A) Relationship between mapped OTU and TP, with a 90% TP cutoff indicated. (B) Relationship between mapped OTU and AT5PE, with a 600 km cutoff indicated.
Figure 6
Figure 6
Attribution achieved with plant eDNA derived from 31 WLOH dust samples. (A) Correlation of TP to AT5PE in WLOH dust samples in samples with 20 or more (blue) or less than 20 (red) mapped OTUs. Cutoffs for 90% TP and 600 km AT5PE are shown. (B) Map of the site of sample collection of the 31 WLOH samples in addition to the attribution accuracy (TP) and resolution (AT5PE) determined from assessment of plant eDNA from dust samples. The color indicates a TP of greater (green) or less than (brown) 90%. The shape of the marker indicates AT5PE of < 100 km (star), 100–500 km (circle), 500–1000 km (square), or > 1000 km (diamond). Maps were generated using python packages interacting with ArcGIS v10.4, as described in “Methods”.
Figure 7
Figure 7
Settled airborne dust collection station. (A) Photo from the South Carolina dust collection site of EZ-NPP tripod secured with cinder blocks holding an assembled Ambient Weather SRS100LX radiation shield (louvered shelter). Also pictured is an Onset HOBO U30-RNC Weather Station. (B) Diagram of a louvered shelter. A slide platform was created by mounting 6 magnets spaced appropriately to serve as slide holders into a base (center). Clean slides were secured into the holders with additional small magnets. Each complete louvered shelter (left) consisted of 3 sets of a slide platform underneath two spacers (right) added for additional air flow.

References

    1. Stoney D, Bowen A, Stoney P. Inferential source attribution from dust: Review and analysis. Forensic Sci. Rev. 2013;25:107–142. - PubMed
    1. Locard E. The analysis of dust traces. Am. J. Police Sci. 1930;1:276. doi: 10.2307/1147154. - DOI
    1. Wickenheiser RA. Trace DNA: A review, discussion of theory, and application of the transfer of trace quantities of DNA through skin contact. J. Forensic Sci. 2002;47(3):442–450. doi: 10.1520/JFS15284J. - DOI - PubMed
    1. Adams-Groom B. Frequency and abundance of pollen taxa in crime case samples from the United Kingdom. Grana. 2015;54(2):146–155. doi: 10.1080/00173134.2014.967716. - DOI
    1. Bryant VM, Jones GD. Forensic palynology: Current status of a rarely used technique in the United States of America. Forensic Sci. Int. 2006;163(3):183–197. doi: 10.1016/j.forsciint.2005.11.021. - DOI - PubMed