. 2021 Aug 10;4(1):954.
doi: 10.1038/s42003-021-02447-w.

Spectral dynamic causal modelling in healthy women reveals brain connectivity changes along the menstrual cycle

Affiliations

Spectral dynamic causal modelling in healthy women reveals brain connectivity changes along the menstrual cycle

Esmeralda Hidalgo-Lopez et al. Commun Biol. .

Abstract

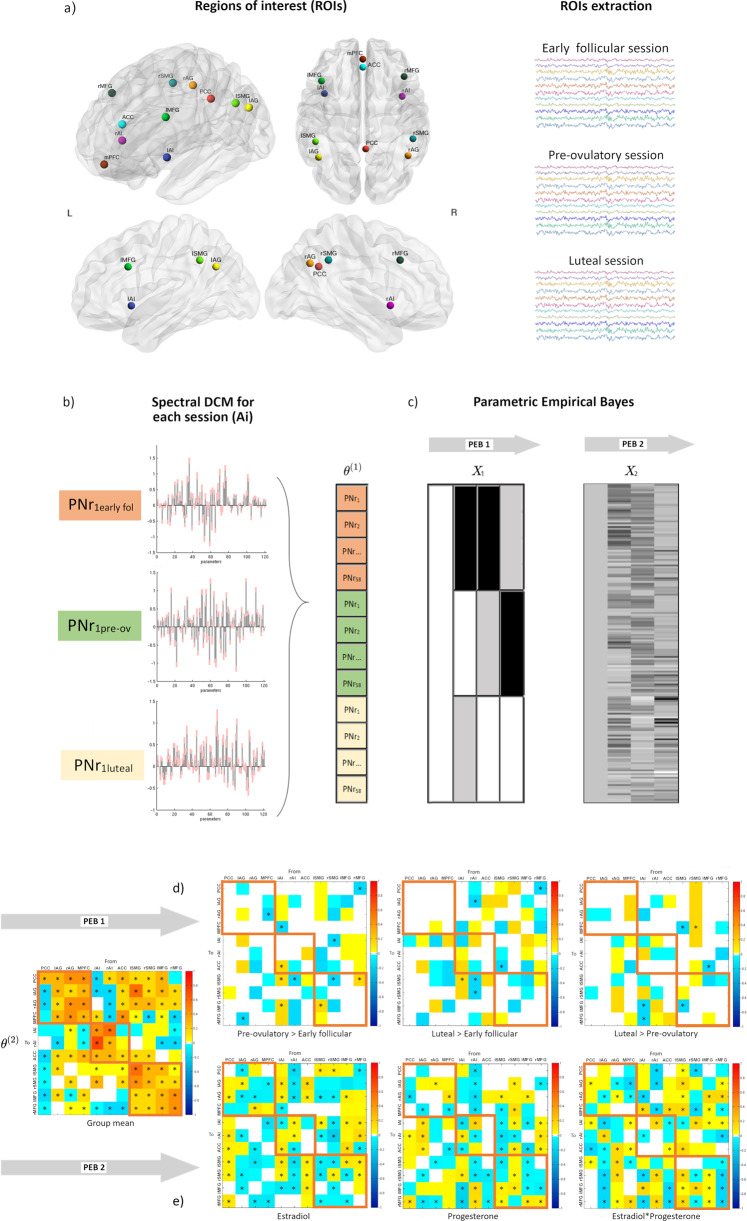
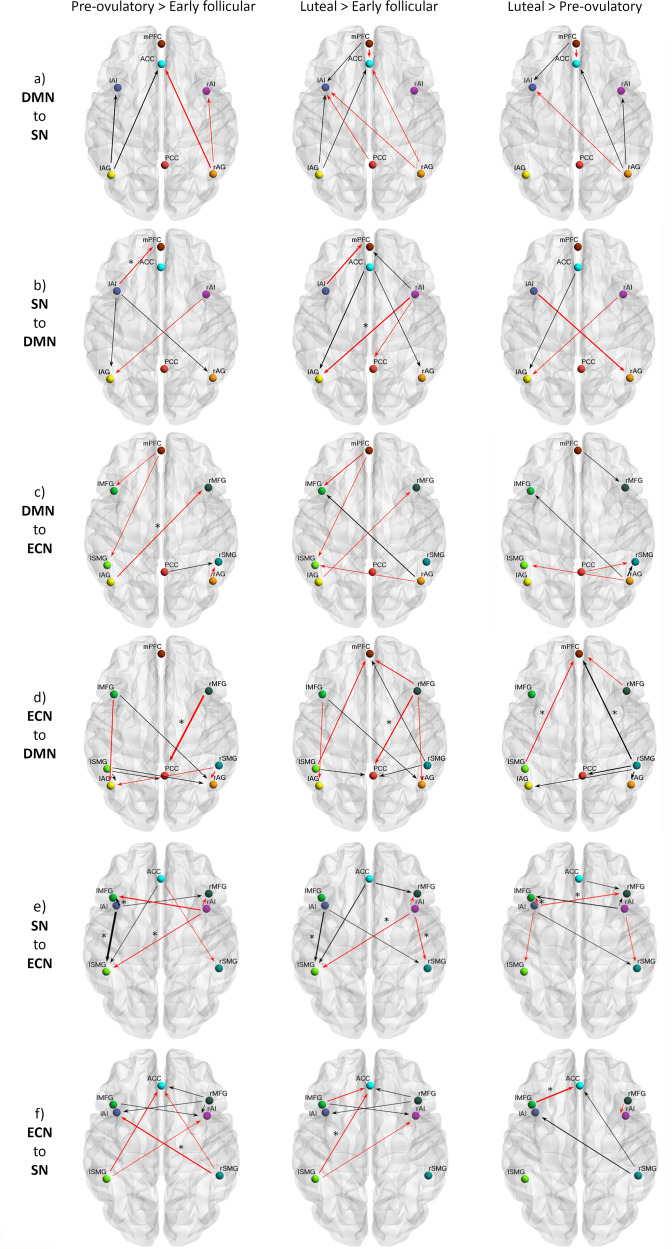
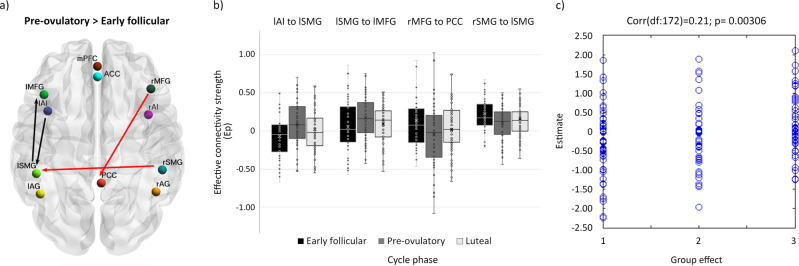
Longitudinal menstrual cycle studies allow to investigate the effects of ovarian hormones on brain organization. Here, we use spectral dynamic causal modelling (spDCM) in a triple network model to assess effective connectivity changes along the menstrual cycle within and between the default mode, salience and executive control networks (DMN, SN, and ECN). Sixty healthy young women were scanned three times along their menstrual cycle, during early follicular, pre-ovulatory and mid-luteal phase. Related to estradiol, right before ovulation the left insula recruits the ECN, while the right middle frontal gyrus decreases its connectivity to the precuneus and the DMN decouples into anterior/posterior parts. Related to progesterone during the mid-luteal phase, the insulae (SN) engage to each other, while decreasing their connectivity to parietal ECN, which in turn engages the posterior DMN. When including the most confident connections in a leave-one out cross-validation, we find an above-chance prediction of the left-out subjects' cycle phase. These findings corroborate the plasticity of the female brain in response to acute hormone fluctuations and may help to further understand the neuroendocrine interactions underlying cognitive changes along the menstrual cycle.


Conflict of interest statement

The authors declare no competing interests.

Figures

Fig. 1
Fig. 1. Procedures for dynamic effective connectivity analysis.
The regions of interest from each ICN used in the current study is shown in (a). The default mode brain regions included the precuneus/posterior cingulate cortex (PCC), medial prefrontal cortex (mPFC) and bilateral angular gyrus (AG); the salience network comprised bilateral anterior insula (AI) and anterior cingulate cortex (ACC), and the executive control network was composed of bilateral middle frontal gyri (MFG) and bilateral supramarginal gyri (SMG). Each participant had three sessions locked to their menstrual cycle: during early follicular, pre-ovulatory and mid-luteal phase. b A spectral DCM (spDCM) of 121 parameters was estimated for each session of every participant in a group DCM (θ1). c For the group-level analysis, Parametric Empirical Bayesian analysis (PEB) was used to investigate the cycle phase and hormonal levels group effects. This is a general linear model of the connectivity parameters. Shown are the design matrix X1 for cycle phase and X2 for hormonal levels, where lighter colours indicate higher values. d Estimated parameters for PEB 1 (cycle phases). e Estimated parameters for PEB 2 (hormonal levels). For (d) and (e) connections surpassing a posterior probability of 95% are indicated with an asterisk. The columns are the outgoing connections, the rows are the incoming connections, ordered as: PCC, lAG, rAG, mPFC, lAI, rAI, ACC, lSMG, rSMG, lMFG, and rMFG. Hot colours indicate positive parameter estimates and cold colours negative.
Fig. 2
Fig. 2. Cycle phase differences in within-network effective connectivity.
a DMN; b SN; c ECN. Only connections with a posterior probability >0.75 are displayed. Connections surpassing a posterior probability of 95% are indicated with an asterisk. The results reflect connection strengths as a difference between the indicated cycle phases. The differential connection strengths are depicted by the width of the arrow. Black arrows reflect positive values and red arrows reflect negative values for those connections which showed differences in the former than in the latter indicated cycle phase.
Fig. 3
Fig. 3. Cycle phase differences in between-network effective connectivity.
a From the DMN to the SN; b From the SN to the DMN; c From the DMN to the ECN; d From the ECN to the DMN; e From the SN to the ECN; f From the ECN to the SN. Only connections with a posterior probability >0.75 are displayed. Connections surpassing a posterior probability of 95% are indicated with an asterisk. The results reflect connection strengths as a difference between the indicated cycle phases. The differential connection strengths are depicted by the width of the arrow. Black arrows reflect positive values and red arrows reflect negative values for those connections which showed differences in the former than in the latter indicated cycle phase.
Fig. 4
Fig. 4. Cycle phase differences in effective connectivity within and between intrinsic connectivity networks DMN, SN and ECN with a posterior probability >0.99.
a Differential connectivity strength between the indicated cycle phases is depicted by the width of the arrow. Black arrows reflect positive values and red arrows reflect negative values for those connections which showed differences in the former than in the latter indicated cycle phase. b Box plot showing parameter estimates per cycle phase for each connection, n = 174. c Out-of-samples correlation scatter plot from the LOOCV analysis displaying the correlation between the actual cycle phase in the left-out-subject’s design matrix (early follicular, pre-ovulatory or mid-luteal) and the predicted cycle phase based on the left-out-subject’s connectivity (rdf:172 = 0.21, p = 0.003). Source data can be found in Supplementary Data file 2 and 3, respectively.
Fig. 5
Fig. 5. Summary of cycle-related differences in within and between-network effective connectivity.
Each row depicts the connections observed to be enhanced in each cycle phase compared to the others within and from (a) DMN; (b) SN; and (c) ECN. Only connections with a posterior probability >0.75 are displayed. Within-network connections are depicted in black and the efferent connectivity to the DMN in brown, to the SN in blue, and to the ECN in green.

References

    1. McEwen BS, Milner TA. Understanding the broad influence of sex hormones and sex differences in the brain. J. Neurosci. Res. 2017;95:24–39. doi: 10.1002/jnr.23809. - DOI - PMC - PubMed
    1. Clemens AM, et al. Estrus-cycle regulation of cortical inhibition. Curr. Biol. 2019;29:605–615.e6. doi: 10.1016/j.cub.2019.01.045. - DOI - PubMed
    1. Tang, Y. et al. Estrogen replacement increases spinophilin-immunoreactive spine number in the prefrontal cortex of female rhesus monkeys. Cereb. Cortex10.1093/cercor/bhg121 (2004). - PubMed
    1. Schumacher M, et al. Revisiting the roles of progesterone and allopregnanolone in the nervous system: Resurgence of the progesterone receptors. Prog. Neurobiol. 2014;113:6–39. doi: 10.1016/j.pneurobio.2013.09.004. - DOI - PubMed
    1. Luine VN. Estradiol and cognitive function: Past, present and future. Horm. Behav. 2014;66:602–618. doi: 10.1016/j.yhbeh.2014.08.011. - DOI - PMC - PubMed

Publication types