. 2021;126(10):8433-8470.
doi: 10.1007/s11192-021-04097-5. Epub 2021 Aug 5.

A qualitative and quantitative analysis of open citations to retracted articles: the Wakefield 1998 et al.'s case

Affiliations

A qualitative and quantitative analysis of open citations to retracted articles: the Wakefield 1998 et al.'s case

Ivan Heibi et al. Scientometrics. 2021.

Abstract

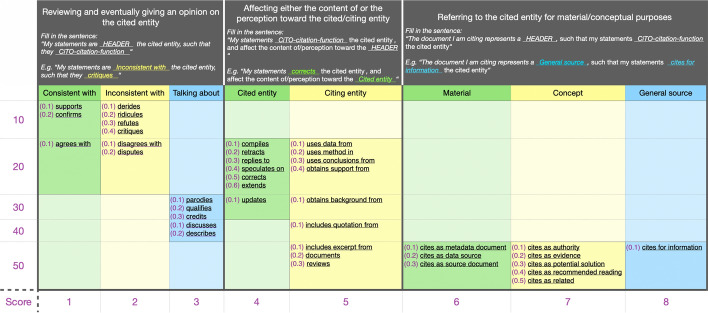
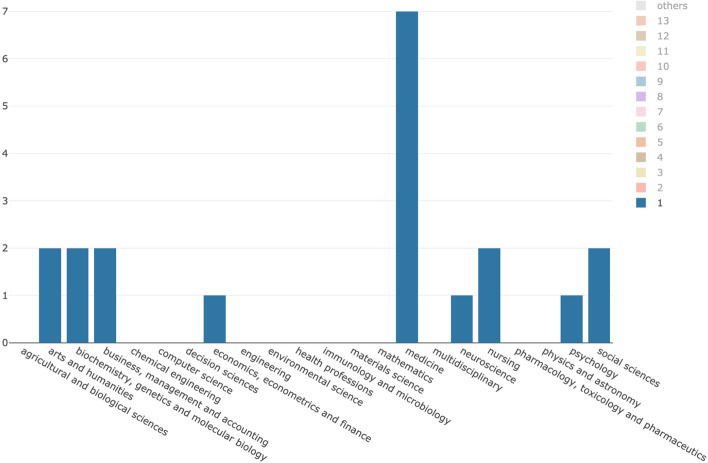
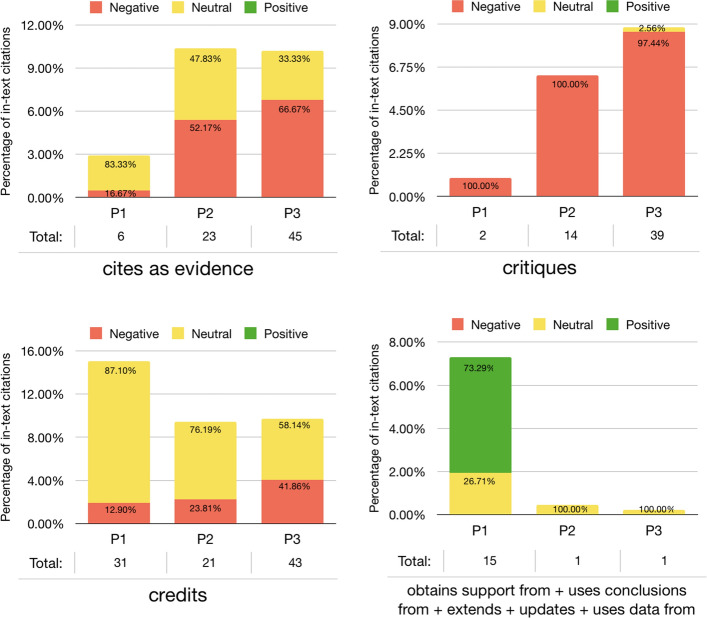
In this article, we show the results of a quantitative and qualitative analysis of open citations on a popular and highly cited retracted paper: "Ileal-lymphoid-nodular hyperplasia, non-specific colitis and pervasive developmental disorder in children" by Wakefield et al., published in 1998. The main purpose of our study is to understand the behavior of the publications citing one retracted article and the characteristics of the citations the retracted article accumulated over time. Our analysis is based on a methodology which illustrates how we gathered the data, extracted the topics of the citing articles and visualized the results. The data and services used are all open and free to foster the reproducibility of the analysis. The outcomes concerned the analysis of the entities citing Wakefield et al.'s article and their related in-text citations. We observed a constant increasing number of citations in the last 20 years, accompanied with a constant increment in the percentage of those acknowledging its retraction. Citing articles have started either discussing or dealing with the retraction of Wakefield et al.'s article even before its full retraction happened in 2010. Articles in the social sciences domain citing the Wakefield et al.'s one were among those that have mostly discussed its retraction. In addition, when observing the in-text citations, we noticed that a large number of the citations received by Wakefield et al.'s article has focused on general discussions without recalling strictly medical details, especially after the full retraction. Medical studies did not hesitate in acknowledging the retraction of the Wakefield et al.'s article and often provided strong negative statements on it.

Keywords: Citation analysis; Retraction; Science of Science; Topic modeling.


Figures

Fig. 1
Fig. 1
The decision model for the selection of a CiTO citation function to use for the annotation of the citation intent of a an examined in-text citation based on its context. The first large row contains the three macro-categories: (1) “Reviewing …”, (2) “Affecting …” and (3) “Referring …”. Each macro-category has at least two subcategories and each subcategory refers to a set of citation functions. The first row defines what are the citation functions suitable for it through the help of a guiding sentence which needs to be completed according to the chosen sub-category and citation function
Fig. 2
Fig. 2
The coherence score of different LDA topic models built using a variable number of topics, from 1 to 40. The topic model is based on the corpus and dictionary of the in-text citation contexts. The orange line is the average value and it plateaus around 22–23 topics
Fig. 3
Fig. 3
The workflow, created via MITAO, we used for computing the LDA topic modeling and generating the LDAvis (LDA visualization) and MTMvis (Metadata-based Topic Modeling visualization) visualizations (the tools “LDAvis”, “MTMvis < period > ” and “MTMvis < area > ”). The green squares are used to specify input material which is considered by the various tools composing the workflow (i.e., the red rhombi). In particular, the workflow takes three inputs: (a) the vectorized corpus (“Corpus”), (b) a dictionary of words based on the tokenization results (“Dictionary”) and (c) the metadata of the original documents forming the corpus (“Meta”). The arrows between the tools indicate the direction of the data flow and the output-input relation among them. For instance, the execution of the workflow starts with the tool “LDA Topic Modeling”, that takes in input the “Corpus” and the “Dictionary” and produces an output that is used as part of the input for other three tools, i.e. “LDAvis”, “Terms X Topics” and “Docs X Topics”
Fig. 4
Fig. 4
A summary of the citing entities. The first column contains the periods P1–P3 we considered, the second column shows the distribution per year of the citing entities that do mention (in green) or do not mention (in red) the retraction of WF-PUB-1998, while the third column shows the distribution of the subject areas of the citing entities. (Color figure online)
Fig. 5
Fig. 5
The LDAvis visualization built over the topic model obtained from the abstracts of the citing entities
Fig. 6
Fig. 6
MTMvis built on the topic model obtained from the abstracts of the citing entities, shown against the three period P1-P3. For each period the visualization plots the topics distribution (e.g. topic 3 is the dominant topic in all the periods: P1, P2 and P3
Fig. 7
Fig. 7
MTMvis built on the topic model obtained from the abstracts of the citing entities, shown against their subject areas. For each subject area the visualization plots the topics distribution (e.g. topic 3 is the dominant topic in”arts and humanities”)
Fig. 8
Fig. 8
A summary of the in-text citations. All the data are classified under the three sentiments: negative (red), neutral (yellow) and positive (green). The first column contains the periods P1-P3 we considered, the second column shows the distribution per year of the in-text citations, the third column shows the citation intents distribution and the last column shows the in-text citation sections distribution
Fig. 9
Fig. 9
The LDAvis visualization of the topic model created using the citation contexts of the in-text citations contained in the entities citing WF-PUB-1998
Fig. 10
Fig. 10
MTMvis created considering the topics extracted from the citation contexts of the in-text citations citing WF-PUB-1998 according to the periods P1-P3. For each period the visualization plots the topics distribution – e.g., topic 8 (in purple) is the dominant topic in P1
Fig. 11
Fig. 11
MTMvis created considering the topics extracted from the citation contexts of the in-text citations citing WF-PUB-1998 according to the subject areas of the citing entities. For each period the visualization plots the topics distribution – e.g., topic 3 (in dark yellow) is the dominant topic of the “arts and humanities” subject area
Fig. 12
Fig. 12
The evolution of topics 1, 2 and 5 during P2–P3 on all the subject areas plotted using MTMvis. MTMvis has been generated from the topic model created using the abstracts of the citing entities. The themes covered by these topics are close to the retraction phenomena and used a limited number of terms from medical jargon
Fig. 13
Fig. 13
The distribution of topic 1 over all the subject areas during P2–P3 plotted using MTMvis. MTMvis has been generated from the topic model created using the abstracts of the citing entities. Topic 1 include terms from the social science domain and relates to ethical themes
Fig. 14
Fig. 14
The subject areas of citing entities published in P2–P3 which includes either topic 2, or 5 in their top 5 topics. The themes covered by these topics relate to the retraction phenomena and use a limited number of terms from medical jargon
Fig. 15
Fig. 15
The four graphs illustrate the way the use of citation intents changed over time (i.e., the three periods P1, P2 and P3) and according to their perceived sentiment. The citation intents cites as evidence, critiques and credits are illustrated in separated charts, that show an increment in the negative sentiment along the three periods
Fig. 16
Fig. 16
The cites as evidence and credits citation intents distributions among the sections (the recognizable ones) and during the three periods (i.e. P1–P3)
Fig. 17
Fig. 17
The evolution over time of three groups of topics defined from the citation contexts of the in-text citations to WF-PUB-1998
Fig. 18
Fig. 18
The increasing (left) and decreasing (right) topics of the in-text citation topic model, considering only the medicine area of study

References

    1. Azoulay P, Bonatti A, Krieger JL. The career effects of scandal: Evidence from scientific retractions. Research Policy. 2017;46(9):1552–1569. doi: 10.1016/j.respol.2017.07.003. - DOI
    1. Barbour, V., Kleinert, S., Wager, E., & Yentis, S. (2009). Guidelines for retracting articles. Committee on Publication Ethics. 10.24318/cope.2019.1.4
    1. Bar-Ilan J, Halevi G. Post retraction citations in context: A case study. Scientometrics. 2017;113(1):547–565. doi: 10.1007/s11192-017-2242-0. - DOI - PMC - PubMed
    1. Bar-Ilan J, Halevi G. Temporal characteristics of retracted articles. Scientometrics. 2018;116(3):1771–1783. doi: 10.1007/s11192-018-2802-y. - DOI
    1. Bengfort, B., Bilbro, R., & Ojeda, T. (2018). Applied text analysis with Python: Enabling language-aware data products with machine learning (First edition). O’Reilly Media, Inc.

LinkOut - more resources