

Spatiotemporal Associations Between Social Vulnerability, Environmental Measurements, and COVID-19 in the Conterminous United States
- PMID: 34377879
- PMCID: PMC8335698
- DOI: 10.1029/2021GH000423
Spatiotemporal Associations Between Social Vulnerability, Environmental Measurements, and COVID-19 in the Conterminous United States
Abstract
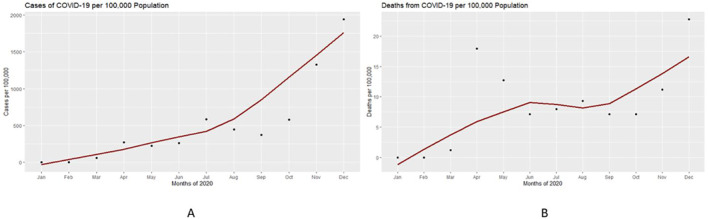
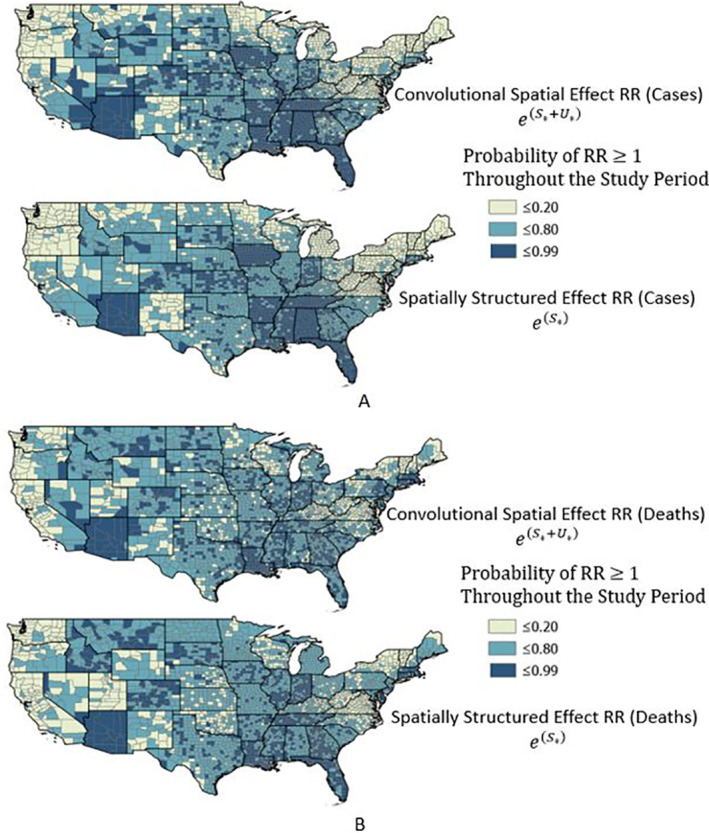
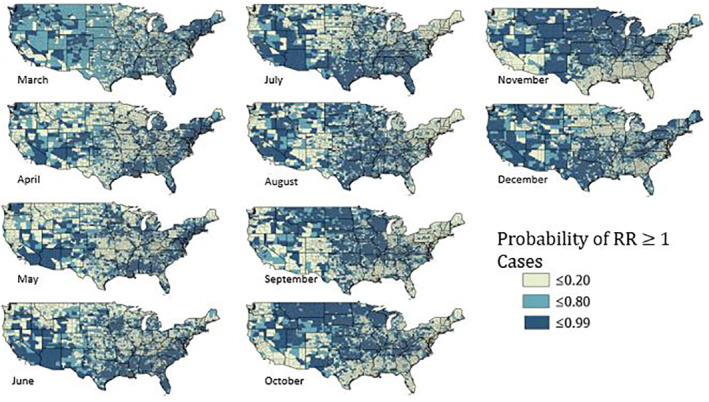
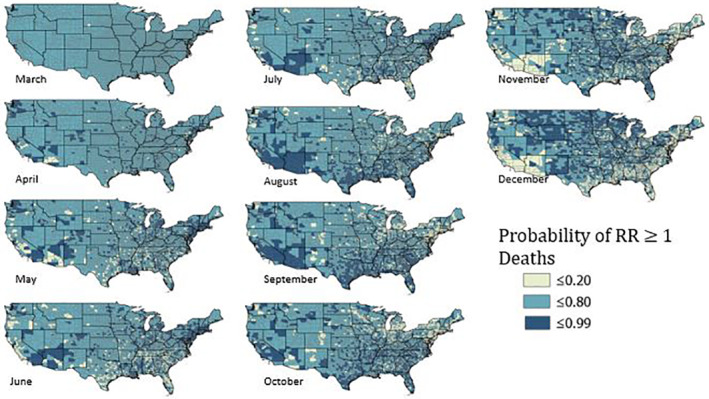
This study summarizes the results from fitting a Bayesian hierarchical spatiotemporal model to coronavirus disease 2019 (COVID-19) cases and deaths at the county level in the United States for the year 2020. Two models were created, one for cases and one for deaths, utilizing a scaled Besag, York, Mollié model with Type I spatial-temporal interaction. Each model accounts for 16 social vulnerability and 7 environmental variables as fixed effects. The spatial pattern between COVID-19 cases and deaths is significantly different in many ways. The spatiotemporal trend of the pandemic in the United States illustrates a shift out of many of the major metropolitan areas into the United States Southeast and Southwest during the summer months and into the upper Midwest beginning in autumn. Analysis of the major social vulnerability predictors of COVID-19 infection and death found that counties with higher percentages of those not having a high school diploma, having non-White status and being Age 65 and over to be significant. Among the environmental variables, above ground level temperature had the strongest effect on relative risk to both cases and deaths. Hot and cold spots, areas of statistically significant high and low COVID-19 cases and deaths respectively, derived from the convolutional spatial effect show that areas with a high probability of above average relative risk have significantly higher Social Vulnerability Index composite scores. The same analysis utilizing the spatiotemporal interaction term exemplifies a more complex relationship between social vulnerability, environmental measurements, COVID-19 cases, and COVID-19 deaths.
Keywords: Bayesian spatiotemporal disease modeling; COVID‐19 pandemic; environmental determinants of COVID‐19; remote sensing and COVID‐19; social vulnerability; spatial epidemiology.
© 2021. The Authors. GeoHealth published by Wiley Periodicals LLC on behalf of American Geophysical Union.
Conflict of interest statement
The authors declare no conflicts of interest relevant to this study.
Figures


References
-
- Besag, J. , York, J. , & Mollié, A. (1991). Bayesian image restoration, with two applications in spatial statistics. Annals of the Institute of Statistical Mathematics, 43(1), 1–20. 10.1007/bf00116466 - DOI
LinkOut - more resources
Full Text Sources