

A statistical model for the dynamics of COVID-19 infections and their case detection ratio in 2020
- PMID: 34378235
- PMCID: PMC8426968
- DOI: 10.1002/bimj.202100125
A statistical model for the dynamics of COVID-19 infections and their case detection ratio in 2020
Abstract
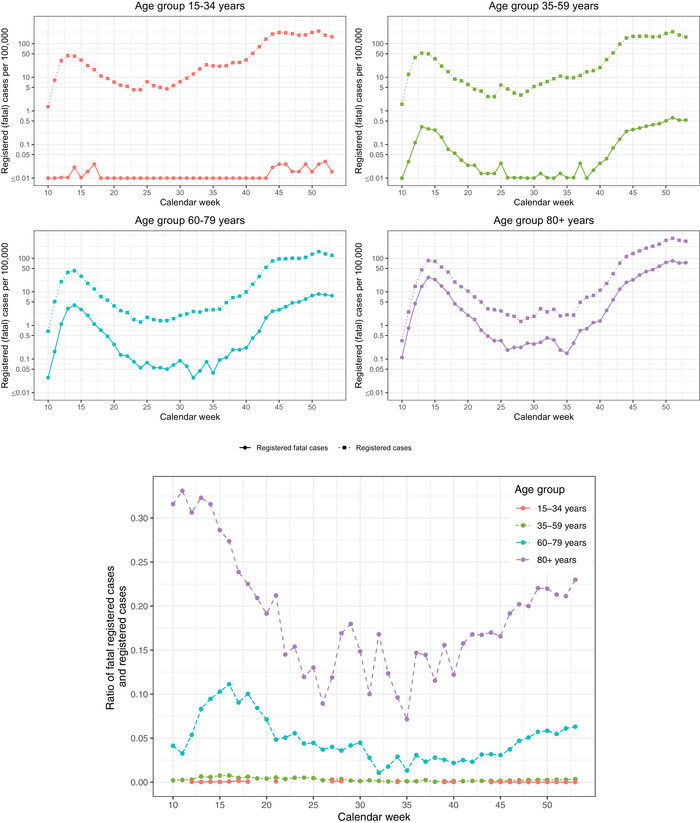
The case detection ratio of coronavirus disease 2019 (COVID-19) infections varies over time due to changing testing capacities, different testing strategies, and the evolving underlying number of infections itself. This note shows a way of quantifying these dynamics by jointly modeling the reported number of detected COVID-19 infections with nonfatal and fatal outcomes. The proposed methodology also allows to explore the temporal development of the actual number of infections, both detected and undetected, thereby shedding light on the infection dynamics. We exemplify our approach by analyzing German data from 2020, making only use of data available since the beginning of the pandemic. Our modeling approach can be used to quantify the effect of different testing strategies, visualize the dynamics in the case detection ratio over time, and obtain information about the underlying true infection numbers, thus enabling us to get a clearer picture of the course of the COVID-19 pandemic in 2020.
Keywords: COVID-19; case detection ratio; dark figure of infections; generalized additive models; penalized splines.
© 2020 The Authors. Biometrical Journal published by Wiley-VCH GmbH.
Conflict of interest statement
The authors have declared no conflict of interest.
Figures


References
-
- Aspelund, K. , Droste, M. , Stock, J. H. & Walker, C. D. (2020). Identification and estimation of undetected COVID‐19 cases using testing data from Iceland. NBER Working Paper w27528.
-
- Buitrago‐Garcia, D. , Egli‐Gany, D. , Counotte, M. J. , Hossmann, S. , Imeri, H. , Ipekci, A. M. , Salanti, G. , & Low, N. (2020). Occurrence and transmission potential of asymptomatic and presymptomatic SARS‐CoV‐2 infections: A living systematic review and meta‐analysis. PLoS Medicine, 17(9), e1003346. - PMC - PubMed
-
- De Boor, C. (1972). On calculating with B‐splines. Journal of Approximation Theory, 6(1), 50–62.
MeSH terms
LinkOut - more resources
Full Text Sources
Medical
