. 2021 Sep;14(5):2199-2213.
doi: 10.1111/1751-7915.13904. Epub 2021 Aug 11.

Profiling the physiological pitfalls of anti-hepatitis C direct-acting agents in budding yeast

Affiliations

Profiling the physiological pitfalls of anti-hepatitis C direct-acting agents in budding yeast

Galal Yahya et al. Microb Biotechnol. 2021 Sep.

Abstract

Sofosbuvir and Daclatasvir are among the direct-acting antiviral (DAA) medications prescribed for the treatment of chronic hepatitis C (CHC) virus infection as combination therapy with other antiviral medications. DAA-based therapy achieves high cure rates, reaching up to 97% depending on the genotype of the causative hepatitis C virus (HCV). While DAAs have been approved as an efficient and well-tolerated therapy for CHC, emerging concerns about adverse cardiac side effects, higher risk of recurrence and occurrence of hepatocellular carcinoma (HCC) and doubts of genotoxicity have been reported. In our study, we investigated in detail physiological off-targets of DAAs and dissected the effects of these drugs on cellular organelles using budding yeast, a unicellular eukaryotic organism. DAAs were found to disturb the architecture of the endoplasmic reticulum (ER) and the mitochondria, while showing no apparent genotoxicity or DNA damaging effect. Our study provides evidence that DAAs are not associated with genotoxicity and highlights the necessity for adjunctive antioxidant therapy to mitigate the adverse effects of DAAs on ER and mitochondria.


Conflict of interest statement

The authors declare that they have no conflict of interest.

Figures

Fig. 1
Fig. 1
Minimal inhibitory concentration (MIC) determination of Sofosbuvir and Daclatasvir. Chemical structures of (A) Sofosbuvir (SOF) and (B) Daclatasvir (DCV). (C) Dose–response curve of twofold serial dilutions of Daclatasvir (mean ± SD; n = 3 independent biological replicates). (D) Dose‐response curve of twofold serial dilutions of Sofosbuvir (mean ± SD; n = 3 independent biological replicates). (E) Representative drop dilution of exponentially growing isogenic series of yeast strain of different ploidy on YPD plates supplemented with 128 µM Sofosbuvir (SOF) or 64 µM Daclatasvir (DCV). Plates were imaged after 48 h of incubation at 30 °C.
Fig. 2
Fig. 2
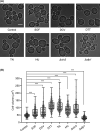
Sofosbuvir and Daclatasvir enlarge budding volume. A. Representative bright‐field images of haploid yeast cell grown for 4–6 h in YPD media (control; CT), or media supplemented with 64 µM Sofosbuvir (SOF), 32 µM Daclatasvir (DCV), or other drugs that affect cell volume (5 mM Dithiothreitol; DTT, 5 µM Tunicamycin; TN and 200 mM Hydroxyurea; HU). ∆cln3 mutant was used as a control for large cell volume and ∆sfp1 for small cell volume. Scale bar: 5 μm. B. Quantification of individual volumes at budding of (A) yeast cells (box plots represent 25th percentile, median, 75th percentile, the whiskers extend to the minimum and maximum values; n = 400 cells; 3 independent biological replicates). The statistical analysis was done using one‐way ANOVA and Tukey–Kramer post hoc test (***P < 0.001).
Fig. 3
Fig. 3
Effect of Sofosbuvir and Daclatasvir on ER architecture. A. Representative fluorescence images of Sec63‐GFP localization in control cells (CT), cells treated with 64 µM Sofosbuvir (SOF), 32 µM Daclatasvir (DCV) or 5 µM Tunicamycin (TN) as a positive control for ER stressing agent for 4–6 h. Cortical (cER) and nuclear ERs (nER) are labelled. Scale bar, 5 µm. B. Expression analysis of heat shock protein Hsp26. Cells expressing Hsp26‐6HA were exponentially grown for 4–6 h in YPD media supplemented with DMSO, 64 µM Sofosbuvir (SOF), 32 µM Daclatasvir (DCV) or 5 µM Tunicamycin (TN). Levels of Hsp26‐6HA were analysed by Western blot, and Rps23 was used as a loading control. C. Relative abundance quantification of Hsp26‐6HA in (B). Mean ± SD (3 independent biological replicates). The statistical analysis was done using one‐way ANOVA and Tukey–Kramer post hoc test (***P < 0.001).
Fig. 4
Fig. 4
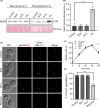
Sofosbuvir and Daclatasvir cause no genotoxic stress. A. Cells expressing Rad53‐6HA were exponentially grown in YPD media, arrested in G1 phase with α‐factor and then released into YPD media supplemented with DMSO, 64 µM Sofosbuvir (SOF), 32 µM Daclatasvir (DCV) or 200 mM Hydroxyurea (HU) as a positive control for genotoxic stress. Samples were collected at time 0 and after 2 h post‐treatments. Basal levels and phosphorylation of Rad53‐6HA were analysed by Western blot. Ponceau staining was used as a loading control. B. Relative abundance quantification of Rad53‐6HA (relative to time 0 before treatment) in (A). Mean ± SD (3 independent biological replicates). The statistical analysis was performed using one‐way ANOVA and Tukey–Kramer post hoc test (***P < 0.001). C. Budding index for the respective cells in (A), samples were collected at the indicated time points, budding index was calculated after microscopic examination (at least 200 cells per count were scored). Mean ± SD is shown from 3 independent biological replicates. D. Chromosome segregation (centromeres of chromosome 4 labelled by CEN4‐tetO/TetR‐GFP; in green) in cells grown in media supplemented with DMSO, 64 µM Sofosbuvir (SOF) 32 µM Daclatasvir (DCV) or benomyl (10 μg ml−1). Spc29‐RFP stains the spindle pole bodies; in red. Scale bar, 5 µm. E. Percentage (mean ± SD) of correct chromosome segregation of cells in (D); (correct segregation was identified as a distribution of the 2 chromatids between mother and daughter cells, while existence of two dots in one cell was scored as a mis‐segregation event, at least n = 300 cells for each experiment were counted; 3 independent biological replicates). The statistical analysis was done using one‐way ANOVA and Tukey–Kramer post hoc test (***P < 0.001).
Fig. 5
Fig. 5
Sofosbuvir and Daclatasvir affect integrity and copy number of mitochondrial DNA. A. Mitochondrial nucleoid signals in control cells, 64 µM Sofosbuvir (SOF), 32 µM Daclatasvir (DCV) and cells depleted of mitochondrial DNA (rho0 ) as a negative control. Cells were grown to mid‐logarithmic growth phase (6–8 h) in YPG media and stained with DAPI to visualize DNA. Scale bar, 5 µm. B. Quantification of mitochondrial DNA copy number by qPCR for the respective cells in (A). Total DNA was extracted from respective cells, and qPCR was performed using primers for COX3 (mitochondrial DNA locus) and ACT1 (housekeeping chromosomal DNA locus). Mean ± SD (n = 3 independent biological replicates). The statistical analysis was done using one‐way ANOVA and Tukey–Kramer post hoc test (***P < 0.001). C. Cox2 protein levels analysed by Western blot in control cells, 64 µM Sofosbuvir (SOF), 32 µM Daclatasvir (DCV) or with 50 µg ml−1 Chloramphenicol (CHL) as a negative control. D. Relative abundance quantification of Cox2 in (C). Mean ± SD (3 independent biological replicates). The statistical analysis was done using one‐way ANOVA and Tukey–Kramer post hoc test (***P < 0.001).
Fig. 6
Fig. 6
Sofosbuvir and Daclatasvir alter mitochondria integrity and impair mitochondria respiration. A. Representative fluorescence microscopy images of control cells, 64 µM Sofosbuvir (SOF) or 32 µM Daclatasvir (DCV) and respiratory deficient cells (rho0 ) as a negative control. Cells harbouring pYX232‐mtGFP (a plasmid for expression of mitochondria‐targeted GFP in yeast) were grown to mid‐logarithmic growth phase (6–8 h) in YPG, and then subjected to fluorescent microscopy to visualize mitochondria. Scale bar, 5 µm. B. Oxygen concentration of respective cells in (A). Values are mean oxygen concentration ±SD (n = 3 independent biological replicates). The statistical analysis was performed using Kruskal–Wallis test followed by Dunn post hoc test (***P < 0.001).

References

    1. Abouelkheir Abdalla, D., Ali Elhadidy, T., Besheer, T., and Elsayed Farag, R. (2017) Respiratory adverse effects of Sofosbuvir‐based regimens for treatment of chronic hepatitis C virus. Egyptian J Chest Dis Tuberc 66: 363–367.
    1. Albert, B., Tomassetti, S., Gloor, Y., Dilg, D., Mattarocci, S., Kubik, S., et al. (2019) Sfp1 regulates transcriptional networks driving cell growth and division through multiple promoter‐binding modes. Genes Dev 33: 288–293. - PMC - PubMed
    1. Allen, J.B., Zhou, Z., Siede, W., Friedberg, E.C., and Elledge, S.J. (1994) The SAD1/RAD53 protein kinase controls multiple checkpoints and DNA damage‐induced transcription in yeast. Genes Dev 8: 2401–2415. - PubMed
    1. Amponsah, P.S., Yahya, G., Zimmermann, J., Mai, M., Mergel, S., Mühlhaus, T., et al. (2021) Peroxiredoxins couple metabolism and cell division in an ultradian cycle. Nat Chem Biol 17: 477–484. - PubMed
    1. Andrade, X.A., Paz, L.H., Nassar, M., Oramas, D.M., Fuentes, H.E., Kovarik, P., et al. (2018) Primary liver diffuse large B‐cell lymphoma following complete response for hepatitis C infection after direct antiviral therapy. Acta Haematol 139: 77–80. - PubMed

Publication types

MeSH terms

Substances