. 2022 Feb 1;15(2):dmm048887.
doi: 10.1242/dmm.048887. Epub 2021 Aug 11.

Tissue architecture delineates field cancerization in BRAFV600E-induced tumor development

Affiliations

Tissue architecture delineates field cancerization in BRAFV600E-induced tumor development

Elin Schoultz et al. Dis Model Mech. .

Abstract

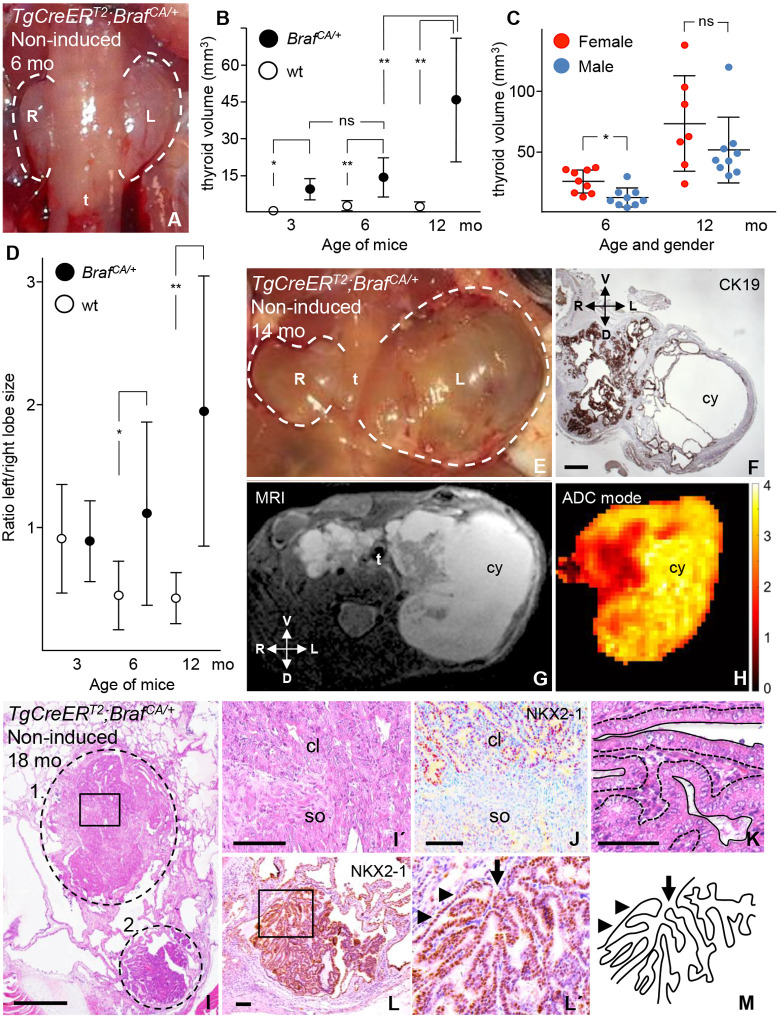
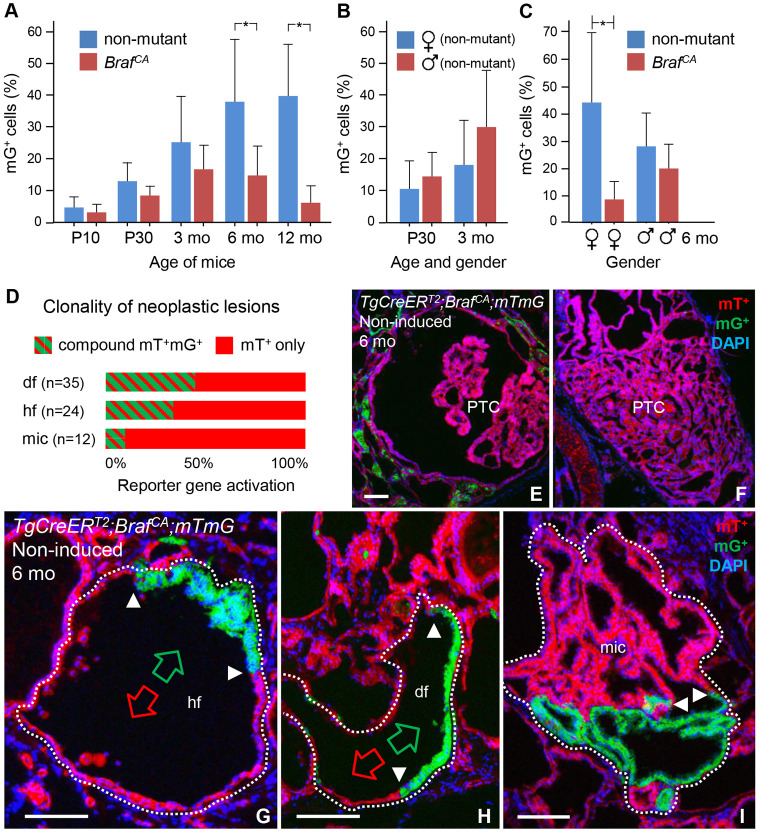
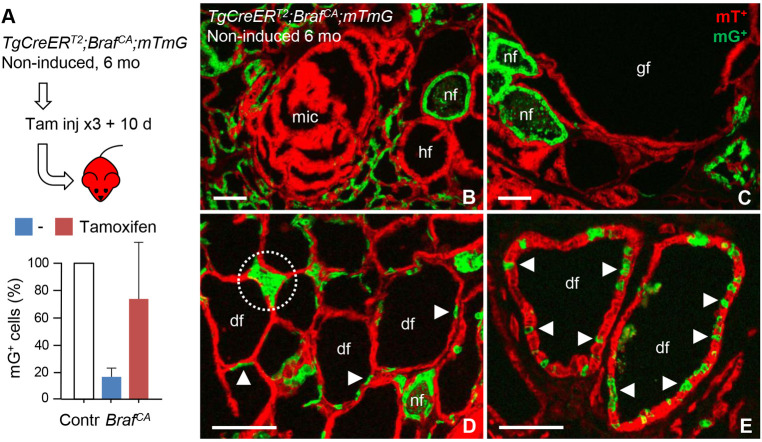
Cancer cells hijack developmental growth mechanisms but whether tissue morphogenesis and architecture modify tumorigenesis is unknown. Here, we characterized a new mouse model of sporadic thyroid carcinogenesis based on inducible expression of BRAF carrying a Val600 Glu (V600E) point mutation (BRAFV600E) from the thyroglobulin promoter (TgCreERT2). Spontaneous activation of this Braf-mutant allele due to leaky activity of the Cre recombinase revealed that intrinsic properties of thyroid follicles determined BRAF-mutant cell fate. Papillary thyroid carcinomas developed multicentrically within a normal microenvironment. Each tumor originated from a single follicle that provided a confined space for growth of a distinct tumor phenotype. Lineage tracing revealed oligoclonal tumor development in infancy and early selection of BRAFV600E kinase inhibitor-resistant clones. Somatic mutations were few, non-recurrent and limited to advanced tumors. Female mice developed larger tumors than males, reproducing the gender difference of human thyroid cancer. These data indicate that BRAFV600E-induced tumorigenesis is spatiotemporally regulated depending on the maturity and heterogeneity of follicles. Moreover, thyroid tissue organization seems to determine whether a BRAF-mutant lineage becomes a cancerized lineage. The TgCreERT2;BrafCA/+ sporadic thyroid cancer mouse model provides a new tool to evaluate drug therapy at different stages of tumor evolution.

Keywords: Braf mutation; Cancer; Development; Oligoclonal; Oncogenic activation; Thyroid.


Conflict of interest statement

Competing interests The authors declare no competing or financial interests.

Figures

Fig. 1.
Fig. 1.
Occurrence of papillary thyroid carcinoma (PTC) in non-induced TgCreERT2;BrafCA/+ mice devoid of tamoxifen injections. Data are from wild-type (wt) and BrafCA mutant mice at age 3-18 months (mo). Thyroid volumes were estimated from lobe diameter measurements. (A,E) Shown are in situ micrographs of frontal views of enlarged thyroids. (B) Thyroid volumes plotted over time. (C) Thyroid volume in relation to the sex plotted over time. (D) Ratio of left to right lobe – i.e. asymmetric lobe growth – plotted over time. Mean±s.d; *P<0.005; **P<0.0001. For B and D, numbers of mice were wt (n=12) and mutant (n=17) at 3 months; wt (n=16) and mutants (n=20) at 6 months; wt (n=12) and mutants (n=18) at 12 months. (F) Immunostaining for cytokeratin 19 (CK19) showing increased protein levels, consistent with raised CK19 levels observed in human PTCs. (G,H) T2-weighted MRI image (G) of the same thyroid specimen as shown in E and F (for entire stack series, see Movie 1) and apparent diffusion coefficient (ADC) color map (H) of the same image. The color bar relates to solid (red) and cystic (yellow) tumors based on the ADC (µm2/ms). cy, corresponding cystic tumor portions. Used technology delimited resolution of images. (I-K) H&E staining showing inter- and intra-tumor heterogeneity of multifocal PTCs. Images of additional tumors present in the same thyroid specimen are shown in Figs S1 and S2. Two adjacent PTC tumor foci are encircled (1 and 2) and shown in I; the boxed area in circle 1 is shown magnified in I′, indicating a transition of the tumor growth pattern. Immunostaining for NKX2-1 indicating its downregulation in the solid tumor portion, is shown in J; the parallel section of J is shown in panel l′. Nuclear characteristics of tumor cells are shown in K – magnification of a region within the first PTC tumor (circle 1) from I; the interface between lumen and stroma of the tumor tissue is indicted by dashed lines. Immunostaining for NKX2-1 (L) within the second PTC tumor shown in I (circle 2). The boxed area in L is shown magnified in L′. (M) Sketch outlining the papillary tumor growth as shown in L′. Anatomical orientation: D, dorsal; L, left; R, right; V, ventral. cl, classic variant of PTC; so, solid variant of PTC; t, trachea. Arrows indicate the tumor stalk; arrowheads indicate the follicular wall enclosing the tumor. Scale bars: 500 µm (F,I), 100 µm (I′,J,L), 50 µm (K).
Fig. 2.
Fig. 2.
Early stages of thyroid tumor development following spontaneous BrafCA activation in TgCreERT2;BrafCA/+ mutant mice. (A) Histogram showing H&E staining of heterotypic follicular abnormalities of the thyroid from a mouse aged 3 months (mo). The boxed area is shown magnified in A′. Asterisks indicate follicles with translucent interior, i.e. lack of colloid. (B-D) Quantitative assessment of changes within the thyroid in response to mutant BRAF kinase inhibition. Dietary pellets with PLX4720 were supplied daily at 417 ppm from 4 weeks onwards and until mice were killed aged 3 months; data were obtained from serial sections. The number of neoplastic follicles in untreated mutants (individual data) is plotted in B. Inhibition of thyroid enlargement (individual data; mean±s.d.; *P<0.005) is plotted in C. Heterogeneous drug response in neoplastic lesions. The mean±s.d. (*P<0.005) of (n): wt (5); untreated mutants (7), drug-treated mutants (9) is plotted in D. (E) Representative image of the thyroid from a mutant mouse aged 6 months, immunostained for thyroglobulin (TG), showing loss of TG in neoplastic lesions. Boxed areas in E are shown magnified in E′ and E′′. Asterisks in E′ and E′′ indicate follicles with altered shape and retained TG in the lumen. L, left lobe; R, right lobe. nf, normal follicle; hf, hyperplastic follicle; gf, giant follicle; arrows indicate hyperplastic epithelium; arrowheads indicate flat epithelium; wt, control wild-type (non-mutant) mice. Scale bars: 500 µm.
Fig. 3.
Fig. 3.
Diminished Cre driver expression within thyroids of TgCreERT2;BrafCA/+ mutant mice. Data were obtained from mutant mice at age 3-12 months (mo) not treated with tamoxifen. (A,B) Tissue distribution of Cre-positive and Cre-negative cells (IHC staining). Boxed areas in A and B are shown magnified in A′-A′′′ and B′-B′′, respectively. (C) Recovery of TgCreERT2 expression in mice (qPCR data) treated with PLX4720 (417 ppm; dietary pellets) at 6 months for the duration of 1 month. (Top) Thyroglobulin (Tg) transcript levels. (Bottom) Transcript levels of Era1 (in wild type) and ERT2 (in mutants). nf, normal follicles; hf, hyperplastic follicles (encircled in A′); df, dilated follicles; PTC, papillary thyroid carcinoma; tc, tumor cells; s, stroma; arrows, Cre-positive cells; arrowheads, Cre-negative cells. Scale bars: 500 µm.
Fig. 4.
Fig. 4.
Clonal tracing of mutant thyroid cells after spontaneous BrafCA activation. (A,B) X-gal staining of thyroid cells from TgCreERT2;R26R mice injected with tamoxifen (+Tam, A) or not (non-induced, B) to compare activation of the Rosa26 reporter. A′ and B′ are magnified images of labeled cells from the same specimens. Arrowheads in B′ indicate labeled cells. (C) Distribution of normal cells subjected to spontaneous mTmG activation induced by leaky Cre recombinase. (D,E) Expected outcomes when tracing the progeny of BRAF-mutant cells, depending on downregulation of the Cre driver (D) and activation of mTmG before or after that of BrafCA (E). Shown are the sequence of recombination and the corresponding labeling patterns (1-3), of which ‘1.’ represents spontaneous reporter gene activation only. Tg, thyroglobulin transcript; Cre, CreERT2 transcript. (F-H) Clonal expansion accompanying folliculogenesis in TgCreERT2;Braf CA/+;mTmG mice at postnatal days 10 and 30 (P10 and P30, respectively). Thyroid images are from representative serial sections. Pre-follicular branching parenchyma (outlined) are shown in F, with inset showing DAPI-stained nuclei of an mGFP-positive (mG+) clone. Shown in G is a nascent oligoclonal follicle (encircled), with inset showing DAPI-stained nuclei corresponding to mG+ (closed dots) and mTomato-positive (mT+) follicular cells (closed dots), and surrounding cells (open dots) including a stromal cell (white open dot). Shown in H is a hyperplastic oligoclonal follicle (encircled). For comprehensive imaging of contiguous mG+ and mT+ epithelial domains (green and red arrow, respectively), see the stack series in Fig. S5. (I) Oligoclonal microcarcinoma involving clonal cooperativity of papillary growth. The small boxed area is shown magnified in panel I′, showing mT+ (top right), mG+ (bottom left) or DAPI (bottom right) fluorescence, or merged fluorescence (top left). Arrowheads indicate planar expansion of adjacent mG+ and mT+ clones. Asterisks indicate lumen of neoplasm; arrows indicate the transition zone of mT+ and mG+ epithelial domains. (J) Sketch, representing the large boxed area in I, indicating the lamellar pattern of oligoclonal growth. Scale bars: 500 µm (A,B), 100 µm (A′,B′,C,I) and 25 µm (F-H).
Fig. 5.
Fig. 5.
Clonal selection of growth during thyroid tumorigenesis inTgCreERT2;BrafCA/+;mTmGmutant mice. All data were obtained from animals not treated with tamoxifen. (A–C) Age- and gender-dependent changes in clonal expansion of mTomato-positive (mT+) and mGFP-positive (mG+) BRAF-mutant (BrafCA) cells. Clonal growth was estimated by counting mG+ cells in serial sections of the thyroid (three levels per lobe) – at postnatal days 10 and 30 (P10 and P30, respectively) and 3, 6 and 12 months (mo) of age – in mutant mice. The percentage of mG+ cells relate to the total number of DAPI-stained epithelial cells; thus, in every measurement, 100% comprises all encountered mG- and mT-labeled follicular and tumor cells. For each time point, the accumulation of mG+ thyroid cells is compared to that of age-matched TgCreERT2;mTmG (non-mutant) mice. The spontaneous rate of reporter gene activation (blue) and clonal expansion of mT+ versus mG+ mutant cells (red) are plotted in A; mean±s.d. (*P<0.005; n=6 for each group). Equal rates of reporter gene activation in non-mutant male (red) and female (blue) thyroids are plotted in B. Gender bias of mT+ versus mG+ clonal expansion in mutant mice (red) in comparison to the accumulation of mG+ cells in non-mutant mice (blue) is plotted in C; mean±s.d. (*P<0.005; n=3 for each group in B and C). (D) Predominance of lack of versus dual clonal reporter gene activation – revealed by uniform mT+ and compound mT+mG+ labeling, respectively – in neoplastic lesions in mutant mice aged 3 months. Horizontal bars indicate the mean relative values for each labeling and the type of lesion (n, indicated in graph) in total, based on five serially sectioned thyroids. Notice that lesions composed of only mG+ cells were not observed. (E,F) Papillary carcinomas with different tumor phenotypes – i.e. classic (E) and solid variant (F) – and without any signs of reporter gene activation in the tumor cells in 6-month-old mutant mice. (G-I) Representative images of dual-labeled lesions (encircled) with distinct (G,H) or indistinct (I) growth pattern of mT+ and mG+ clones. Arrowheads indicate clone borders; green and red arrows indicate contiguous mG+ and mT+ epithelial domains, respectively. hf, hyperplastic follicle; df, dilated follicle; mic, microcarcinoma; PTC, papillary thyroid carcinoma. Scale bars: 100 µm.
Fig. 6.
Fig. 6.
Follicular distribution of BRAF-mutant thyroid cells outside tumors. All data refer to induced reporter gene activation in 6-month-old TgCreERT2;BrafCA/+;mTmG mice – to distinguish between unlabeled mutant cells and responding non-mutant cells that comprise preserved Cre activity – which already developed neoplastic lesions due to spontaneous Cre-mediated recombination. (A) Schematic, depicting experimental set-up, and morphometric quantification of responding cells that recombined mTmG. (Top) Mutant mice were injected intraperitoneally with tamoxifen (10 mg/ml; 50 µl once every day for three consecutive days followed by analysis 10 days (10 d) later. (Bottom) Numbers of mGFP-positive (mG+) cells in mutant mice treated with tamoxifen (red) or not (blue) compared with the corresponding spontaneous activation levels in age-matched control (Contr) TgCreERT2;mTmG mice (set to 100%). Analysis was for three section levels per gland; mean±s.d. Contr (n=6), untreated mutants (n=3), tamoxifen-treated mutants (n=7). (B-E) Density of mG-labeled cells within follicles of varying size and shape. Encircled area in D indicates a compacted follicle consisting of only induced, non-mutant cells; its abnormal shape likely depends on crowding from the neighboring dilated follicles. Arrowheads indicate single or clustered mG+ cells. nf, normal follicle; hf, hyperplastic follicle; df, dilated follicle; gf, giant follicle; mic, microcarcinoma. Scale bars: 100 µm.
Fig. 7.
Fig. 7.
Clonal evolution of tumor development and heterogeneity in sporadic thyroid cancer, as proposed from the presented TgCreERT2;BrafCA/+ mouse model. (A) Constraints on tumor initiation depend on cell composition of thyroid follicles. Red and green arrows indicate suggested clonal cooperativity of mutant clones (solid lines) and putative bystander inhibitory effects of oncogenic activation on non-mutant cells (dashed lines). Supernumerary non-mutant cells are likely to exert an inhibitory action on single mutant cells, preventing oncogenic transformation and tumor initiation (inhibitory arrows). (B) Three scenarios of restricted or promoted neoplastic growth depending on spatiotemporal onset of oncogenic activation related to follicle maturity. The three scenarios are based on timing and coincidence of two independent oncogenic mutant clones (depicted in red and green). (C) Spatial factors related to natural follicle heterogeneity can influence BRAFV600E-induced tumor development and, ultimately, the PTC tumor phenotype. Clonal selection of growth is an early event in tumorigenesis. Tumor progression to overt cancer is likely to involve additional clonal and subclonal alterations. See Discussion for further comments.

Similar articles

Cited by

References

    1. Afkhami, M., Karunamurthy, A., Chiosea, S., Nikiforova, M. N., Seethala, R., Nikiforov, Y. E. and Coyne, C. (2016). Histopathologic and clinical characterization of thyroid tumors carrying the BRAF(K601E) mutation. Thyroid 26, 242-247. 10.1089/thy.2015.0227 - DOI - PubMed
    1. Antico-Arciuch, V. G., Dima, M., Liao, X.-H., Refetoff, S. and Di Cristofano, A. (2010). Cross-talk between PI3K and estrogen in the mouse thyroid predisposes to the development of follicular carcinomas with a higher incidence in females. Oncogene 29, 5678-5686. 10.1038/onc.2010.308 - DOI - PMC - PubMed
    1. Baker, A.-M., Huang, W., Wang, X.-M. M., Jansen, M., Ma, X.-J., Kim, J., Anderson, C. M., Wu, X., Pan, L., Su, N.et al. (2017). Robust RNA-based in situ mutation detection delineates colorectal cancer subclonal evolution. Nat. Commun. 8, 1998. 10.1038/s41467-017-02295-5 - DOI - PMC - PubMed
    1. Bissell, M. J. and Hines, W. C. (2011). Why don't we get more cancer? A proposed role of the microenvironment in restraining cancer progression. Nat. Med. 17, 320-329. 10.1038/nm.2328 - DOI - PMC - PubMed
    1. Bowling, S., Lawlor, K. and Rodriguez, T. A. (2019). Cell competition: the winners and losers of fitness selection. Development 146, dev167486. 10.1242/dev.167486 - DOI - PubMed

Publication types

Substances