. 2021 Aug 11;15(8):e0009660.
doi: 10.1371/journal.pntd.0009660. eCollection 2021 Aug.

Assessing early child development and its association with stunting and schistosome infections in rural Zimbabwean children using the Griffiths Scales of Child Development

Affiliations

Assessing early child development and its association with stunting and schistosome infections in rural Zimbabwean children using the Griffiths Scales of Child Development

Francisca Mutapi et al. PLoS Negl Trop Dis. .

Abstract

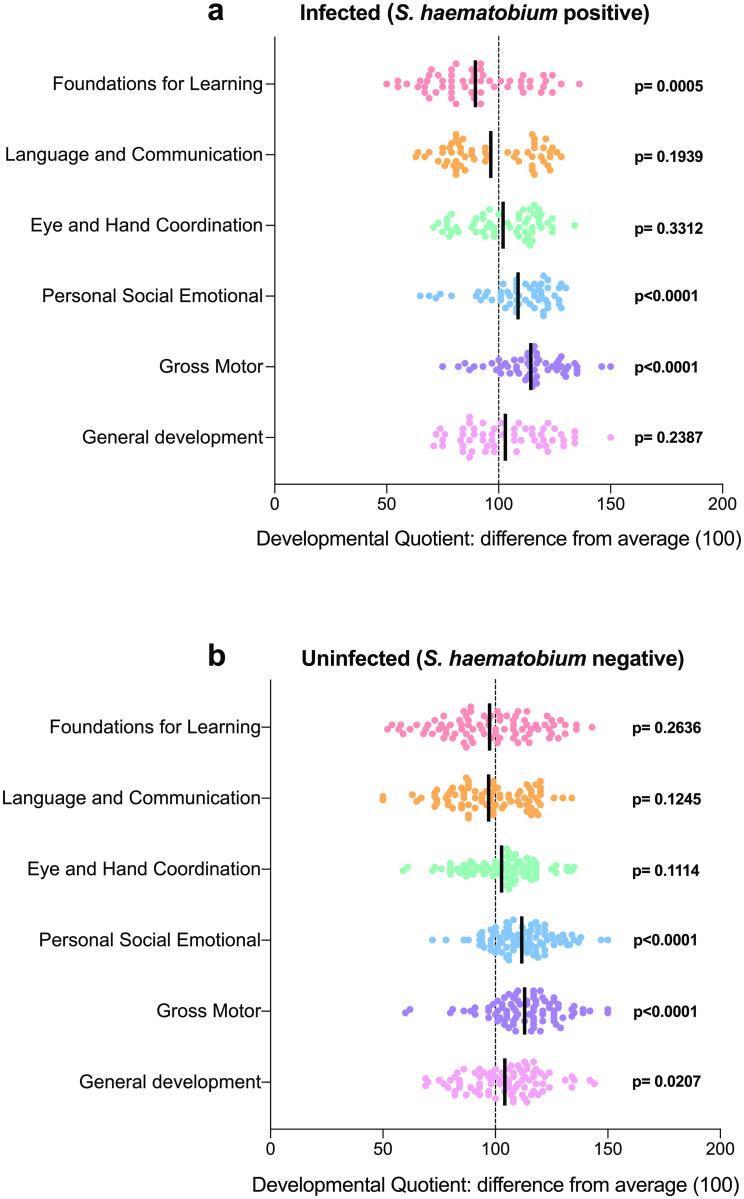
There is a paucity of reference early childhood development (ECD) data at community level in rural Africa. Our objective was to conduct a comprehensive assessment of ECD in rural Zimbabwe and determine the impact of stunting and schistosome infections on ECD. Using the Griffiths Scales of Child Development, we conducted a cross sectional assessment of Eye and Hand Coordination (EHC), Personal-Social-Emotional (PSE), Language and Communication (LC), Foundations of Learning (FL) and Gross Motor (GM) domains and the summary General Development (GD) in 166 children aged 6-72 months. The effects of stunting, malnutrition and Schistosoma haematobium infection on ECD was determined. The impact of praziquantel curative treatment of schistosome infection on the developmental scores was determined through a longitudinal follow up at 6 and 12 months. From an initial 166 children, 11 were found to have developmental deficits warranting further investigation. Of the remaining 155, 58.7% recorded a good (≥ average) score for the overall General Development (GD). Proportions of children scoring above the cut-off (≥ average) for each domain were GM (84.5%), PSE (80.6%), EHC (61.9%), FL (43.9%) and LC (44.5%). The prevalence of stunting was 26.8% (95% CI = 20.1%-34.8%) Scores for stunted children were significantly lower for EHC (p = 0.0042), GM (p = 0.0099), and GD (p = 0.0014) with the fraction of lower scores attributable to stunting being GM = 63.4%, GD = 46.6%, EHC = 45%, and LC = 21%. S. haematobium infection prevalence was 39.7% and mean infection intensity was 5.4 eggs/10 ml urine. Infected children had poorer cognitive performance scores for the FL (p = 0.0005) with 30.8% of poor FL attributable to the infection. Performance in all domains improved to the expected normal or above reference levels at 6 and 12 months post curative treatment of schistosome infections. Our study documented reference values for ECD in rural Zimbabwean children. The study detected deficiencies in the FL domain, which were more pronounced in children, infected with schistosomes, highlighting the need for provision of cognitive stimulation tools and access to early childhood foundation education. There is also need for improved child nutrition and treatment of schistosome infections to improve child development outcomes.


Conflict of interest statement

The authors have declared that no competing interests exist.

Figures

Fig 1
Fig 1. Difference between the developmental and chronological/actual ages for the six subscales.
Dotted line represents children performing as expected for their chronological age as per Griffiths test, i.e. the difference between the chronical and developmental age performance. P-values indicate statistical tests comparing the difference between the mean developmental age as indicated by the Griffiths test performance and the mean chronological age. Solid lines = mean.
Fig 2
Fig 2. Scatterplot comparing the mean of developmental quotient (DQ) scores to the expected mean reference average for the six subscales.
Graph shows baseline DQ scores for a) children positive for S. haematobium infection, and b) children negative for S. haematobium infection. Dotted lines represent the mean reference average for DQ (100) [19]. p-values indicate statistical tests for the scores of the children compared to the reference mean of 100. Solid lines = mean.
Fig 3
Fig 3. Estimated proportion of poor cognitive performance (based on development quotient) attributable to S. haematobium infection.
AFe = Attributable fraction in the infected population, AFp = attributable fraction in the total population. Attributable fractions were estimated for indices with PR >1.
Fig 4
Fig 4. Six- and 12-month time course of developmental quotient (DQ) scores for treated S. haematobium positive children.
Scatterplots show DQ scores for a) children positive and treated for S. haematobium infection at baseline (n = 29), b) children present at S1 survey (6 months later) and tested negative for S. haematobium infection (n = 29), and c) children present at S2 survey (12 months later) who remained negative for S. haematobium infection (n = 18). Dotted lines represent the mean reference average for DQ (100). p-values indicate statistical tests for either a one sample t-test or Wilcoxon sign test (based on normality) comparing to the hypothetical mean of 100. Solid lines = mean.
Fig 5
Fig 5. Six- and 12-month time course of developmental quotient (DQ) scores for untreated/uninfected children.
Scatterplots show DQ scores for a) children negative for S. haematobium infection at baseline (n = 50), b) children present at S1 survey (6 months later) and remained negative for S. haematobium infection (n = 50), and c) children present at S2 survey (12 months later) who remained negative for S. haematobium infection (n = 29). Dotted lines represent the mean reference average for DQ (100). p-values indicate statistical tests for either a one sample t-test or Wilcoxon sign test (based on normality) comparing to the hypothetical mean of 100. Solid lines = mean.
Fig 6
Fig 6. Estimated proportion of poor cognitive performance (based on development quotient) attributable to stunting.
AFe = Attributable fraction in the stunted population, AFp = attributable fraction in the total population. Attributable fractions were estimated for indices with PR >1.

References

    1. Marume A, Mafaune P, Maradzika J, January J. Evaluation of the child growth monitoring programme in a rural district in Zimbabwe. Early Child Development and Care. 2017;189. doi: 10.1080/03004430.2017.1344653 - DOI - PMC - PubMed
    1. Milbrath G, Constance C, Ogendi A, Plews-Ogan J. Comparing Two Early Child Development Assessment Tools in Rural Limpopo, South Africa. BMC Pediatrics. 2020;20(1):197. doi: 10.1186/s12887-020-02101-0 - DOI - PMC - PubMed
    1. Lu C, Cuartas J, Fink G, McCoy D, Liu K, Li Z, et al.. Inequalities in early childhood care and development in low/middle-income countries: 2010–2018. BMJ Glob Health. 2020;5(2):e002314. Epub 2020/03/07. doi: 10.1136/bmjgh-2020-002314. - DOI - PMC - PubMed
    1. Blouin B, Casapia M, Joseph L, Gyorkos TW. A longitudinal cohort study of soil-transmitted helminth infections during the second year of life and associations with reduced long-term cognitive and verbal abilities. PLoS Negl Trop Dis. 2018;12(7):e0006688. doi: 10.1371/journal.pntd.0006688. - DOI - PMC - PubMed
    1. Pabalan N, Singian E, Tabangay L, Jarjanazi H, Boivin MJ, Ezeamama AE. Soil-transmitted helminth infection, loss of education and cognitive impairment in school-aged children: A systematic review and meta-analysis. PLoS Negl Trop Dis. 2018;12(1):e0005523. Epub 2018/01/13. doi: 10.1371/journal.pntd.0005523. - DOI - PMC - PubMed