. 2021 Aug 11;15(8):e0009562.
doi: 10.1371/journal.pntd.0009562. eCollection 2021 Aug.

Case-area targeted interventions (CATI) for reactive dengue control: Modelling effectiveness of vector control and prophylactic drugs in Singapore

Affiliations

Case-area targeted interventions (CATI) for reactive dengue control: Modelling effectiveness of vector control and prophylactic drugs in Singapore

Oliver J Brady et al. PLoS Negl Trop Dis. .

Abstract

Background: Targeting interventions to areas that have recently experienced cases of disease is one strategy to contain outbreaks of infectious disease. Such case-area targeted interventions (CATI) have become an increasingly popular approach for dengue control but there is little evidence to suggest how precisely targeted or how recent cases need to be, to mount an effective response. The growing interest in the development of prophylactic and therapeutic drugs for dengue has also given new relevance for CATI strategies to interrupt transmission or deliver early treatment.

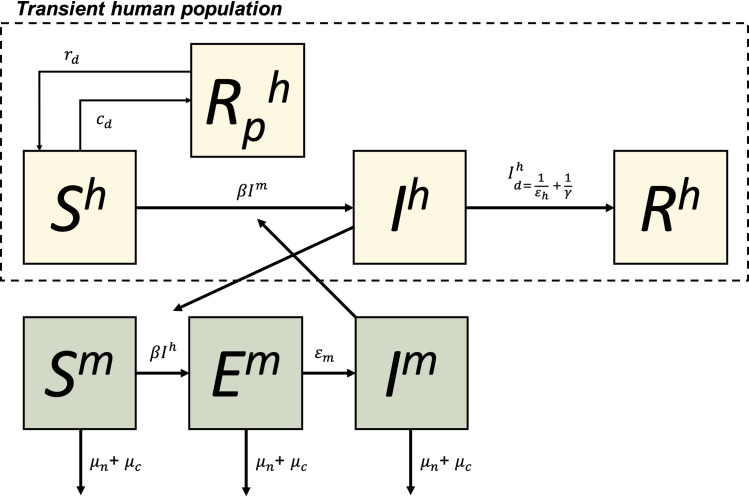
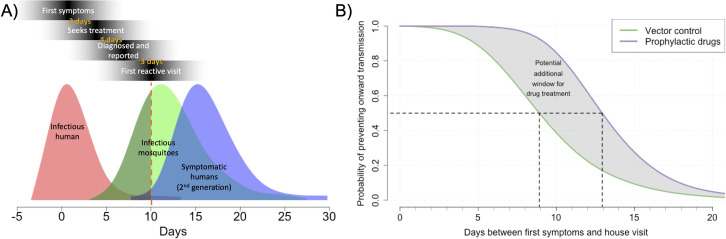
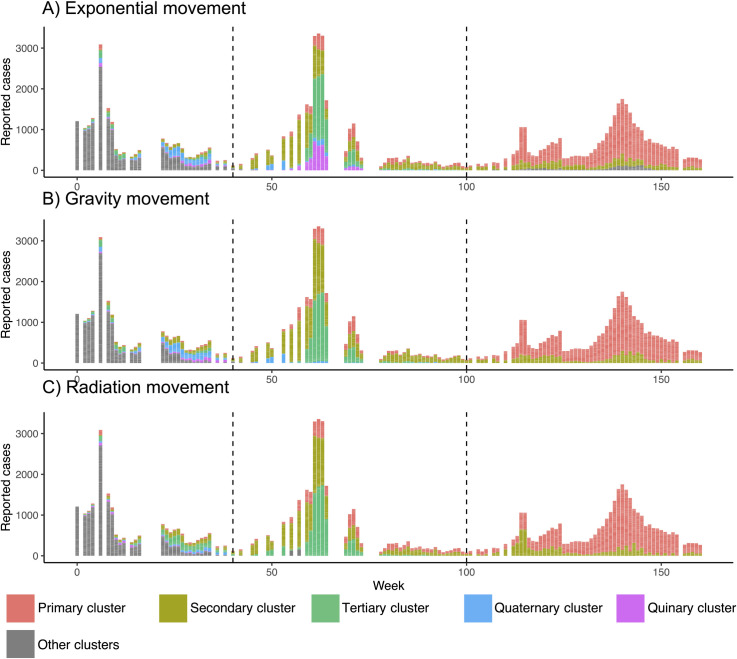
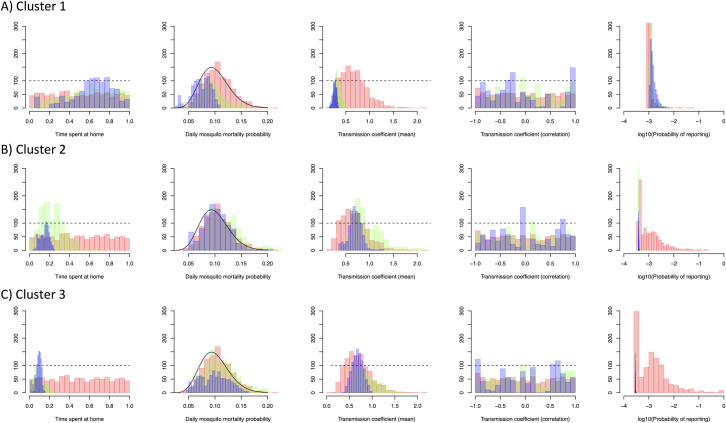
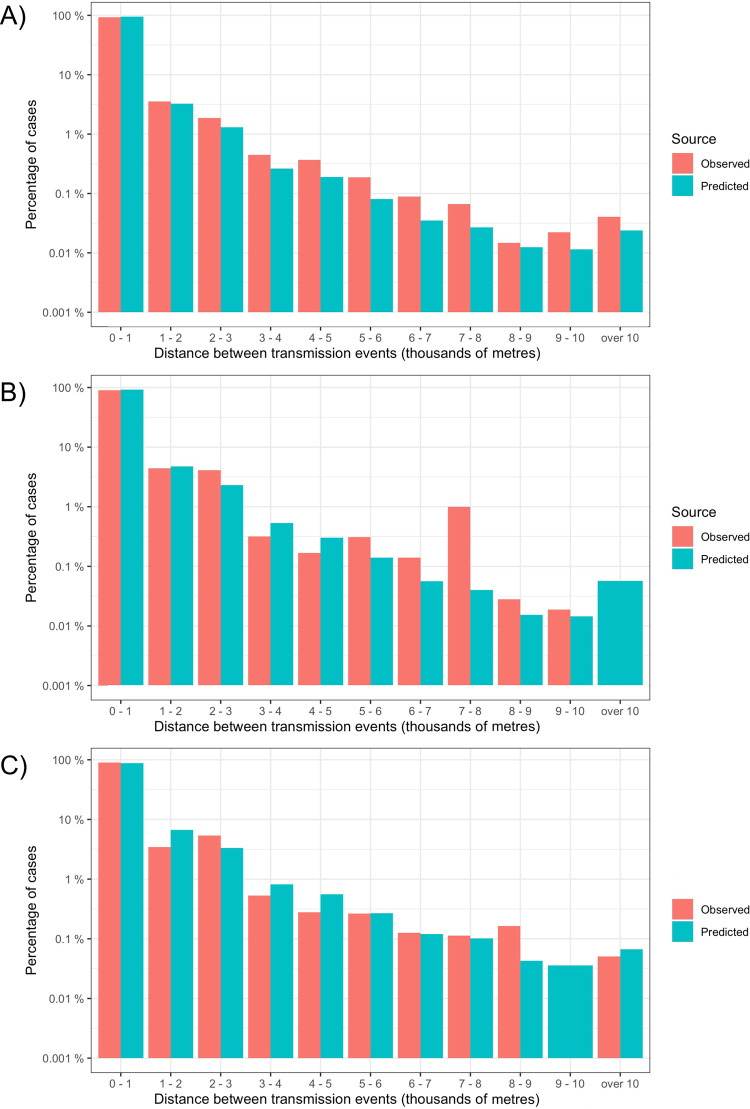
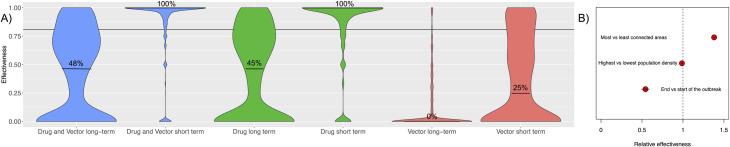
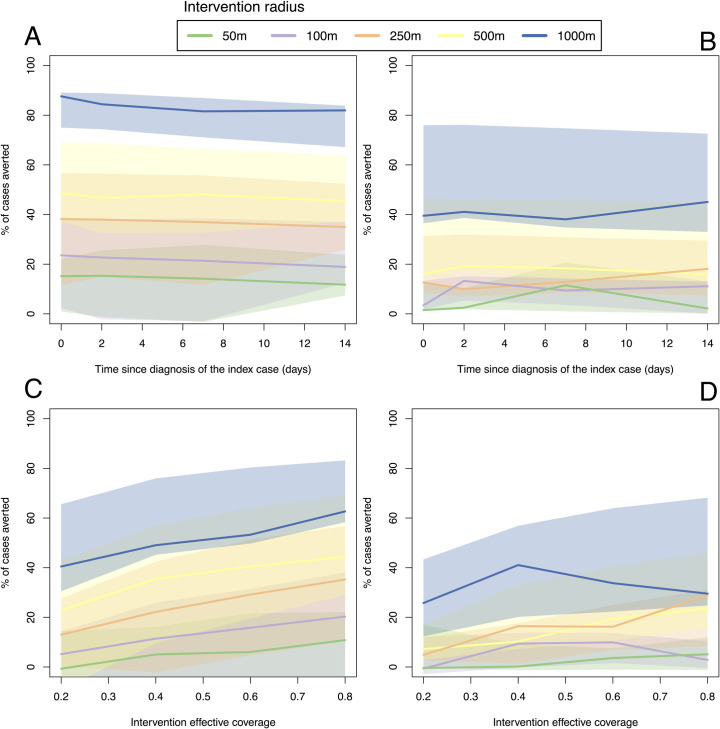
Methods/principal findings: Here we develop a patch-based mathematical model of spatial dengue spread and fit it to spatiotemporal datasets from Singapore. Simulations from this model suggest CATI strategies could be effective, particularly if used in lower density areas. To maximise effectiveness, increasing the size of the radius around an index case should be prioritised even if it results in delays in the intervention being applied. This is partially because large intervention radii ensure individuals receive multiple and regular rounds of drug dosing or vector control, and thus boost overall coverage. Given equivalent efficacy, CATIs using prophylactic drugs are predicted to be more effective than adult mosquito-killing vector control methods and may even offer the possibility of interrupting individual chains of transmission if rapidly deployed. CATI strategies quickly lose their effectiveness if baseline transmission increases or case detection rates fall.

Conclusions/significance: These results suggest CATI strategies can play an important role in dengue control but are likely to be most relevant for low transmission areas where high coverage of other non-reactive interventions already exists. Controlled field trials are needed to assess the field efficacy and practical constraints of large operational CATI strategies.


Conflict of interest statement

I have read the journal’s policy and the authors of this manuscript have the following competing interests: MVL, GHT and JM are employees of Johnson & Johnson. LS and LN are employees of the Singapore national Environment Agency

Figures

Fig 1
Fig 1. Mathematical model structure for each patch.
Humans (h) and mosquitoes (m) are divided into susceptible (S), exposed (Mosquito-only, E), Infectious (I) and recovered and immune (R) compartments. Humans can become temporarily immune (Rp) if treated with prophylactic drugs with effective coverage rate rd with protection waning at rate cd. Infection is controlled by a mosquito-human contact rate (β) after which humans and mosquitoes go through an incubation period (at rates εh and εm respectively). Humans then naturally recover after 1/γ days of illness while mosquitoes stay infectious for life. Mosquitoes die at a natural death rate μn but can also be subject to an additional focal control mortality rate μc. All human population compartments are transient and made up of all individuals who spend time in the patch. Mosquitoes do not move between patches.
Fig 2
Fig 2. Probability of interrupting a single chain of transmission over time.
A) the probability distribution of infectious humans, the mosquitoes they infect and the subsequent human dengue cases. The red dotted line shows a typical reactive delay. Day 0 is the day of first symptoms due to dengue. B) Probability of interrupting transmission over different delay durations. Black dotted lines show the time when there is a 50% chance of interrupting transmission.
Fig 3
Fig 3
Top three identified case clusters according to exponential (A), gravity (B) and radiation (C) human movement models. Week 0 is May 2013. Only top 5 clusters shown. Dotted lines indicate the beginning of the 2014 and 2015 outbreaks.
Fig 4
Fig 4
Histograms of the distribution of each model parameter using the best fitting human movement model (exponential for cluster 1, gravity for clusters 2 and 3) over successive sequential Monte Carlo rounds (Red = round 1, Green = round 2, Blue = Round 3). Probability of reporting is on a logarithmic scale (base 10).
Fig 5
Fig 5. Comparison of the spatial transmission kernels of observed cluster data and model predictions.
These histograms show the observed and model predicted distances between detected cases in the current week and cases two weeks (approximately one serial interval) ahead. Case distances are calculated as Euclidian distance to nearest neighbour with case location assigned to the midpoint of a 1km x 1km grid. Model predictions show the median of 10 runs from the best fitting human movement model (gravity for A and B, exponential for C). Number of cases shown on a log10 scale for cluster 1 (A), 2 (B) and 3 (C).
Fig 6
Fig 6. Within patch effectiveness of case-area targeted interventions.
A) Effectiveness compares proportion of symptomatic cases in areas treated with prophylactic drugs and adult vector control over the short (30 day) and long (365 day) time periods. Both drugs and vector control are predicted to have 81% effective coverage (solid horizontal line) deployed the day after index case detection within a 1km radius of the index case, maintaining efficacy for 30 days. B) Relative effectiveness between the highest and lowest value pixels with respect to three characteristics (as predicted by a multivariate model fit to the long-term drug effectiveness results).
Fig 7
Fig 7
Scale, speed (A and B) and intervention effective coverage (C and D) required for a case-area targeted strategies with drugs (A and C) and vector control (B and D).
Fig 8
Fig 8. Effectiveness of CATI strategies in higher endemicity settings.
All values proportional to Singapore parameters (βμ and δ). Assumes drug CATI strategy with 1km radius delivered the day of detection with 81% effective coverage lasting 30 days per response over a 1-year time horizon.

References

    1. Bhatt S, Gething PW, Brady OJ, Messina JP, Farlow AW, Moyes CL, et al.. The global distribution and burden of dengue. Nature. 2013;496: 504–507. doi: 10.1038/nature12060 - DOI - PMC - PubMed
    1. Stanaway JD, Shepard DS, Undurraga EA, Halasa YA, Coffeng LE, Brady OJ, et al.. The global burden of dengue: an analysis from the Global Burden of Disease Study 2013. Lancet Infect Dis. 2016;3099: 1–12. doi: 10.1016/S1473-3099(16)00026-8 - DOI - PMC - PubMed
    1. World Health Organization. Dengue guidelines for diagnosis, treatment, prevention and control: new edition. 2009. - PubMed
    1. Sim S, Ng LC, Lindsay SW, Wilson AL. A greener vision for vector control: The example of the Singapore dengue control programme. Kittayapong P, editor. PLoS Negl Trop Dis. 2020;14: e0008428. doi: 10.1371/journal.pntd.0008428 - DOI - PMC - PubMed
    1. Anders KL, Nga LH, Van Thuy NT, Van Ngoc T, Tam CT, Tai LTH, et al.. Households as Foci for Dengue Transmission in Highly Urban Vietnam. PLoS Negl Trop Dis. 2015;9: e0003528. doi: 10.1371/journal.pntd.0003528 - DOI - PMC - PubMed

Publication types