. 2021 Sep 2;81(17):3542-3559.e11.
doi: 10.1016/j.molcel.2021.07.010. Epub 2021 Aug 10.

FACT is recruited to the +1 nucleosome of transcribed genes and spreads in a Chd1-dependent manner

Affiliations

FACT is recruited to the +1 nucleosome of transcribed genes and spreads in a Chd1-dependent manner

Célia Jeronimo et al. Mol Cell. .

Abstract

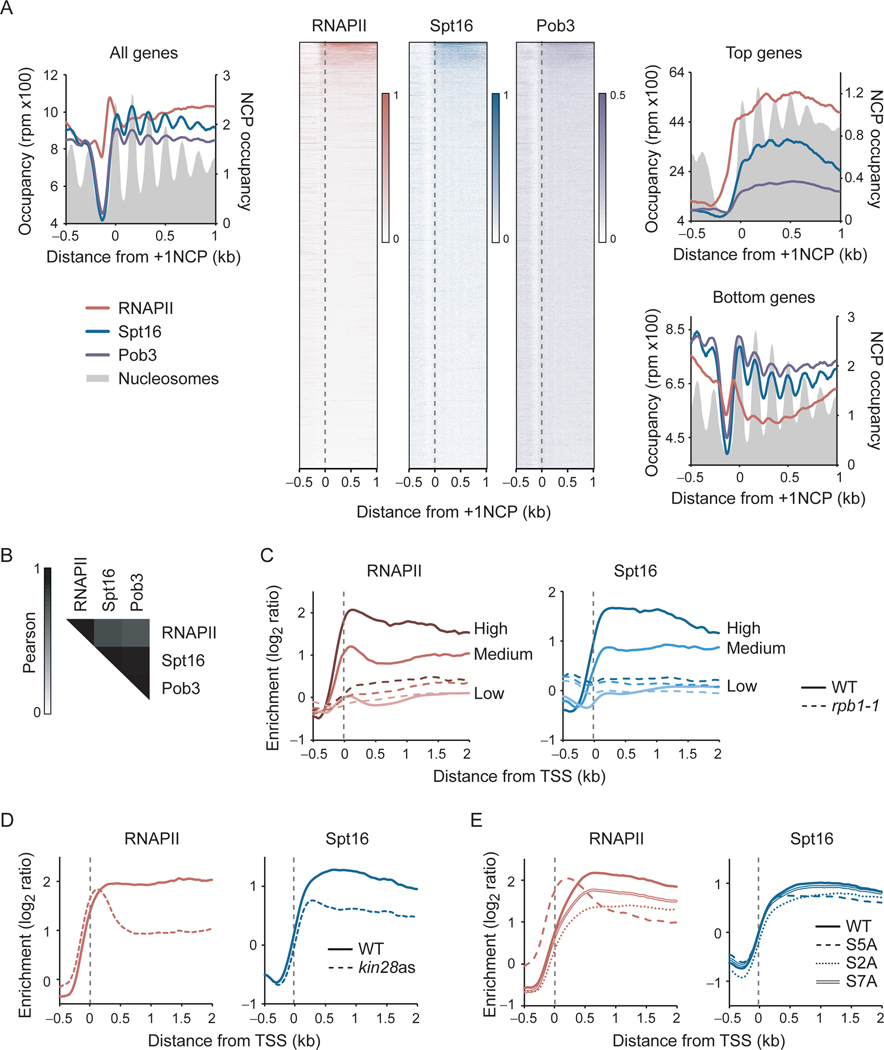
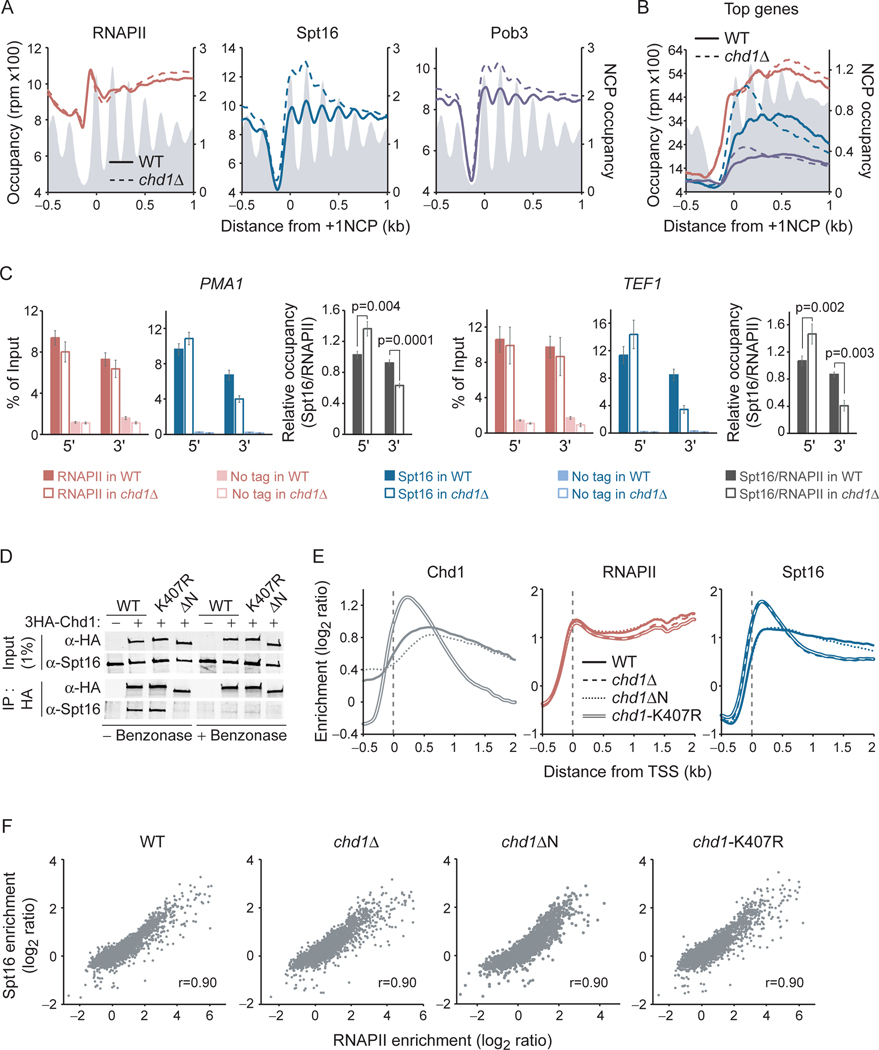
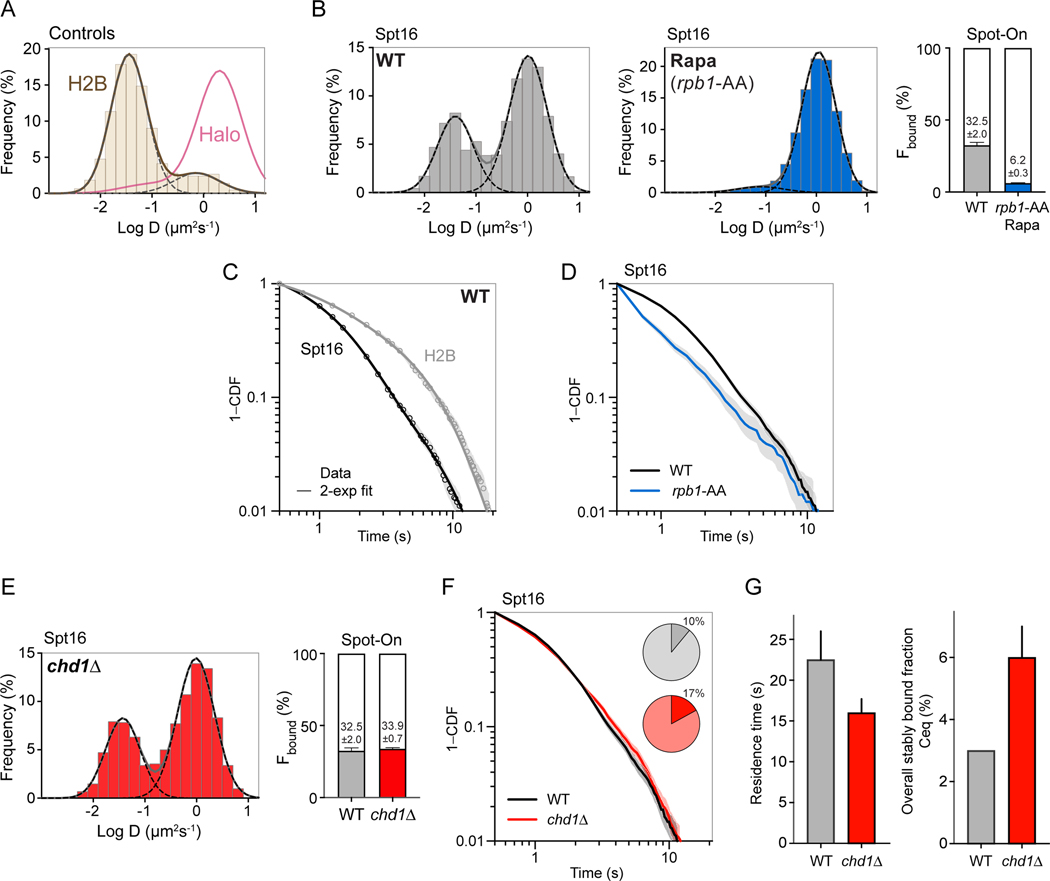
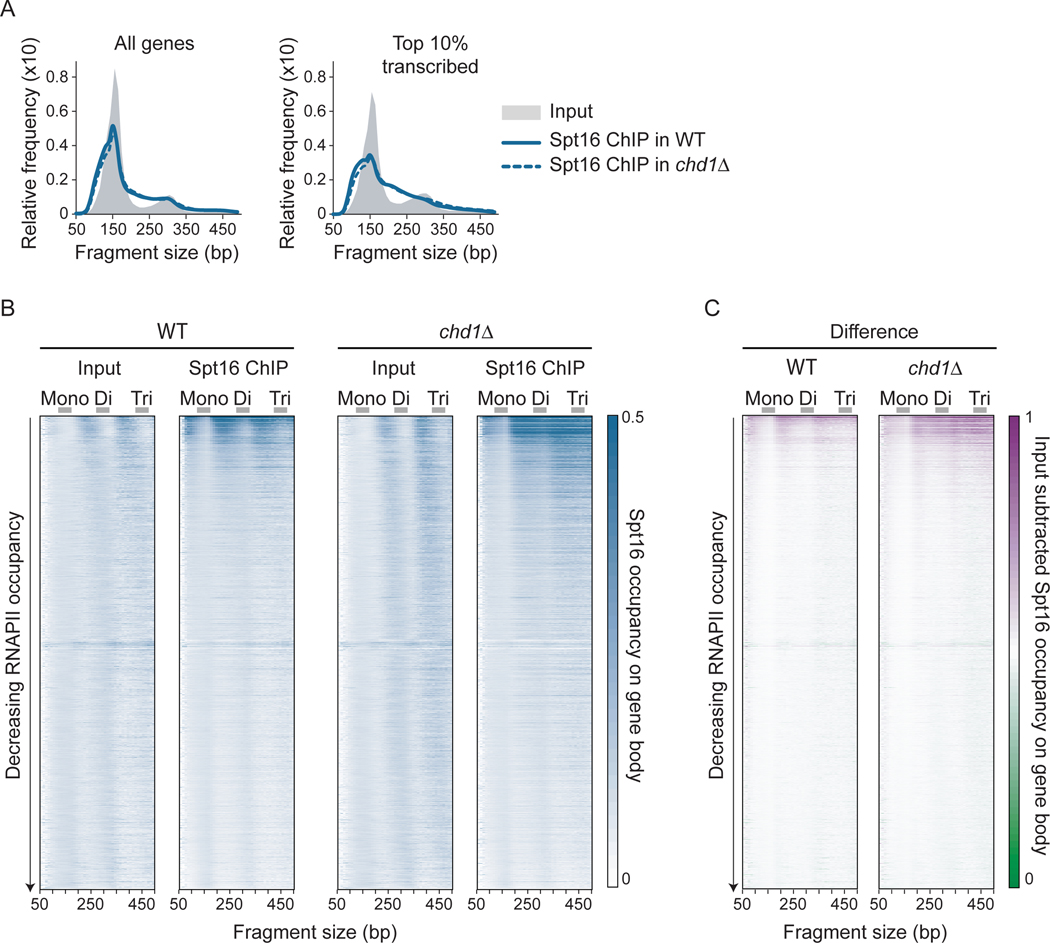
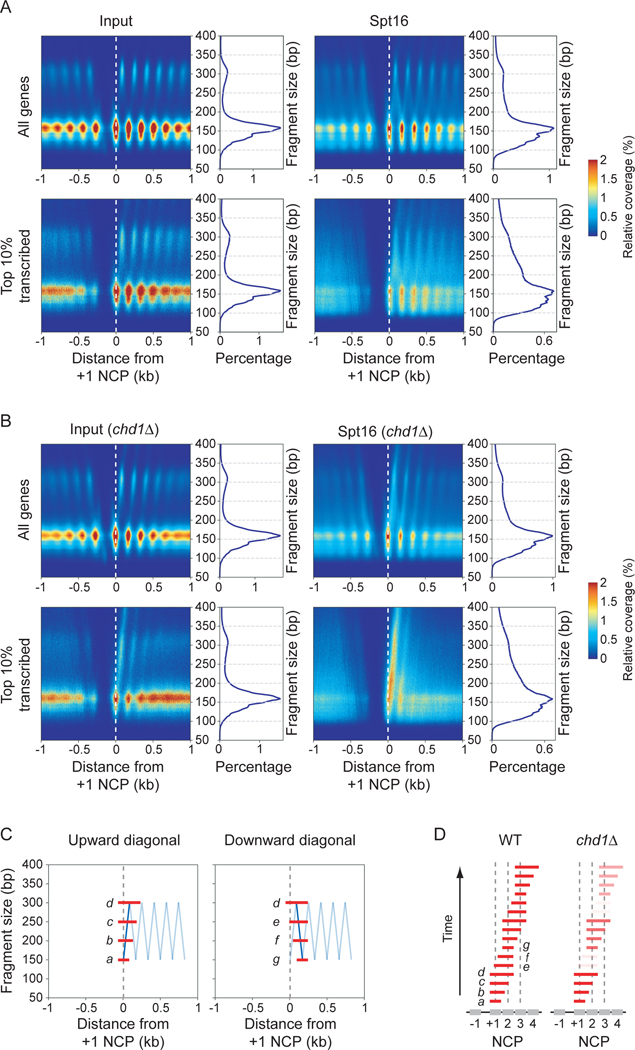
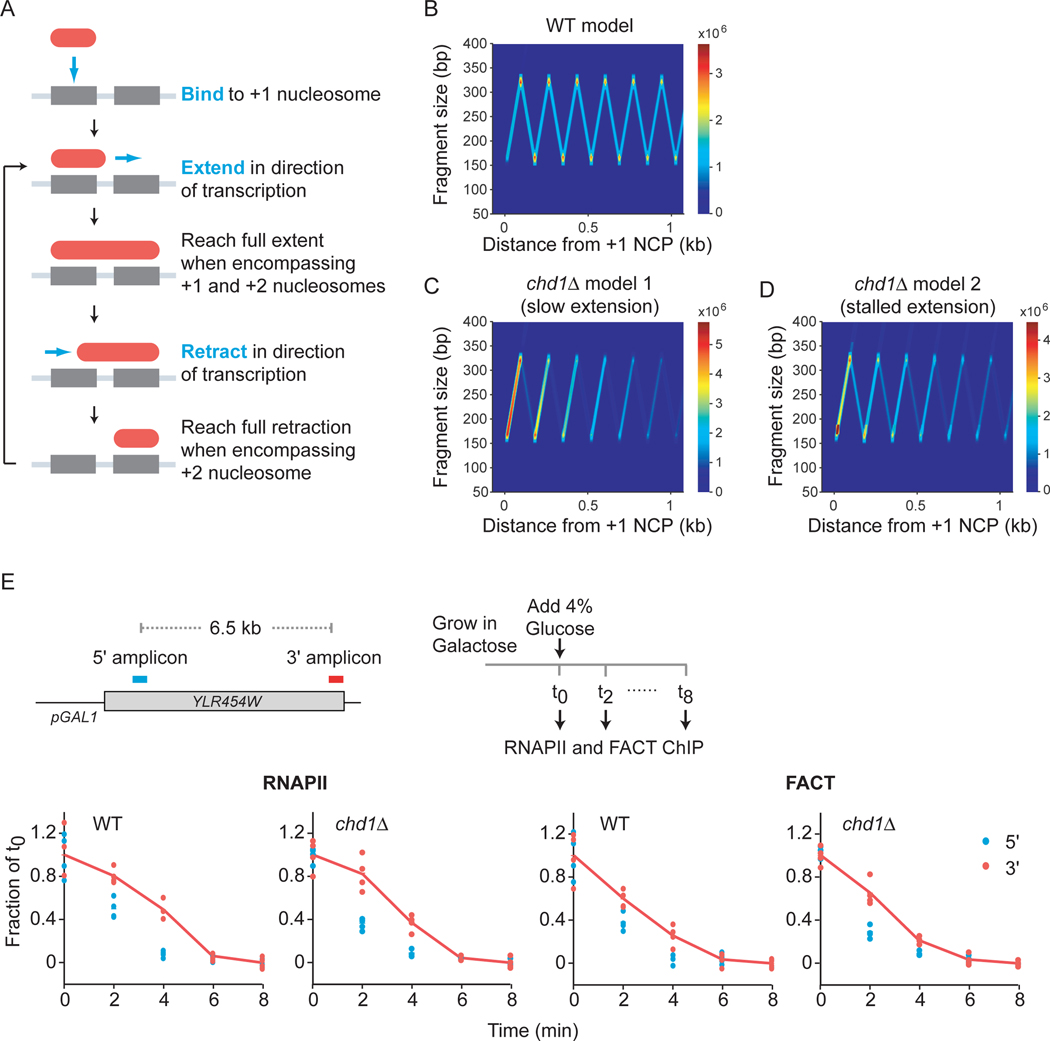
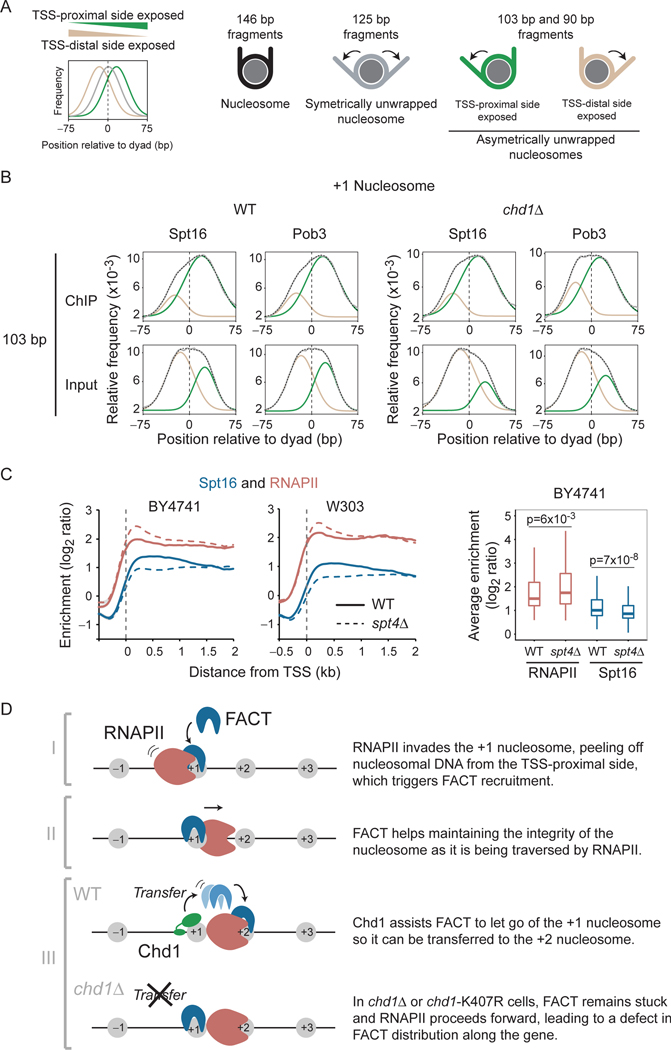
The histone chaperone FACT occupies transcribed regions where it plays prominent roles in maintaining chromatin integrity and preserving epigenetic information. How it is targeted to transcribed regions, however, remains unclear. Proposed models include docking on the RNA polymerase II (RNAPII) C-terminal domain (CTD), recruitment by elongation factors, recognition of modified histone tails, and binding partially disassembled nucleosomes. Here, we systematically test these and other scenarios in Saccharomyces cerevisiae and find that FACT binds transcribed chromatin, not RNAPII. Through a combination of high-resolution genome-wide mapping, single-molecule tracking, and mathematical modeling, we propose that FACT recognizes the +1 nucleosome, as it is partially unwrapped by the engaging RNAPII, and spreads to downstream nucleosomes aided by the chromatin remodeler Chd1. Our work clarifies how FACT interacts with genes, suggests a processive mechanism for FACT function, and provides a framework to further dissect the molecular mechanisms of transcription-coupled histone chaperoning.

Keywords: Chd1; FACT; Pob3; RNA polymerase II; Spt16; chromatin remodeling; histone chaperone; mathematical modeling; nucleosome unwrapping; single-molecule tracking.


Conflict of interest statement

Declaration of interests The authors declare no competing interests.

Figures

Figure 1:
Figure 1:
FACT occupies actively transcribed regions and is recruited after initiation in a CTD phosphorylation-independent manner. A) Metagene and heatmap representations of RNAPII (Rpb3) and both FACT subunits (Spt16, Pob3) occupancy (reads per million (rpm)), as determined by ChIP-exo, in WT cells. Metagenes for all (n = 5,456), the most transcribed (Top genes; n = 264) and the least transcribed (Bottom genes; n = 2,792) genes are shown. The average enrichment level of nucleosomes (Jiang and Pugh, 2009) is shown in grey. Genes in the heatmaps were ordered by decreasing RNAPII occupancy (n = 5,456). Data are aligned on the dyad position of +1 nucleosomes, as determined in (Chereji et al., 2018). B) Pearson correlation matrix of RNAPII, Spt16 and Pob3 occupancy, as determined by ChIP-exo. Pearson correlations were calculated using all of the data points covering ORFs that are longer than 1 kb (n = 3,503). C) Metagenes of RNAPII and Spt16 occupancy over highly (n = 85), mildly (n = 190) and lowly (n = 3,241) transcribed genes, as determined by ChIP-chip, relative to Input, in WT and rpb1–1 cells after an 80 min heat-shock at 37°C. D) Metagenes of RNAPII and Spt16 occupancy over transcribed genes (n = 275), as determined by ChIP-chip, relative to Input, in WT and kin28 ATP analog-sensitive (kin28as) cells, both treated 15 min with 1NAPP1. E) Metagenes of RNAPII and Spt16 occupancy over transcribed genes (n = 355), as determined by ChIP-chip, relative to Input, in cells ectopically expressing the indicated CTD versions of RPB1 following nuclear depletion of the endogenous Rpb1 protein by anchor-away. Data for RNAPII in panels D and E (except for the S2A mutant) are from (Jeronimo and Robert, 2014). NCP, nucleosome core particle. TSS, transcription start site. See also Figure S1.
Figure 2:
Figure 2:
FACT, but not RNAPII, accumulates at 5’ nucleosomes in CHD1 mutants. A) Metagene representation of RNAPII (Rpb3) and FACT (Spt16, Pob3) occupancy over genes (n = 5,456), as determined by ChIP-exo, in WT and chd1Δ cells. The average enrichment level of nucleosomes (Jiang and Pugh, 2009) is shown in grey. Data are aligned on the dyad position of +1 nucleosomes (Chereji et al., 2018). B) Same as panel A but for the 10% most transcribed genes, as determined by RNAPII ChIPexo (n = 264). C) RNAPII (Rpb3–3Flag), FACT (Spt16–6HA) and RNAPII-normalized FACT occupancy over the 5’ and 3’ regions of the PMA1 and TEF1 ORFs, as determined by ChIP-qPCR, in WT and chd1Δ cells. Error bars represent standard deviation from four biological replicates. P values are from Student’s ttest. D) Co-immunoprecipitation experiments of Spt16 and Chd1 in WT, chd1-K407R and chd1ΔN cells expressing an HA-tagged version of Chd1. Western blots representative of four biological replicates. E) Metagene representation of Chd1, RNAPII, and Spt16 occupancy over transcribed genes (n = 295), as determined by ChIP-chip, relative to Input, in WT, chd1Δ, chd1ΔN and chd1-K407R cells. F) Scatter plots of the ORFs occupancy (n = 5,817) of Spt16 versus RNAPII in WT, chd1Δ, chd1ΔN and chd1-K407R cells. See also Figure S2.
Figure 3:
Figure 3:
Single-molecule tracking revealed live-cell dynamics of FACT. A) Diffusion coefficient (D) histograms and corresponding two-Gaussian fits for biological controls, Halo-H2B (brown) and nucleus-localized HaloTag (pink, only fit shown). The majority of histone H2B molecules comprise a “chromatin-bound” population with low average diffusivity, whereas nuclear HaloTag molecules display predominantly fast, “chromatin-free” population. B) Fast-tracking results for Spt16-Halo in WT (grey) and in rpb1-AA cells treated with rapamycin (blue) (DMSO control shown in Figure S3C). (Left) Normalized histograms of log10D of single trajectories and corresponding two-Gaussian fits (solid grey line: sum of two Gaussians; dashed lines: individual Gaussian curves representing chromatin-bound and free subpopulations). The histograms represent combined data from two biological replicates. (Right) Chromatin-bound fractions from Spot-On kinetic modeling of single displacements. Error bars represent standard deviations from two biological replicates. C) Log-log survival-probability curves (1-CDF) for Spt16-Halo (black) and Halo-H2B (grey) from apparent dwell times of single-molecule chromatin-binding events captured by slow-tracking. Data from two biological replicates (circles, with grey shades representing 95% confidence intervals obtained by bootstrapping) were fitted with a doubleexponential decay function (solid lines). D) Log-log survival-probability curves for Spt16-Halo from WT (black) and rpb1-AA (blue) cells, treated with rapamycin (DMSO control shown in Figure S3D). The data (solid lines) are from two biological replicates, with 95% confident intervals shown as grey shades. E) Fast-tracking results for Spt16-Halo in chd1Δ cells (red). See legend of Panel B for details. F) Log-log survival-probability curves for Spt16 from WT (black) and chd1Δ (red) cells from apparent dwell times of single-molecule chromatin-binding events. The data are from two biological replicates. 95% confident intervals are shown as grey shades. Embedded pie charts show the relative fractions of stable and transient binding events, with values for the former indicated. G) Corrected residence times (τsb, left panel) and global fractions (Ceq, right panel) of stable chromatin binding by FACT in WT and chd1Δ cells. Error bars for the residence times are standard deviations of time-lapse results. Ceq errors were propagated using Fb and fsb errors. Ceq result for WT had negligible ~0 error. Errors for τsb H2B and free Halo data are from (Kim et al., 2021). D, diffusion coefficient; CDF, cumulative distribution function; Rapa, rapamycin; Ceq, overall fraction of stably-bound molecules. See also Figure S3.
Figure 4:
Figure 4:
FACT binds disorganized nucleosomal particles on transcribed genes. A) Distribution plots of the size of DNA fragments recovered from Input and FACT (Spt16) MNase-ChIP-seq samples from WT and chd1Δ cells for all (n = 5,796) and the top 10% transcribed (n = 580) genes. B-C) Heatmaps representation of Input and Spt16 average occupancy (rpm) (B) and of Input-subtracted Spt16 average occupancy (rpm) (C) on gene body (n = 5,796, sorted by decreasing RNAPII occupancy on the y-axis) from WT and chd1Δ cells, as determined by MNase-ChIP-seq, computed with DNA fragments from different sizes (x-axis). Mono-, di- and tri-nucleosome-sized DNA fragments are indicated. See also Figure S4.
Figure 5:
Figure 5:
FACT spreads inside the gene body from the +1 nucleosome in a Chd1-dependent manner. A) 2DO plots of the coverage of the sequenced fragment mid-points (nucleosome dyads) in Input and FACT (Spt16) ChIP from MNase-digested chromatin from WT cells, relative to the +1 nucleosome dyads, on all (n = 5,796) and on the most transcribed (n = 580) genes. On the right of each heatmap is the distribution of the fragment sizes. B) Same as panel A but for chd1Δ cells. C) A graphical representation of the fragments aligning on the inverted-v’s observed in 2DO plots from FACT ChIP samples. The blue diagonal lines highlight the upward and downward trajectories of the fragment mid-points and the red bars depict examples of fragments at different positions along the upward (fragments “a” through “d” ) and the downward (fragments “d” through “g”) diagonals. D) A working model for FACT spreading down a gene based on the MNase-ChIP-seq data in WT and chd1Δ cells from panel A. Fragments are considered as different snapshots of a dynamic process (y-axis speculatively denoted as “Time”) and were ordered as they appear when walking through the inverted-v zig-zag. Note the under-represented fragments and the progressive loss of signal in chd1Δ. See also Figure S5.
Figure 6:
Figure 6:
Mathematical modeling supports FACT binding at the +1 nucleosome and traversing the gene with an “inchworm” mechanism and suggests mechanisms for Chd1-dependent spreading. A) Schematic of the inchworm mechanism. B) Simulated protected fragment sizes and locations from the WT model. C) Simulated protected fragment sizes and locations for the same model as in panel A but with a reduced rate of extension and increase unbinding (chd1Δ model 1). D) Simulated protected fragment sizes and locations for the same model as in panel A but with increase unbinding and adding a probability of stalling during extension (chd1Δ model 2). The units of the color bars in panels B-D represent the number of fragments observed in a complete simulation averaged over a 20×20 bp window. E) Top: A schematic representation of the YLR454W gene under the control of the GAL1 promoter and of the ChIP time-course. Bottom: RNAPII (Rpb3–3Flag) and FACT (Spt16–6HA) occupancy, as determined by ChIP-qPCR, over the 5’ and 3’ regions of GAL1-YLR454W at different times after repression by addition of glucose, in WT and chd1Δ cells. The circles represent individual biological replicates (n = 4) and the traces represent their average. See also Figure S6 and Movies S1, S2 and S3.
Figure 7:
Figure 7:
FACT recognizes +1 nucleosomes, asymmetrically unwrapped from their TSS-proximal side. A) Graphical explanation for the interpretation of the distribution plots shown in panel B. The graphs show the distribution of the center of subnucleosomal size fragments. A distribution centered at “0” (grey trace) indicates symmetrically unwrapped nucleosomal particles, whereas a distribution centered to the left (tan) or the right (green) indicates nucleosomal particles asymmetrically unwrapped on their TSSdistal and TSS-proximal side, respectively. We used 90 bp, 103 bp, and 125 bp fragments as per (Ramachandran et al., 2017). B) Distribution of 103 bp (+/− 5 bp) fragment centers, from FACT (Spt16 and Pob3) MNase-ChIP-seq experiments (and their Inputs) from WT and chd1Δ cells, plotted relative to the position of +1 nucleosome dyads on all genes (n = 5,796). The data (grey) were fitted to a doubleGaussian (dotted). The tan and green traces show the two individual Gaussians representing asymmetrically unwrapped on their TSS-distal and TSS-proximal side, respectively as depicted in panel A. C) Full recruitment of FACT requires Spt4/Spt5. Left: Metagene of Spt16 and RNAPII (Rpb3) occupancy over transcribed genes, as determined by ChIP-chip, relative to Input, in WT and spt4Δ cells. Data are shown for experiments performed in two genetic backgrounds (BY4741, n = 275 and W303, n = 295). Right: A box plot of the average RNAPII and Spt16 occupancy in WT and spt4Δ cells for transcribed genes from the BY4741 experiment. D) A cartoon representation of the proposed mechanism for FACT recruitment and spreading along transcribed genes. See also Figure S7.

Similar articles

Cited by

References

    1. Adelman K, Wei W, Ardehali MB, Werner J, Zhu B, Reinberg D, and Lis JT (2006). Drosophila Paf1 modulates chromatin structure at actively transcribed genes. Mol Cell Biol 26, 250–260. - PMC - PubMed
    1. Bataille AR, Jeronimo C, Jacques PE, Laramee L, Fortin ME, Forest A, Bergeron M, Hanes SD, and Robert F. (2012). A universal RNA polymerase II CTD cycle is orchestrated by complex interplays between kinase, phosphatase, and isomerase enzymes along genes. Mol Cell 45, 158–170. - PubMed
    1. Beati P, and Chereji RV (2020). Creating 2D Occupancy Plots Using plot2DO. Methods Mol Biol 2117, 93–108. - PubMed
    1. Berson A, Sartoris A, Nativio R, Van Deerlin V, Toledo JB, Porta S, Liu S, Chung CY, Garcia BA, Lee VM, et al. (2017). TDP-43 Promotes Neurodegeneration by Impairing Chromatin Remodeling. Curr Biol 27, 3579–3590 e3576. - PMC - PubMed
    1. Birch JL, Tan BC, Panov KI, Panova TB, Andersen JS, Owen-Hughes TA, Russell J, Lee SC, and Zomerdijk JC (2009). FACT facilitates chromatin transcription by RNA polymerases I and III. EMBO J 28, 854–865. - PMC - PubMed

Publication types

MeSH terms