. 2021 Sep 2;81(17):3496-3508.e5.
doi: 10.1016/j.molcel.2021.07.023. Epub 2021 Aug 10.

The structure of an Hsp90-immunophilin complex reveals cochaperone recognition of the client maturation state

Affiliations

The structure of an Hsp90-immunophilin complex reveals cochaperone recognition of the client maturation state

Kanghyun Lee et al. Mol Cell. .

Abstract

The Hsp90 chaperone promotes folding and activation of hundreds of client proteins in the cell through an ATP-dependent conformational cycle guided by distinct cochaperone regulators. The FKBP51 immunophilin binds Hsp90 with its tetratricopeptide repeat (TPR) domain and catalyzes peptidyl-prolyl isomerase (PPIase) activity during folding of kinases, nuclear receptors, and tau. Here we determined the cryoelectron microscopy (cryo-EM) structure of the human Hsp90:FKBP51:p23 complex to 3.3 Å, which, together with mutagenesis and crosslinking analyses, reveals the basis for cochaperone binding to Hsp90 during client maturation. A helix extension in the TPR functions as a key recognition element, interacting across the Hsp90 C-terminal dimer interface presented in the closed, ATP conformation. The PPIase domain is positioned along the middle domain, adjacent to Hsp90 client binding sites, whereas a single p23 makes stabilizing interactions with the N-terminal dimer. With this architecture, FKBP51 is positioned to act on specific client residues presented during Hsp90-catalyzed remodeling.

Keywords: FKBP51; Hsp90; cryo-electron microscopy (cryo-EM); heat shock proteins; immunophilins; molecular chaperones; p23; peptidyl-prolyl isomerase (PPIase).


Conflict of interest statement

Declaration of interests The authors declare no competing interests.

Figures

Figure 1.
Figure 1.. Analysis of Hsp90 in the open and closed states.
(A) Native-gel of Hsp90 following incubation under indicated temperature, KCl and nucleotide (2 mM AMPPNP) conditions. Two independent experiments were performed. (B) SEC-MALS (in 150 mM KCl) of Hsp90 following incubation at 37°C with no nucleotide in 500 mM KCl (black), at 0°C with 2 mM AMPPNP in 500 mM KCl (green), at 37°C with 2 mM AMPPNP in 8 mM KCl (blue), and at 37°C with 2 mM AMPPNP in 500 mM KCl (red). The mwavg is indicated by horizontal lines (kDa, left Y-axis), and is shown with the elution trace of the protein concentration (refractive index, right Y-axis) versus elution volume (ml). (C) Representative negative-stain single particle images of Hsp90 following incubation with 500 mM KCl at 37°C in the absence (left) and presence (right) of 2 mM AMPPNP and compared to structures of the Hsp90 dimer in the open (PDB: 2IOQ) and closed (PDB: 2CG9) states.
Figure 2.
Figure 2.. SEC-MALS of FKBP51 and p23 binding to Hsp90 in the open and closed states.
(A) FKBP51, (B) p23, or (C) FKBP51 with p23 were incubated with Hsp90 at 37°C in 500 mM KCl under open-state (green) or closed-state (with 2 mM AMPPNP) (red) conditions and compared to Hsp90 alone in the open (black, dashed) and closed (blue, dashed) states. Axes are shown as in Figure 1 and the mwavg (kDa) determined by MALS, is shown for the corresponding Hsp90 complex.
Figure 3.
Figure 3.. Cryo-EM structure of Hsp90:FKBP51:p23 closed-state complex.
(A) Example 2D class averages of Hsp90:FKBP51:p23 (scale bar = 50 Å). The Hsp90 domains are labeled and FKBP51 density is shown (arrow) adjacent the CTD. (B) The final cryo-EM map of Hsp90:FKBP51:p23. Densities are colored based on the molecular model and correspond to the Hsp90 monomers (light and dark blue), the FKBP51 domains: FK1 (plum), FK2 (light pink) and the TPR (dark pink), and p23 (tan). (C) The final molecular model of Hsp90:FKBP51:p23 colored as in (B).
Figure 4.
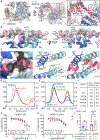
Figure 4.. Interactions by the FKBP51 TPR helix 7 extension (H7e) and the Hsp90 CTD define the closed state interaction.
(A) Low-pass filtered cryo-EM density map and model of Hsp90:FKBP51:p23 showing the CTD-TPR interaction, colored as in Figure 3 with the Hsp90 MEEVD peptide (green) modeled based on PDB 5NJX (Kumar et al., 2017). Expanded view (right panel) with approximate distances between M728 from the MEEVD and the Hsp90 C-terminal residue, I698, identified in the structure (dashed lines). (B) View of H7e (map+model) interacting across the Hsp90 CTD dimer interface. Proposed H7e hydrophobic interacting residues are labeled along with D405 and D420 residues which contact Hsp90 R690. (C) Surface representation of the Hsp90 CTD dimer groove is shown with hydrophobic residues in white and ribbon view of H7e (left panel); view of Hsp90 CTD dimer interface helices αH17 and αH18 and proposed interacting residues shown without (middle) and with H7e (right). (D,E) SEC-MALS analysis and (F) summary table of Hsp90:FKBP51 complex formation under closed state conditions with FKBP51 variants: (D) ΔH7e (Δ401–457) (red), and (E) M412K (green), F413K (red), and N402K (blue) in comparison to wildtype closed state complexes of Hsp90 (grey) and Hsp90:FKBP51 (black). The mwavg (left Y axis) and protein concentration (right Y axis) are shown versus elution volume (ml). Competitive binding inhibition of fluorescence polarization of FAM-DDTSRMEEVD bound to (G) FKBP51 wt or (H) ΔH7e by Hsp90 pre-incubated in the (red) closed or (black) open state conditions. Data are shown as the % tracer bound vs. the Hsp90 concentration. IC50 values of 3.8 and 10.2 μM and (I) Ki values of 0.9 ± 0.2 and 3.0 ± 1.0 μM were determined for FKBP51 wt with closed and open-state Hsp90 additions, respectively. IC50 values of 18.3 and 13.6 μM and (I) Ki values of 6.0 ± 2.5 and 4.1 ± 1.4 μM were determined for FKBP51 ΔH7e with closed and open-state Hsp90 additions, respectively. Three independent experiments were performed. Error bars represent standard deviation. *p < 0.5, ns = no significance.
Figure 5.
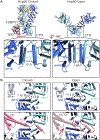
Figure 5.. Comparison of Hsp90 CTD conformations showing accommodation of FKBP51 H7e is specific to the closed state.
(A) Closed- (Hsp90:FKBP51:p23) and open-state (E. coli HtpG, PDB: 2IOQ) (Ali et al., 2006) Hsp90 structures with an expanded view of the CTD dimer showing distances between αH17 and αH18 (dashed line), indicating a wider dimer cleft in the closed state. (B) Rotated view of the CTD dimer in the closed (left) and open (right) states showing additional distances between αH17 and αH18 (dashed lines). Measurements are between S658 (αH17) and I692 (αH18) in the same subunit (1), across subunits (2). FKBP51 TPR (pink) is shown with H7e bound across the Hsp90 CTD dimer in the closed state (lower, left panel), as modeled in the Hsp90:FKBP51:p23 structure, but is incompatible and clashes with the CTD in the open state (lower right panel, dashed circle). Additional clashing at the H5 loop is indicated (arrow).
Figure 6.
Figure 6.. Positioning of FK1 PPIase domain adjacent Hsp90 client binding sites and model for FKBP51 function during client maturation.
(A) The Hsp90:FKBP51:p23 structure with distances showing the FK1 PPIase site and FK506 binding pocket (green) and connecting β3 bulge are positioned adjacent MD client binding sites (red) in Hsp90 (blue). Sites of Bpa incorporation in the β3 bulge region are shown. (B) SDS-PAGE analysis of Hsp90-FKBP51 photocrosslinking using FKBP51 variants with Bpa at D72, N74, or E75 following incubation under closed and open state conditions. Unique crosslinking bands present under closed-state conditions are indicated (asterisks). Two independent experiments were conducted. (C) Model for Hsp90-catalyzed client maturation and activation based on the Hsp90:FKBP51:p23 structure in which FKBP51 binds Hsp90 with p23 following ATP binding and NTD dimerization to form the client maturation complex. In this arrangement, FKBP51 is positioned for PPIase activity directed at specific client sites presented through Hsp90 binding and remodeling. Colors: Hsp90=light blue, FKBP51=pink, p23=tan, Client=yellow, Co-chaperone/Hsp70=Grey.

References

    1. Afonine PV, Poon BK, Read RJ, Sobolev OV, Terwilliger TC, Urzhumtsev A, and Adams PD (2018). Real-space refinement in PHENIX for cryo-EM and crystallography. Acta Crystallogr D Struct Biol 74, 531–544. - PMC - PubMed
    1. Ali MM, Roe SM, Vaughan CK, Meyer P, Panaretou B, Piper PW, Prodromou C, and Pearl LH (2006). Crystal structure of an Hsp90-nucleotide-p23/Sba1 closed chaperone complex. Nature 440, 1013–1017. - PMC - PubMed
    1. Assimon VA, Southworth DR, and Gestwicki JE (2015). Specific Binding of Tetratricopeptide Repeat Proteins to Heat Shock Protein 70 (Hsp70) and Heat Shock Protein 90 (Hsp90) Is Regulated by Affinity and Phosphorylation. Biochemistry 54, 7120–7131. - PMC - PubMed
    1. Blair LJ, Nordhues BA, Hill SE, Scaglione KM, O’Leary JC 3rd, Fontaine SN, Breydo L, Zhang B, Li P, Wang L, et al. (2013). Accelerated neurodegeneration through chaperone-mediated oligomerization of tau. J Clin Invest 123, 4158–4169. - PMC - PubMed
    1. Casanal A, Lohkamp B, and Emsley P (2020). Current developments in Coot for macromolecular model building of Electron Cryo-microscopy and Crystallographic Data. Protein Sci 29, 1069–1078. - PMC - PubMed

Publication types

MeSH terms

Substances