. 2021 Aug 10;36(6):109510.
doi: 10.1016/j.celrep.2021.109510.

PGC1α is required for the renoprotective effect of lncRNA Tug1 in vivo and links Tug1 with urea cycle metabolites

Affiliations

PGC1α is required for the renoprotective effect of lncRNA Tug1 in vivo and links Tug1 with urea cycle metabolites

Li Li et al. Cell Rep. .

Abstract

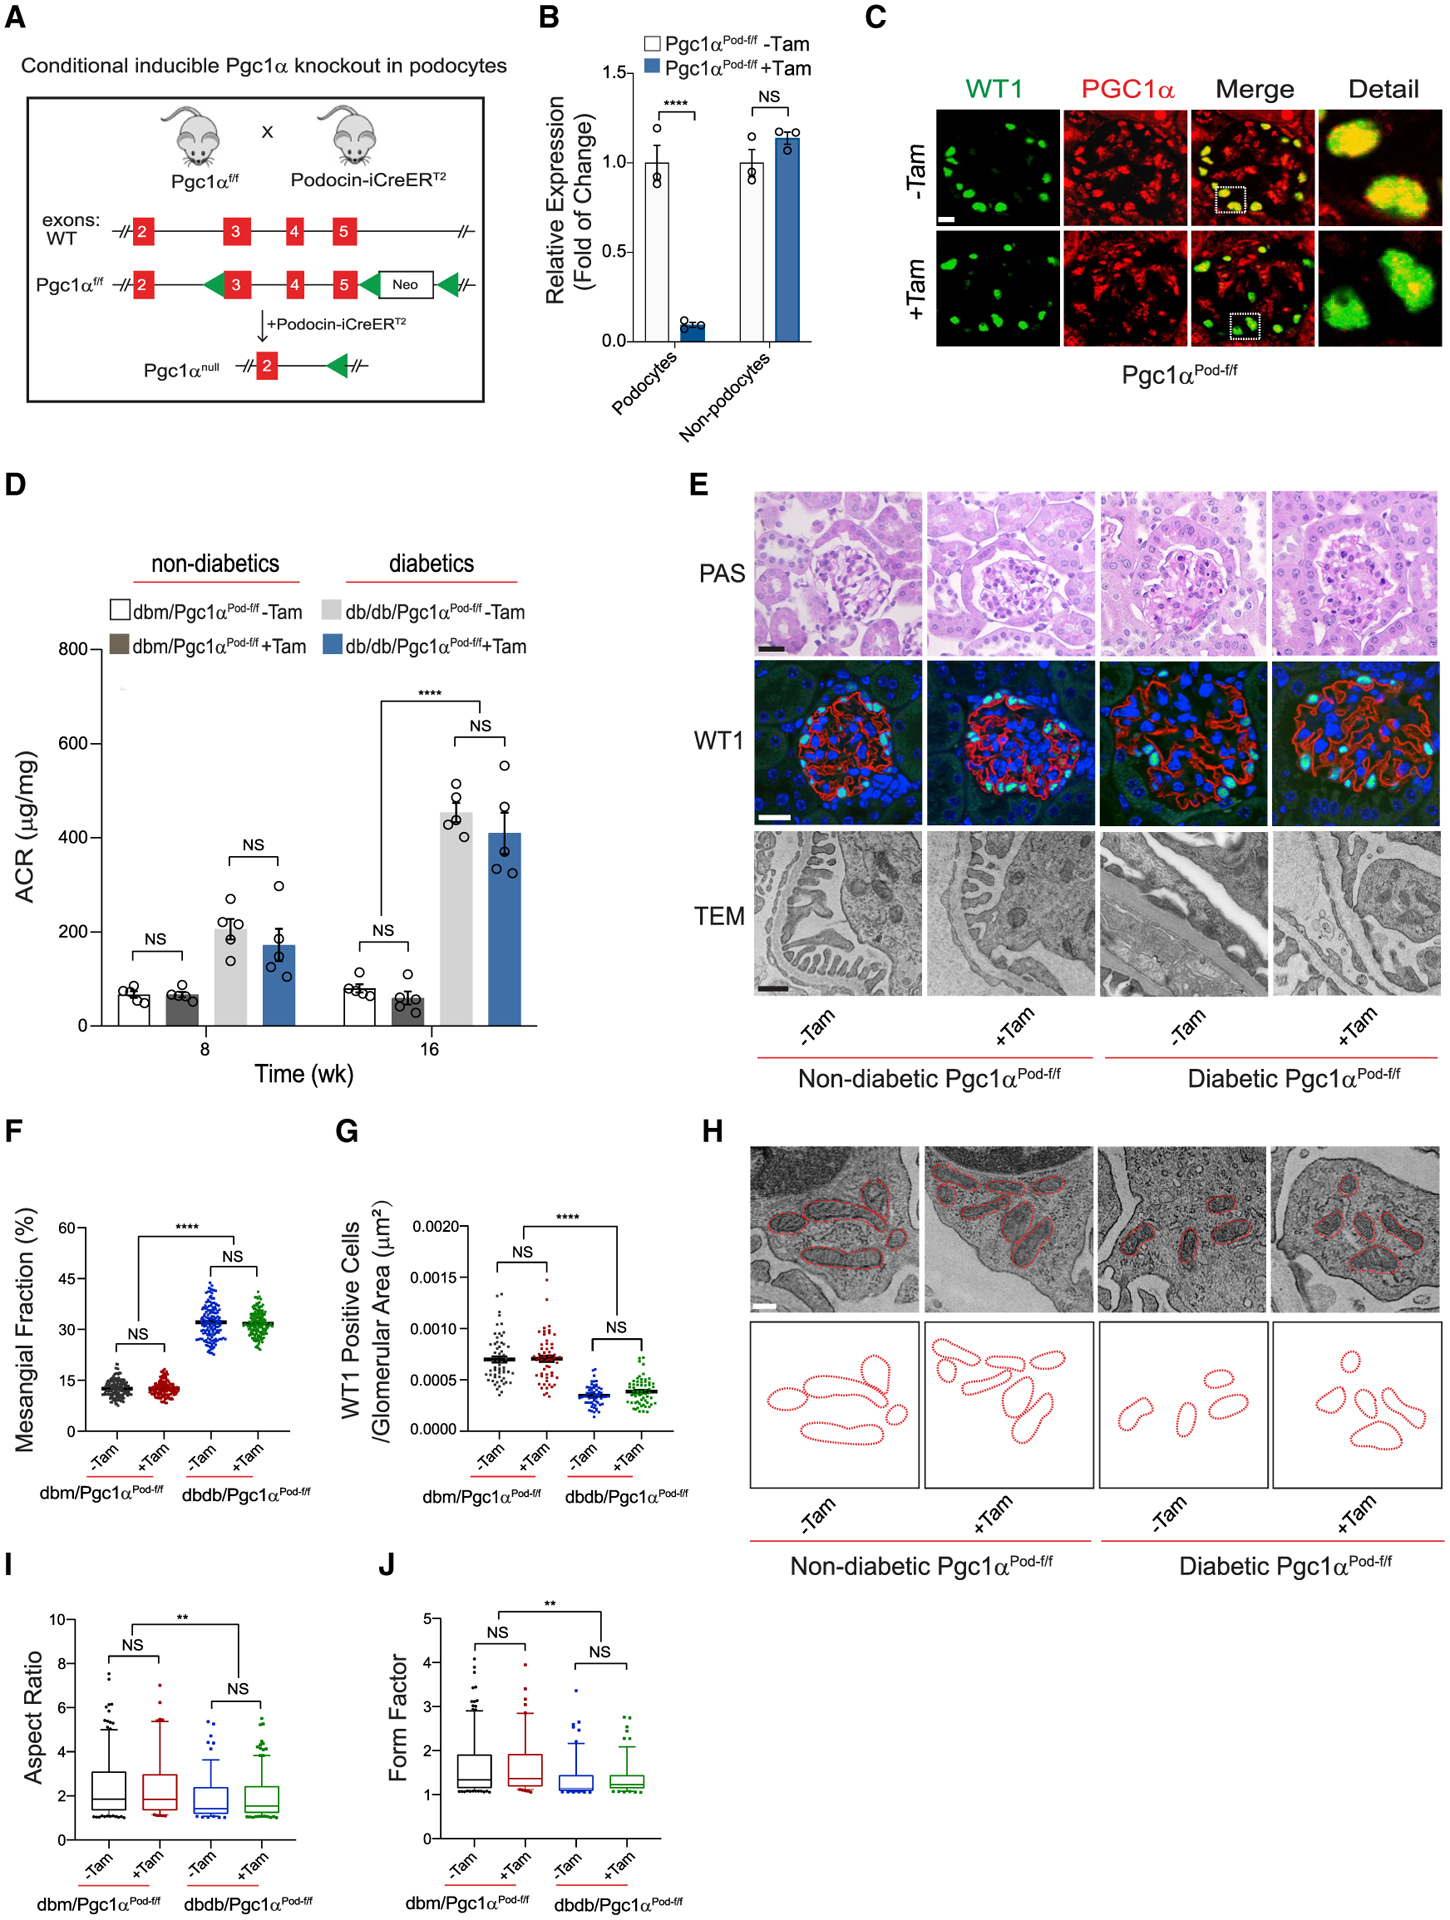
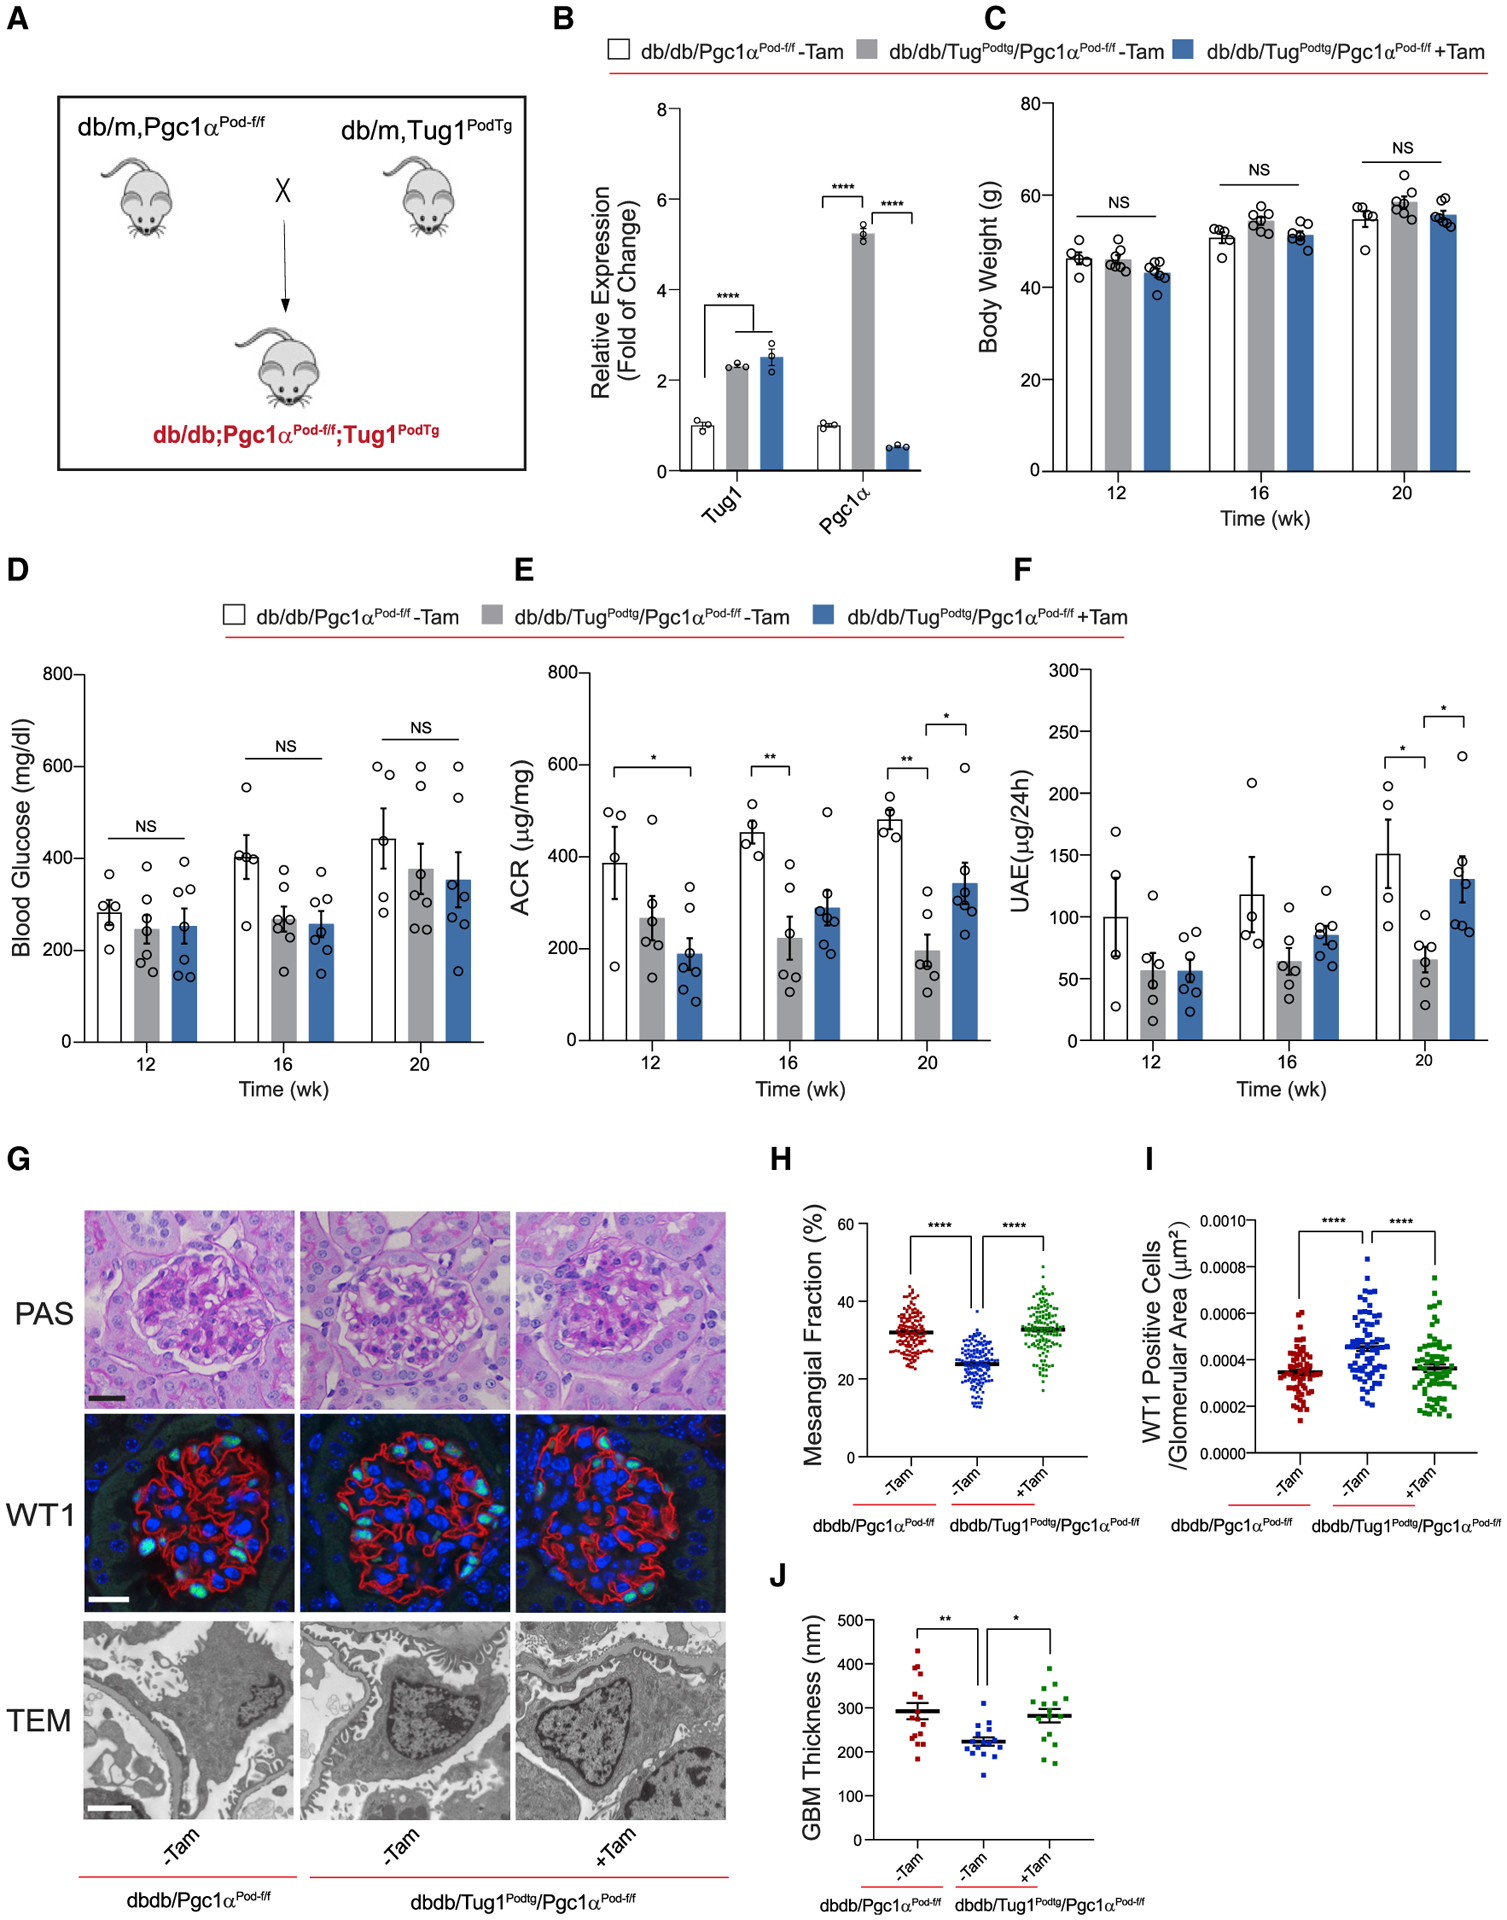
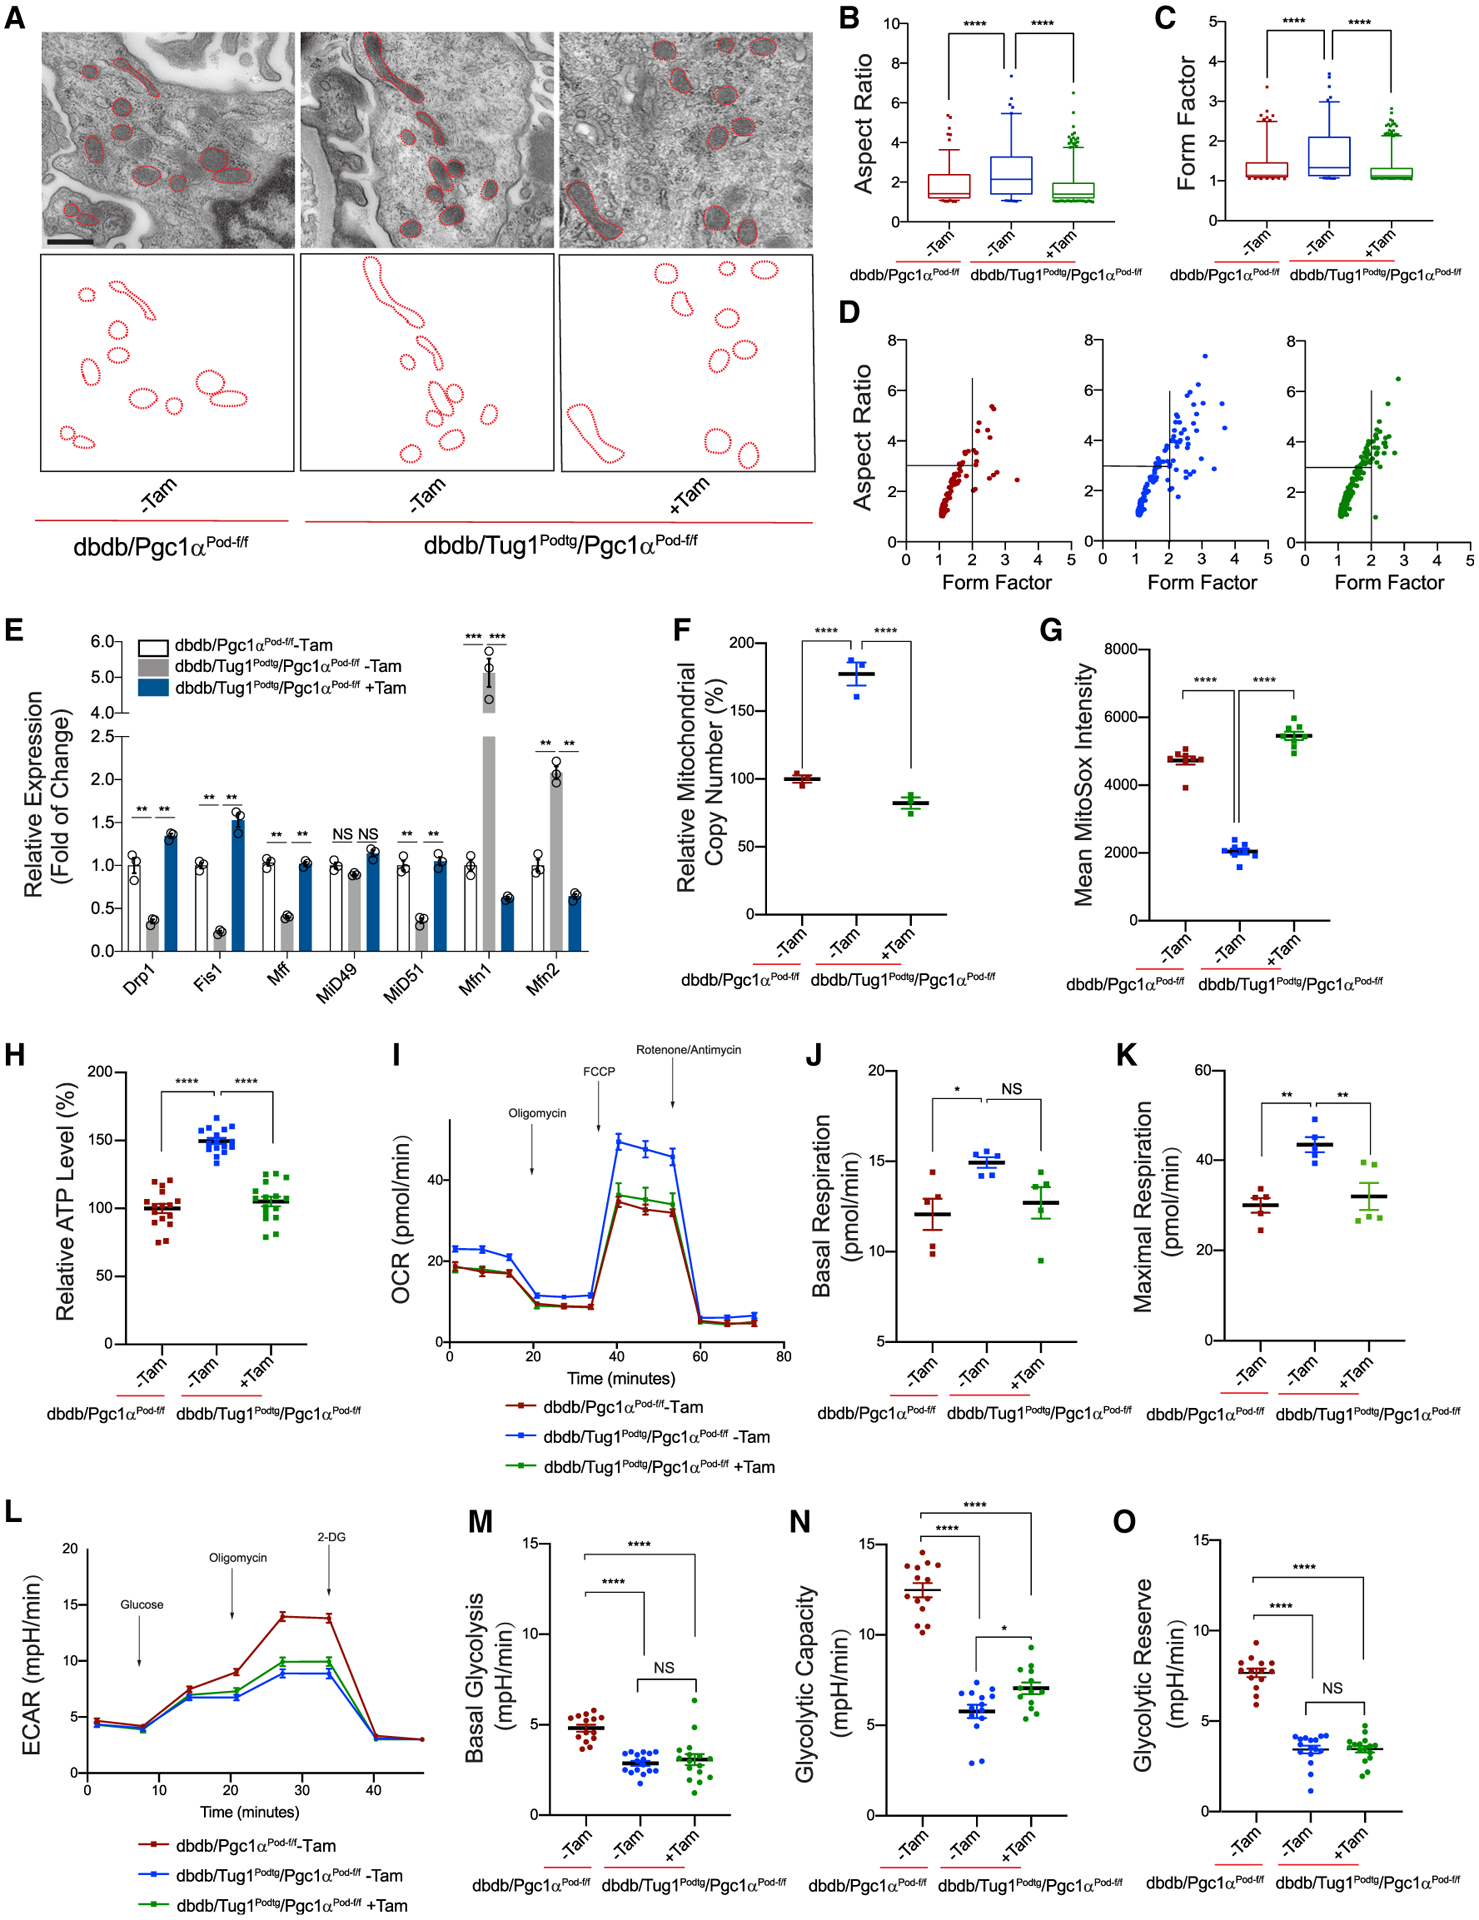
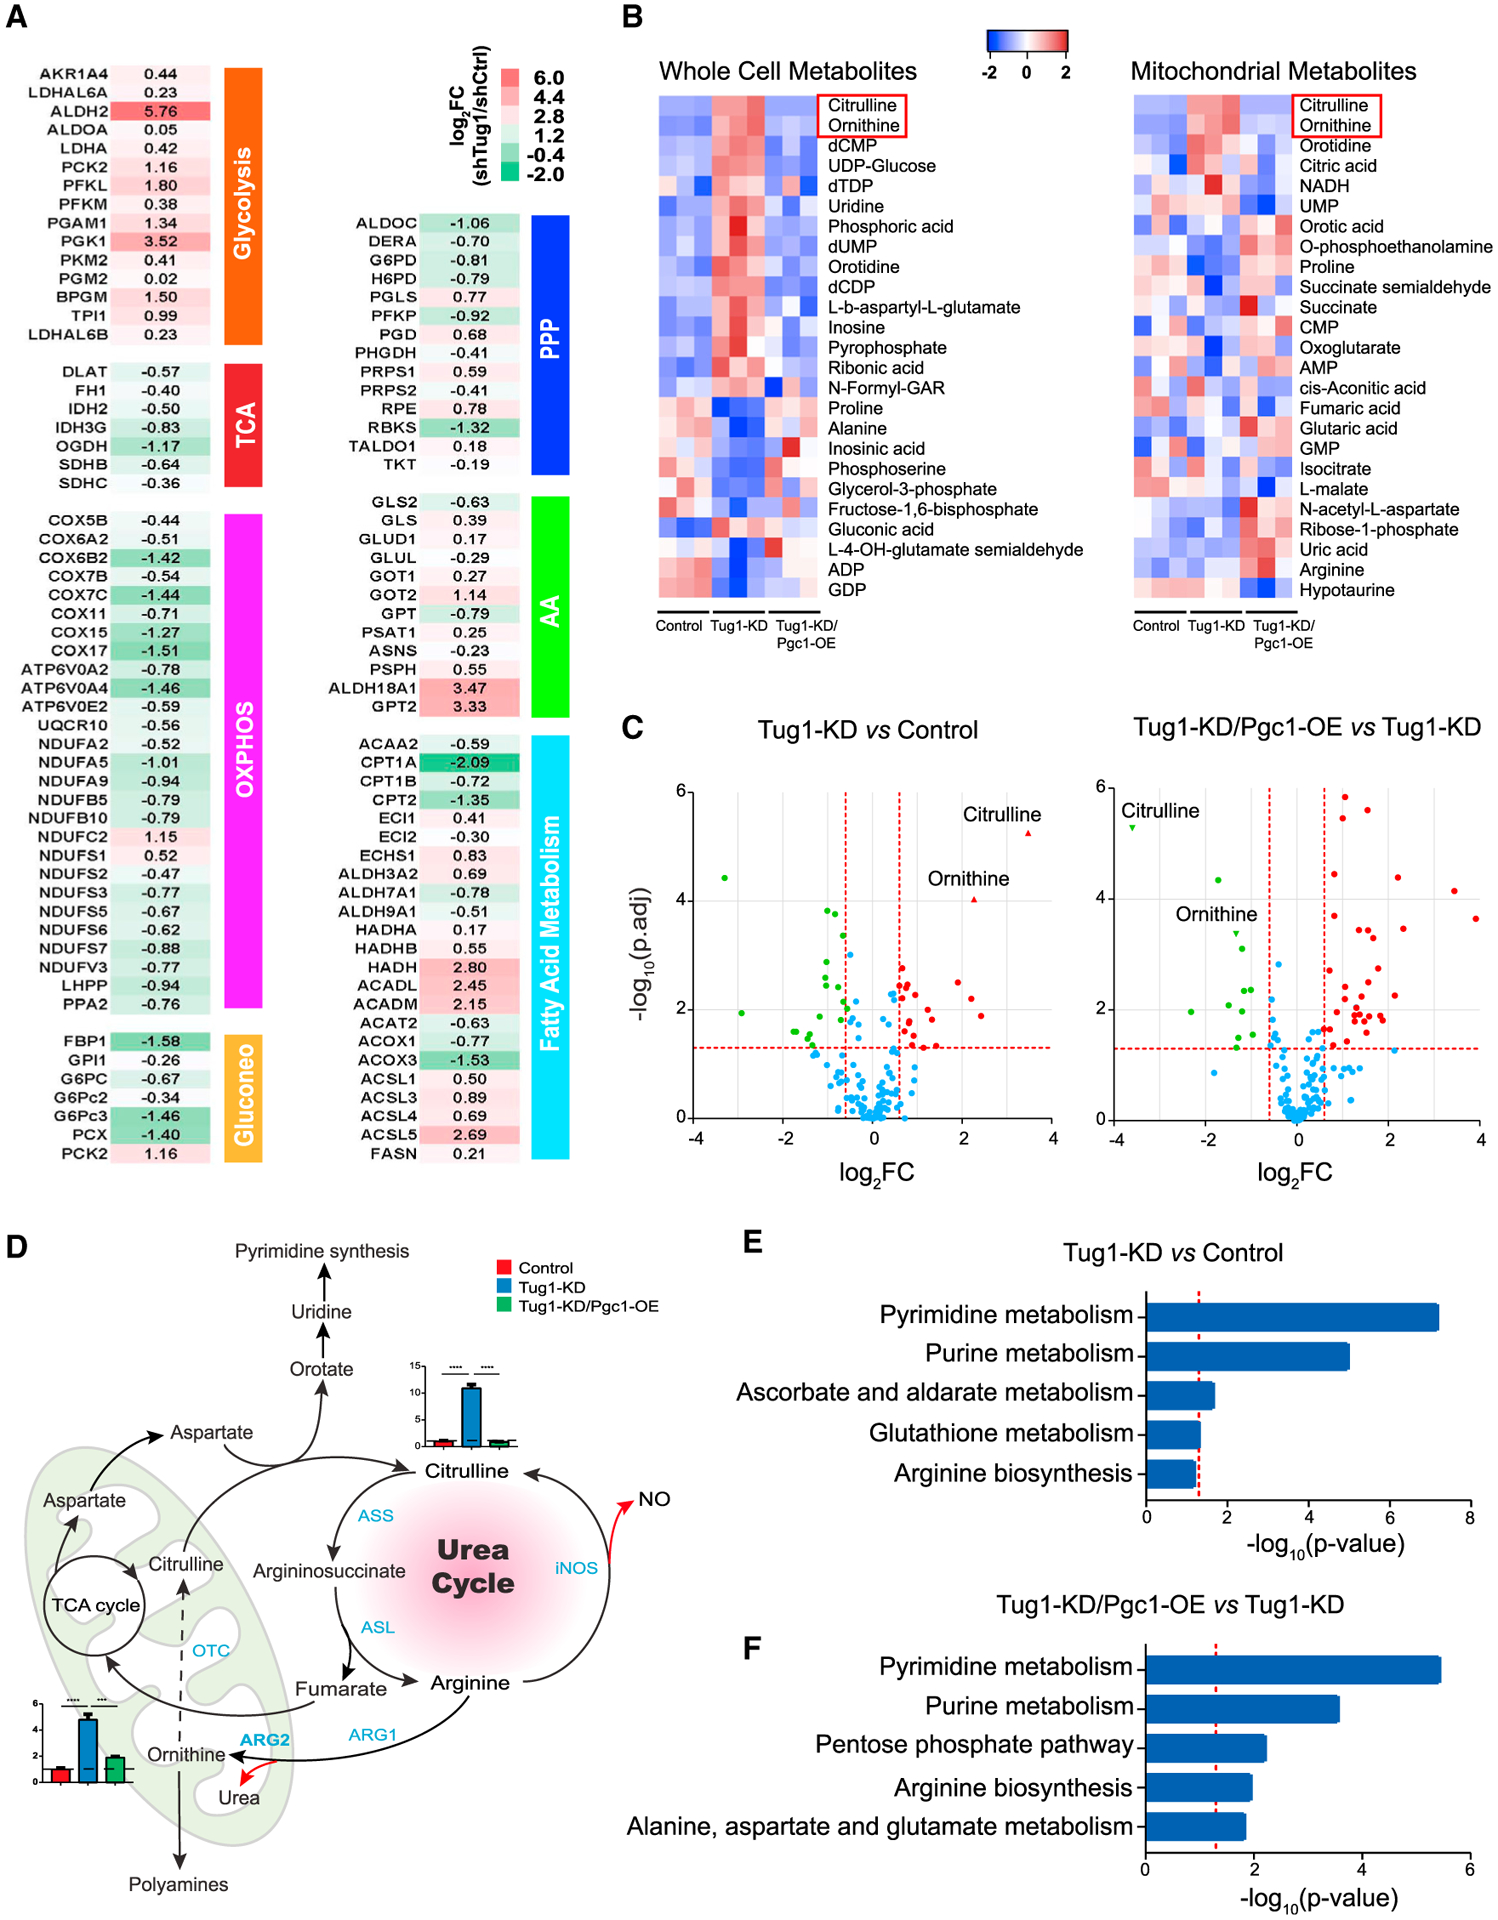
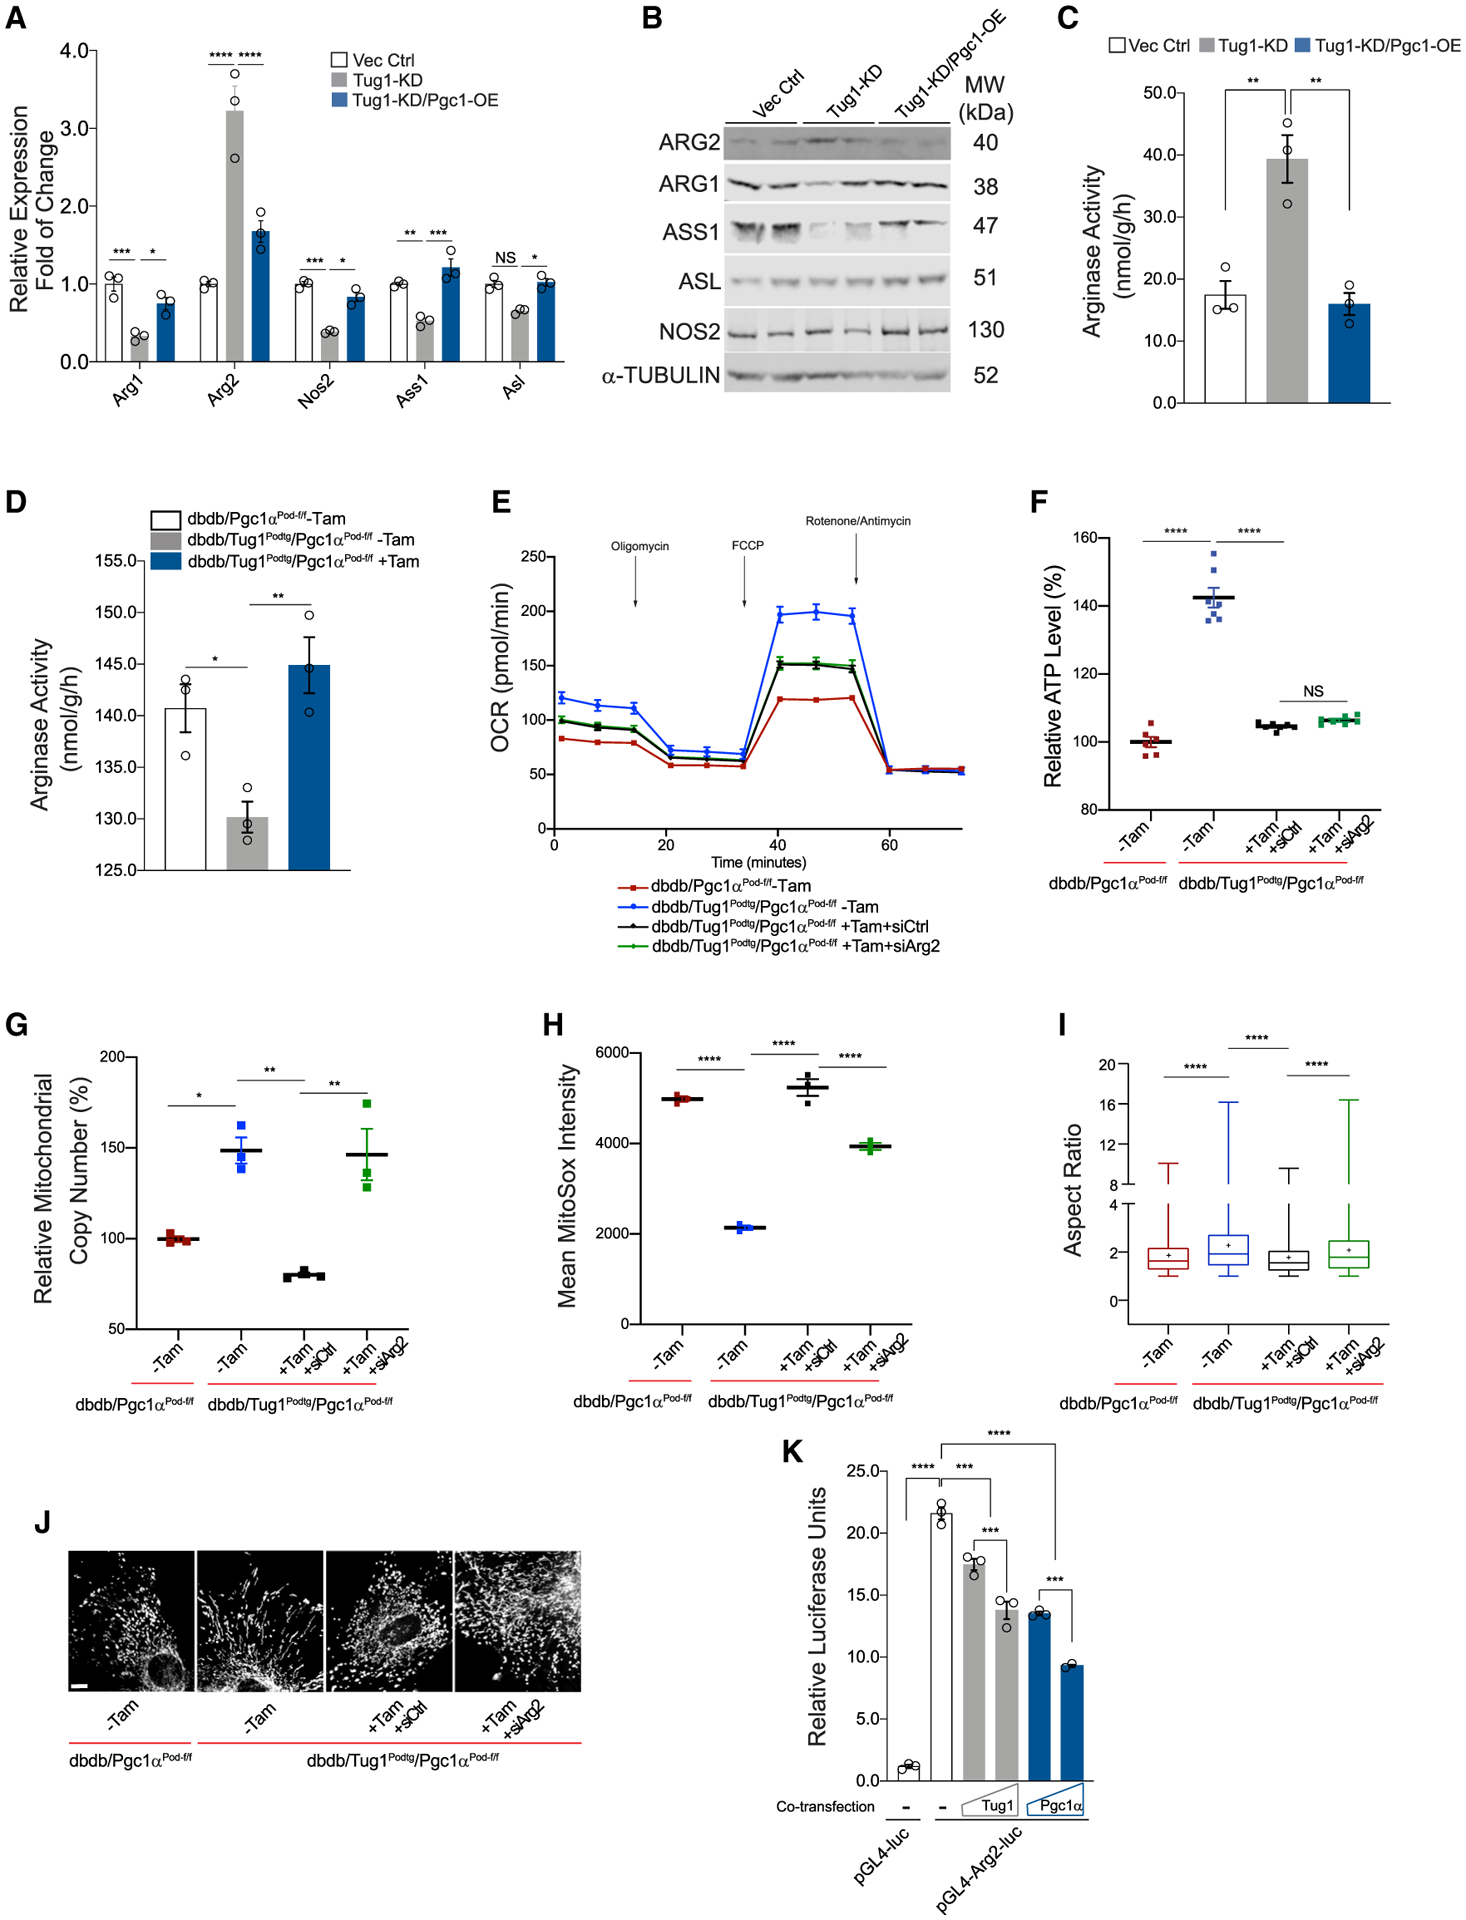
lncRNA taurine-upregulated gene 1 (Tug1) is a promising therapeutic target in the progression of diabetic nephropathy (DN), but the molecular basis of its protection remains poorly understood. Here, we generate a triple-mutant diabetic mouse model coupled with metabolomic profiling data to interrogate whether Tug1 interaction with peroxisome proliferator-activated receptor gamma coactivator 1α (PGC1α) is required for mitochondrial remodeling and progression of DN in vivo. We find that, compared with diabetic conditional deletion of Pgc1α in podocytes alone (db/db; Pgc1αPod-f/f), diabetic Pgc1α knockout combined with podocyte-specific Tug1 overexpression (db/db; TugPodTg; Pgc1αPod-f/f) reverses the protective phenotype of Tug1 overexpression, suggesting that PGC1α is required for the renoprotective effect of Tug1. Using unbiased metabolomic profiling, we find that altered urea cycle metabolites and mitochondrial arginase 2 play an important role in Tug1/PGC1α-induced mitochondrial remodeling. Our work identifies a functional role of the Tug1/PGC1α axis on mitochondrial metabolic homeostasis and urea cycle metabolites in experimental models of diabetes.

Keywords: PGC1α; RNA; Tug1; diabetic nephropathy; lncRNA; mitochondrial metabolites; podocytes.


Conflict of interest statement

Declaration of interests The authors declare no competing interests.

Figures

Figure 1.
Figure 1.. Conditional and inducible deletion of Pgc1α in podocytes does not exacerbate progression of DN
(A) Schematic of the podocyte-specific tamoxifen-inducible Pgc1α knockout strategy using the Cre-LoxP system. (B) qRT-PCR analysis of Pgc1α gene expression in isolated primary podocyte or nonpodocyte fractions from podocyte-specific control (−Tam) and tamoxifen-treated (+Tam) Pgc1α knockout mice (n = 3 mice/group). (C) Representative immunofluorescence micrographs of kidney sections stained with WT1 (green) and PGC1α (red) antibodies. Scale, 25 μm. (D) ACR analysis of tamoxifen-induced and noninduced controls from nondiabetic (db/m; Pgc1αPod-f/f) and diabetic (db/db; Pgc1αPod-f/f) mice at 8 and 16 weeks of age (n = 5 mice/group). (E) Representative images of PAS staining (upper panel), WT1 staining (middle panel), and TEM (bottom panel) of kidney glomeruli from groups described in (D). Scales, 50 μm (upper and middle panels) and 0.5 μm (bottom panel). (F and G) Quantification of mesangial matrix expansion (F) and WT1-positive cells/glomerular area (G) in the respective group. n = 3 independent animals per group. (H) Representative TEM micrographs (upper panel) and tracing (lower panel) of the mitochondria in podocytes from the indicated experimental groups. Scale, 0.2 μm. (I and J) Average mitochondrial aspect ratios (I) and form factors (J) from TEM micrographs of groups described in (H, upper panel). n = 3 independent mice per group. Results are presented as mean ± SEMs (B, D, F, and G). Boxes represent median with interquartile range (IQR), and whiskers represent a 5–95 percentile range (I and J). Data were analyzed for statistical significance using one-way ANOVA followed by Tukey’s multiple comparison test (D, F, G, I, and J) or using two-tailed t test (B). **p < 0.01; ****p < 0.0001; NS, not significant.
Figure 2.
Figure 2.. Podocyte-specific Pgc1α deficiency mitigates the renoprotective effect of podocyte-specific lncRNA Tug1 transgenic mice in the diabetic db/db model
(A) Schematic of the mating strategy for diabetic db/db mice with podocyte-specific lncRNA Tug1 transgenic and Pgc1α knockout. (B) qRT-PCR analysis of Tug1 and Pgc1α gene expression in the primary podocytes isolated from the indicated mice (n = 3 mice per group). (C–F) Body weight (C), blood glucose (D), ACR (E), and 24 h urine albumin excretion (UAE) (F) analysis of diabetic podocyte-specific Pgc1α-floxed control (db/db; Pgc1αPod-f/f, n = 4 or 5 mice/group) and −Tam (n = 6 or 7 mice/group) or +Tam (n = 7 mice/group) diabetic podocyte-specific Pgc1α-floxed plus Tug1 transgenic (db/db; Tug1Pod-tg; Pgc1αPod-f/f) mice at 12, 16, and 20 weeks of age. (G) Representative images of PAS staining (upper panel), WT1 staining (middle panel), and TEM (bottom panel) of kidney glomeruli from different experimental groups. Scales, 50 μm (upper and middle panels) and 2 μm (bottom panel). (H–J) Quantification of mesangial matrix expansion (H), WT1-positive cells/glomerular area (I), and GBM thickness (J) from images represented in (G). n = 3 independent mice per group; n = 50 glomeruli analyzed per mouse in (H), n = 20 glomeruli analyzed per mouse in (I), and n = 5 micrographs analyzed per mouse in (J). Results are presented as mean ± SEMs. *p < 0.05; **p < 0.01; ****p < 0.0001; NS, not significant, by one-way ANOVA followed by Tukey’s multiple comparison test.
Figure 3.
Figure 3.. lncRNA Tug1-mediated mitochondrial fitness in podocytes is reversed with Pgc1α knockout
(A) Representative TEM micrograph (upper panel) and tracing (lower panel) of mitochondria in podocytes of the experimental mice with the indicated genotypes. Scale, 0.5 μm. (B–D) Quantification of podocyte mitochondrial aspect ratio (B), form factor (C), and aspect ratio plotted against form factor (D) from TEM images of different experimental groups. n = 4 independent mice per group. (E) qRT-PCR analysis of mitochondrial dynamics-related genes in isolated primary podocytes. (F–H) Mitochondrial function as assessed by mitochondrial copy number (F), MitoSOX production (G), and total ATP production (H) in isolated primary podocytes. (I–K) Seahorse analysis of OCR (I), with basal respiration (J) and maximal respiration (K) from isolated primary podocytes. (L–O) Seahorse analysis of ECAR (L), with basal glycolysis (M), glycolytic capacity (N), and glycolytic reserve (O) from isolated primary podocytes. Boxes represent median with IQR, and whiskers represent a 5–95 percentile range (B and C). Lines and error bars represent mean ± SEMs (E–O). Data were analyzed by one-way ANOVA with Tukey’s multiple comparison test. *p < 0.05; **p < 0.01; ***p < 0.001; ****p < 0.0001; NS, not significant.
Figure 4.
Figure 4.. Urea cycle intermediates link the Tug1/PGC1α axis with mitochondrial remodeling
(A) Microarray analysis of key metabolic enzymes of multiple metabolic pathways between stable Tug1-knockdown versus shRNA control (shTug1 versus shCtrl) podocytes. (B) Heatmap of the top 25 whole-cell mitochondrial metabolites that differ among control, Tug1-KD, and Tug1-KD with Pgc1α-OE podocytes. (C) Volcano plots of metabolomic data generated from Tug1-KD podocytes compared with control, as well as Tug1-KD/Pgc1-OE podocytes compared with Tug1-KD cells. Significantly (adjusted p < 0.05) regulated metabolites with a cutoff of a log2 fold change greater than 1.5 are marked in green (downregulated) and red (upregulated). (D) Schematic of the urea cycle and links among arginine metabolism, the TCA cycle, and the pyrimidine synthesis pathway. Relative levels of ornithine and citrulline are shown. Samples are normalized to control cells, as indicated by dashed lines in the bar graphs. Valued are presented as mean ± SEMs. ***p < 0.001; ****p < 0.0001, by one-way ANOVA followed by Tukey’s multiple comparison test. ARG1, arginase 1; ARG2, arginase 2; ASS, argininosuccinate synthetase; ASL, argininosuccinate lyase; iNOS (NOS2), inducible nitric oxide synthase; OTC, ornithine transcarbamylase. (E and F) Metabolite set enrichment analysis of the significantly regulated metabolic pathways in Tug1-KD podocytes compared with controls and in Tug1-KD/Pgc1-OE podocytes compared with Tug1-KD cells. The dashed line indicates p < 0.05.
Figure 5.
Figure 5.. Mitochondrial arginase 2 links the Tug1/PGC1α axis with mitochondrial metabolism
(A) qRT-PCR analysis of key enzymes in the urea cycle in control, Tug1-KD, and Tug1-KD/Pgc1-OE podocytes. (B) Western blot analysis of key enzymes in the urea cycle from the indicated podocyte cell lines. (C) Arginase activity assay from the indicated podocyte cell lines. (D) Arginase activity assay from the indicated primary podocytes. (E–J) Mitochondrial function as assessed by Seahorse analysis of OCR (E), total ATP production (F), mitochondrial copy number (G), MitoSOX production (H), mitochondrial aspect ratio (I), and representative images of mitochondria morphology with MitoTracker staining (J) in isolated primary podocytes from db/db; Pgc1αPod-f/f −Tam mice, db/db; Tug1Pod-tg; Pgc1αPod-f/f −Tam mice, and db/db; Tug1Pod-tg; Pgc1αPod-f/f +Tam mice with control siRNA (+siCtrl) or Arg2 siRNA (+siArg2) transfection. Scale in (J), 10 μm. (K) Arg2 promoter luciferase reporter assay in HEK293T cells cotransfected with an increasing amount of Tug1 or Pgc1α for transient overexpression. Results are presented as mean ± SEMs. (I) Box, median with IQR; whiskers, min to max; +, mean value. *p < 0.05; **p < 0.01; ***p < 0.001; ****p < 0.0001; NS, not significant, by one-way ANOVA followed by Tukey’s multiple comparison test.

Similar articles

Cited by

References

    1. Ayanga BA, Badal SS, Wang Y, Galvan DL, Chang BH, Schumacker PT, and Danesh FR (2016). Dynamin-related protein 1 deficiency improves mitochondrial fitness and protects against progression of diabetic nephropathy. J. Am. Soc. Nephrol 27, 2733–2747. - PMC - PubMed
    1. Badal SS, Wang Y, Long J, Corcoran DL, Chang BH, Truong LD, Kanwar YS, Overbeek PA, and Danesh FR (2016). miR-93 regulates Msk2-mediated chromatin remodelling in diabetic nephropathy. Nat. Commun 7, 12076. - PMC - PubMed
    1. Brinkkoetter PT, Bork T, Salou S, Liang W, Mizi A,Özel C, Koehler S, Hagmann HH, Ising C, Kuczkowski A, et al. (2019). Anaerobic glycolysis maintains the glomerular filtration barrier independent of mitochondrial metabolism and dynamics. Cell Rep. 27, 1551–1566.e5. - PMC - PubMed
    1. Caldwell RW, Rodriguez PC, Toque HA, Narayanan SP, and Caldwell RB (2018). Arginase: a multifaceted enzyme important in health and disease. Physiol. Rev 98, 641–665. - PMC - PubMed
    1. Darshi M, Van Espen B, and Sharma K (2016). Metabolomics in Diabetic Kidney Disease: Unraveling the Biochemistry of a Silent Killer. Am. J. Nephrol 44, 92–103. - PMC - PubMed

Publication types

MeSH terms