. 2021 Aug 10;36(6):109508.
doi: 10.1016/j.celrep.2021.109508.

Molecular and functional properties of cortical astrocytes during peripherally induced neuroinflammation

Affiliations

Molecular and functional properties of cortical astrocytes during peripherally induced neuroinflammation

Blanca Diaz-Castro et al. Cell Rep. .

Abstract

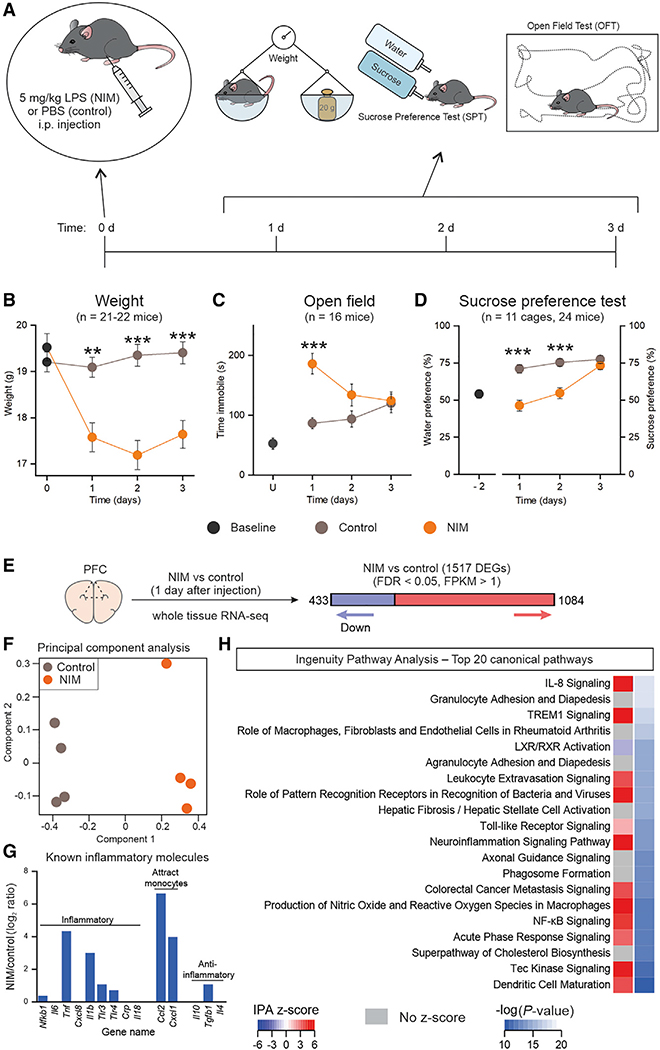
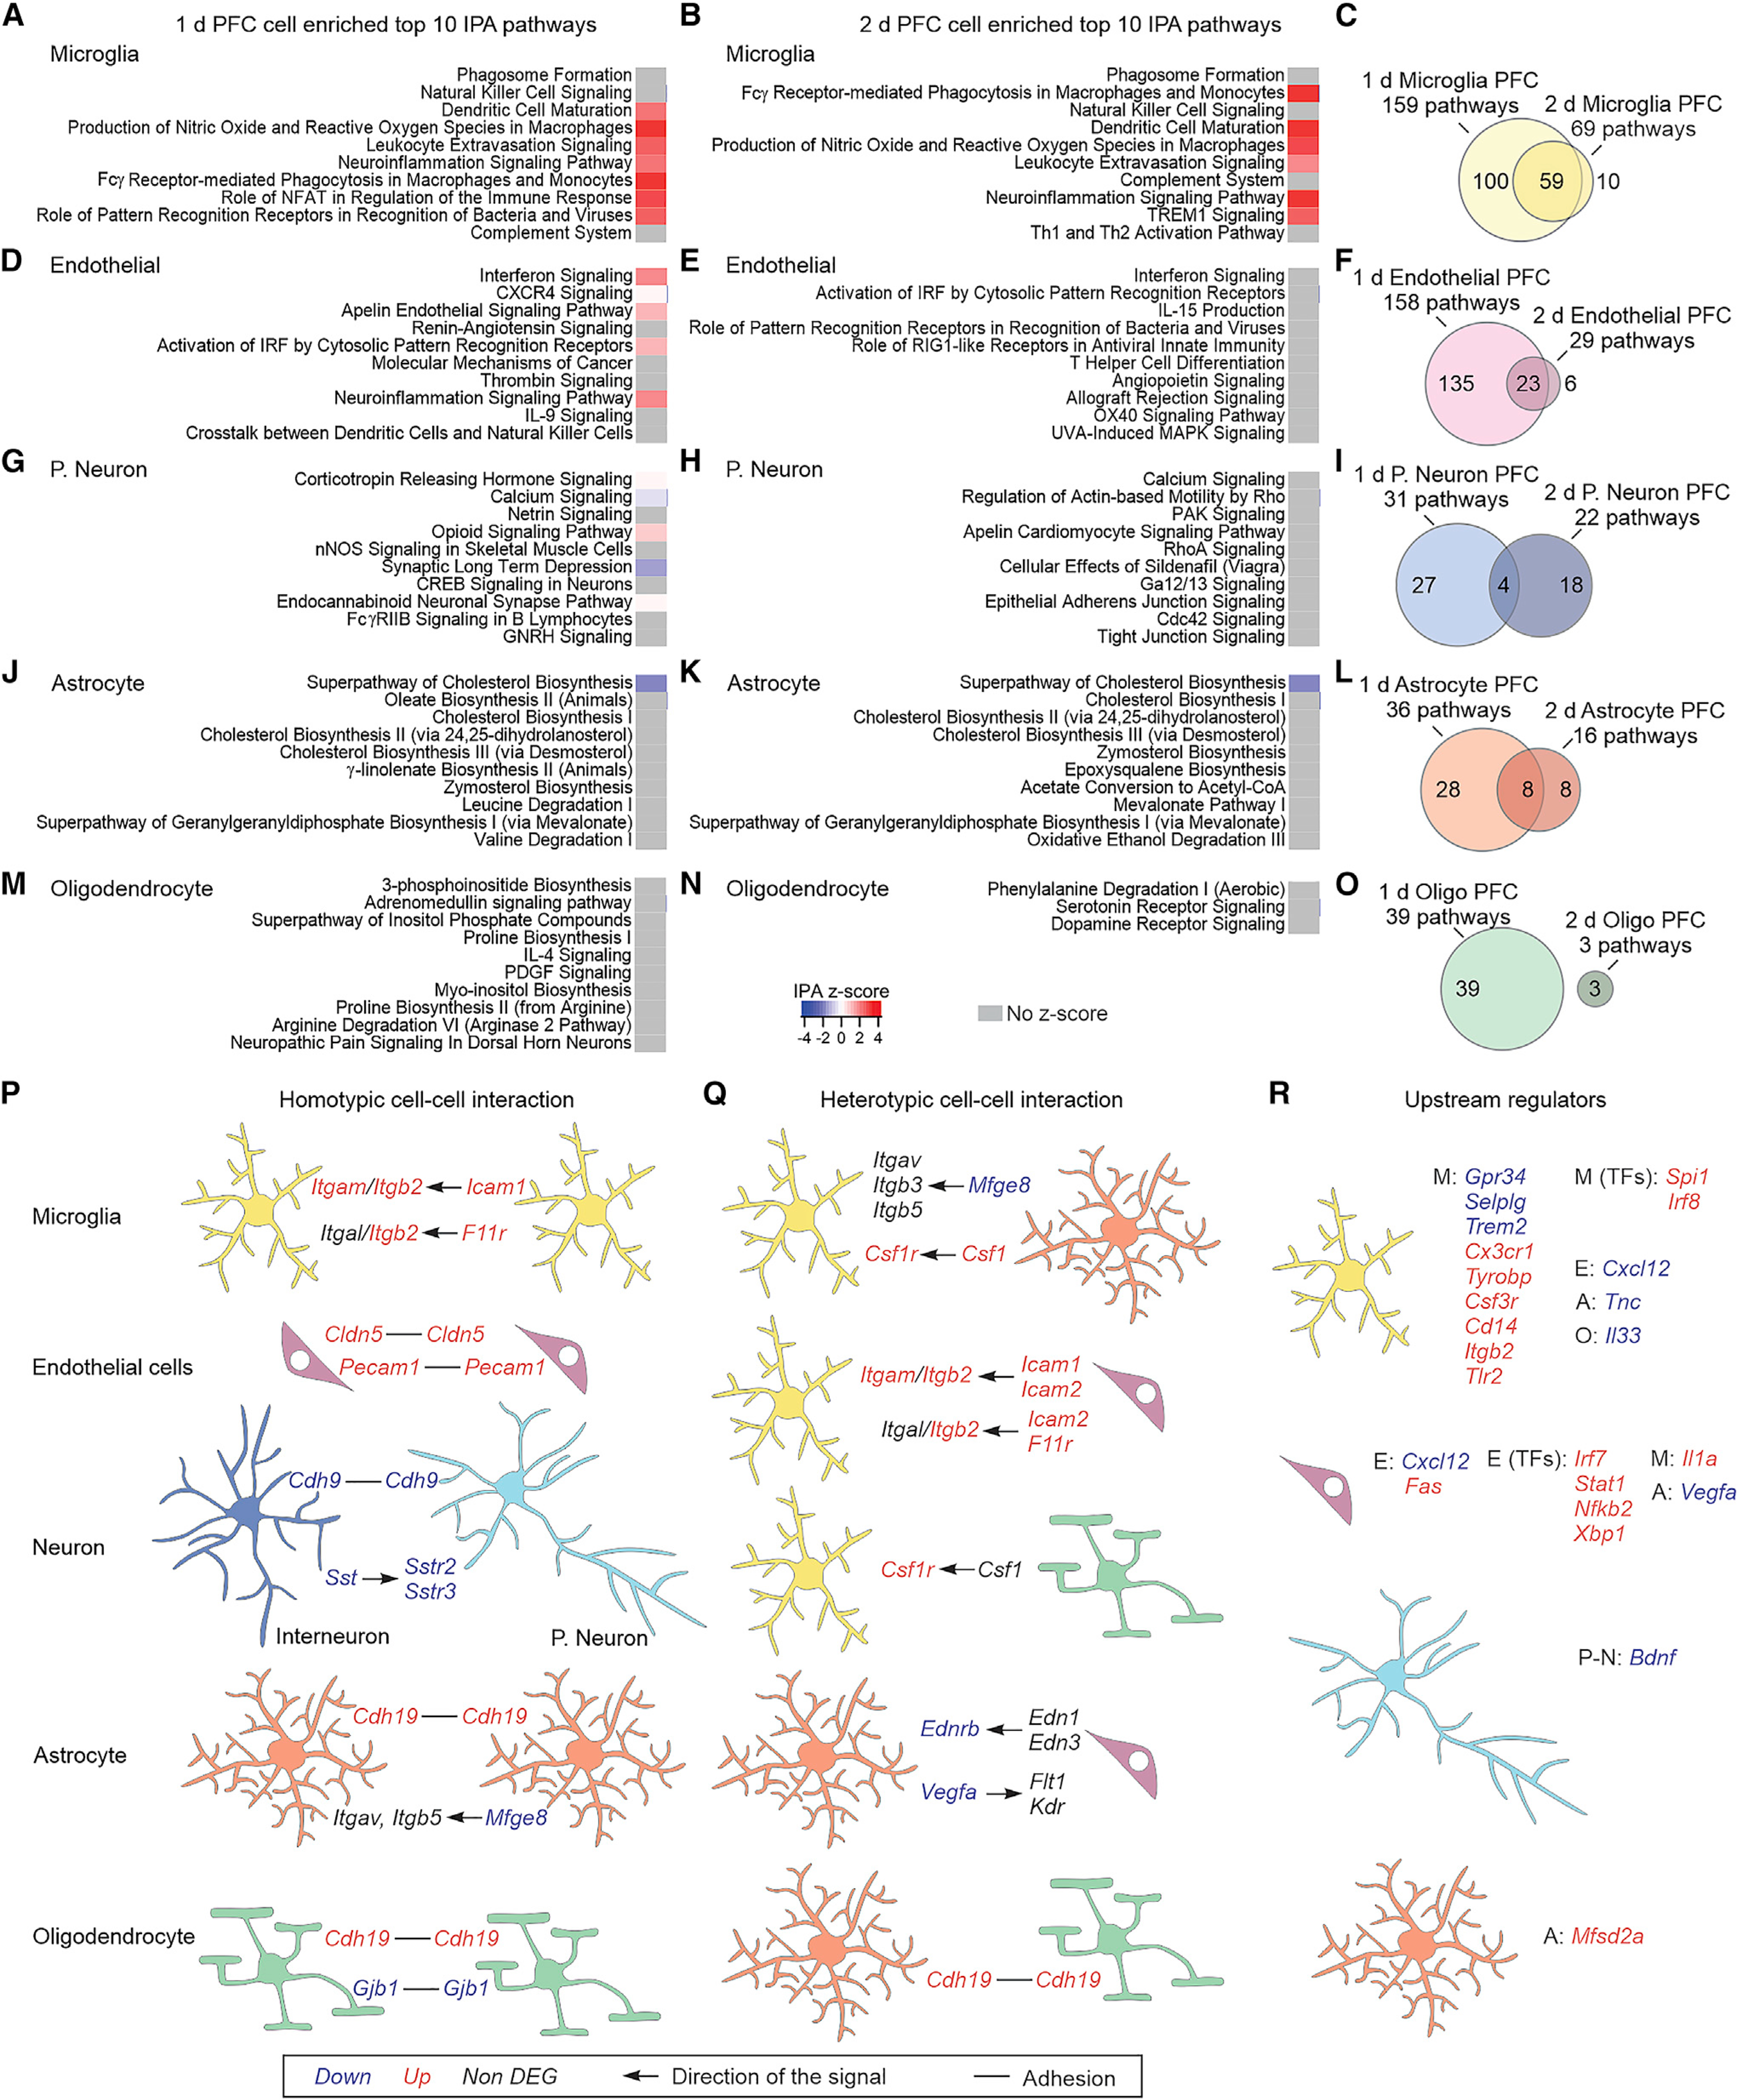
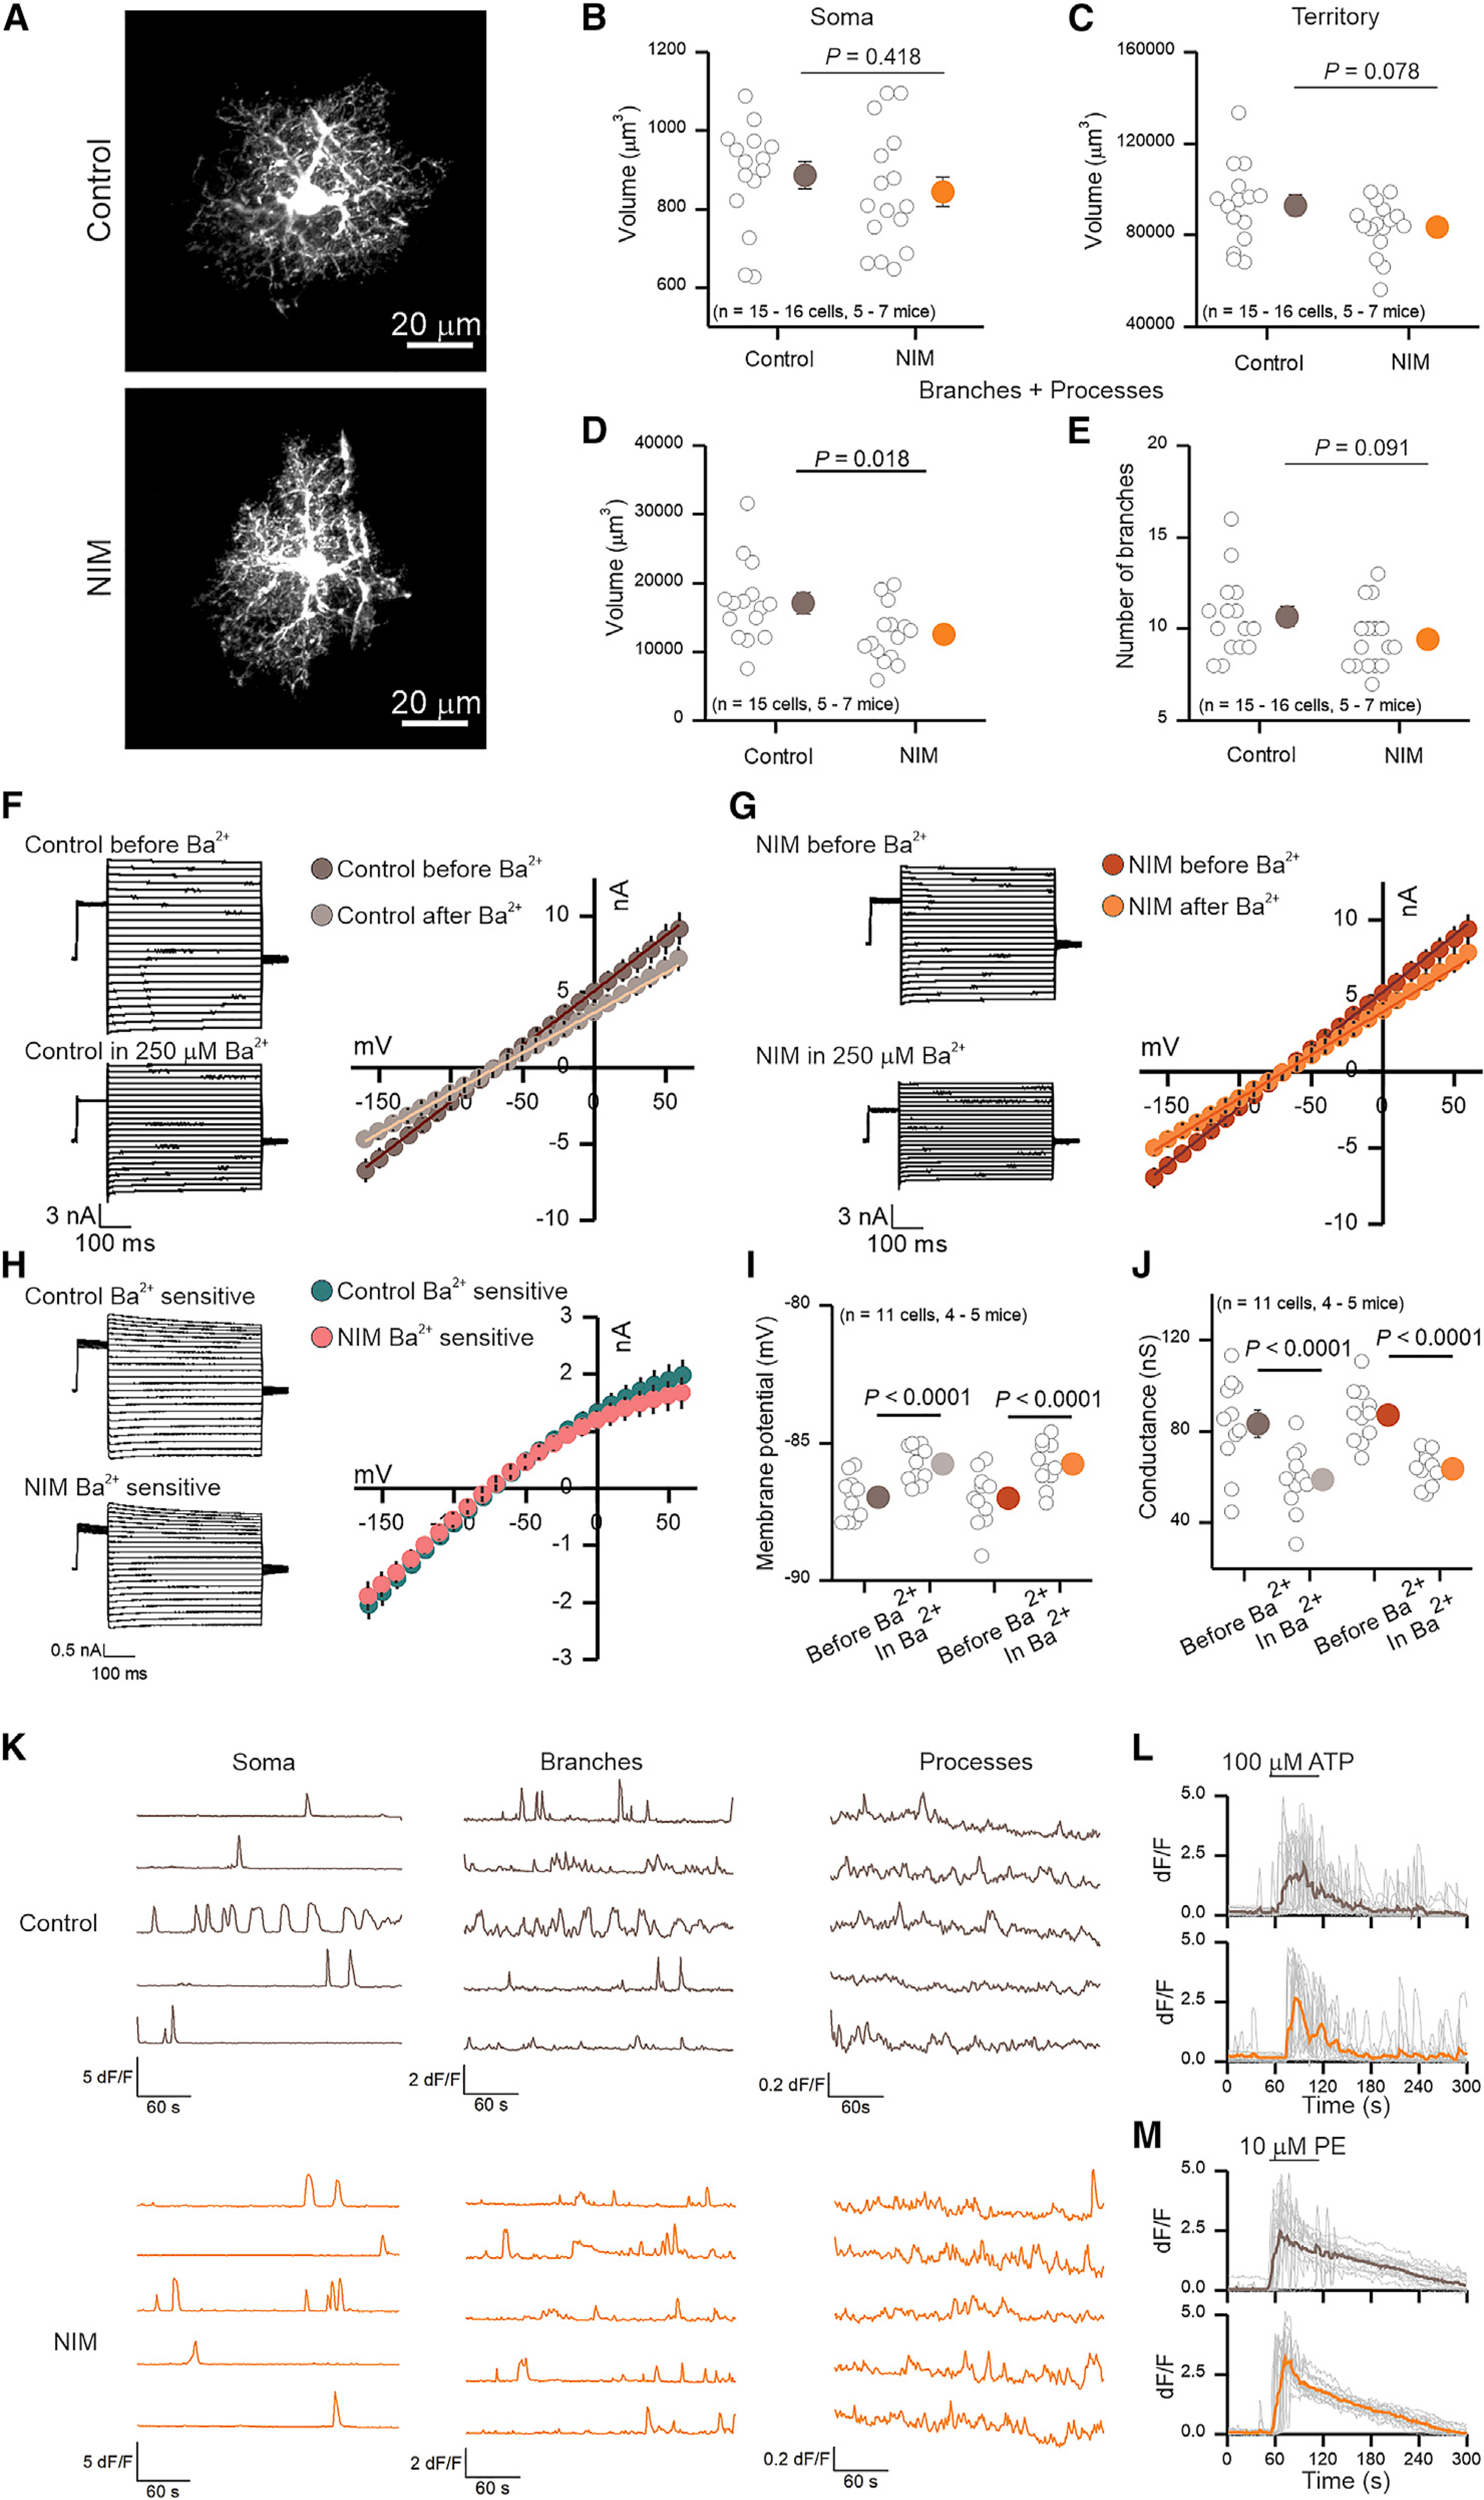
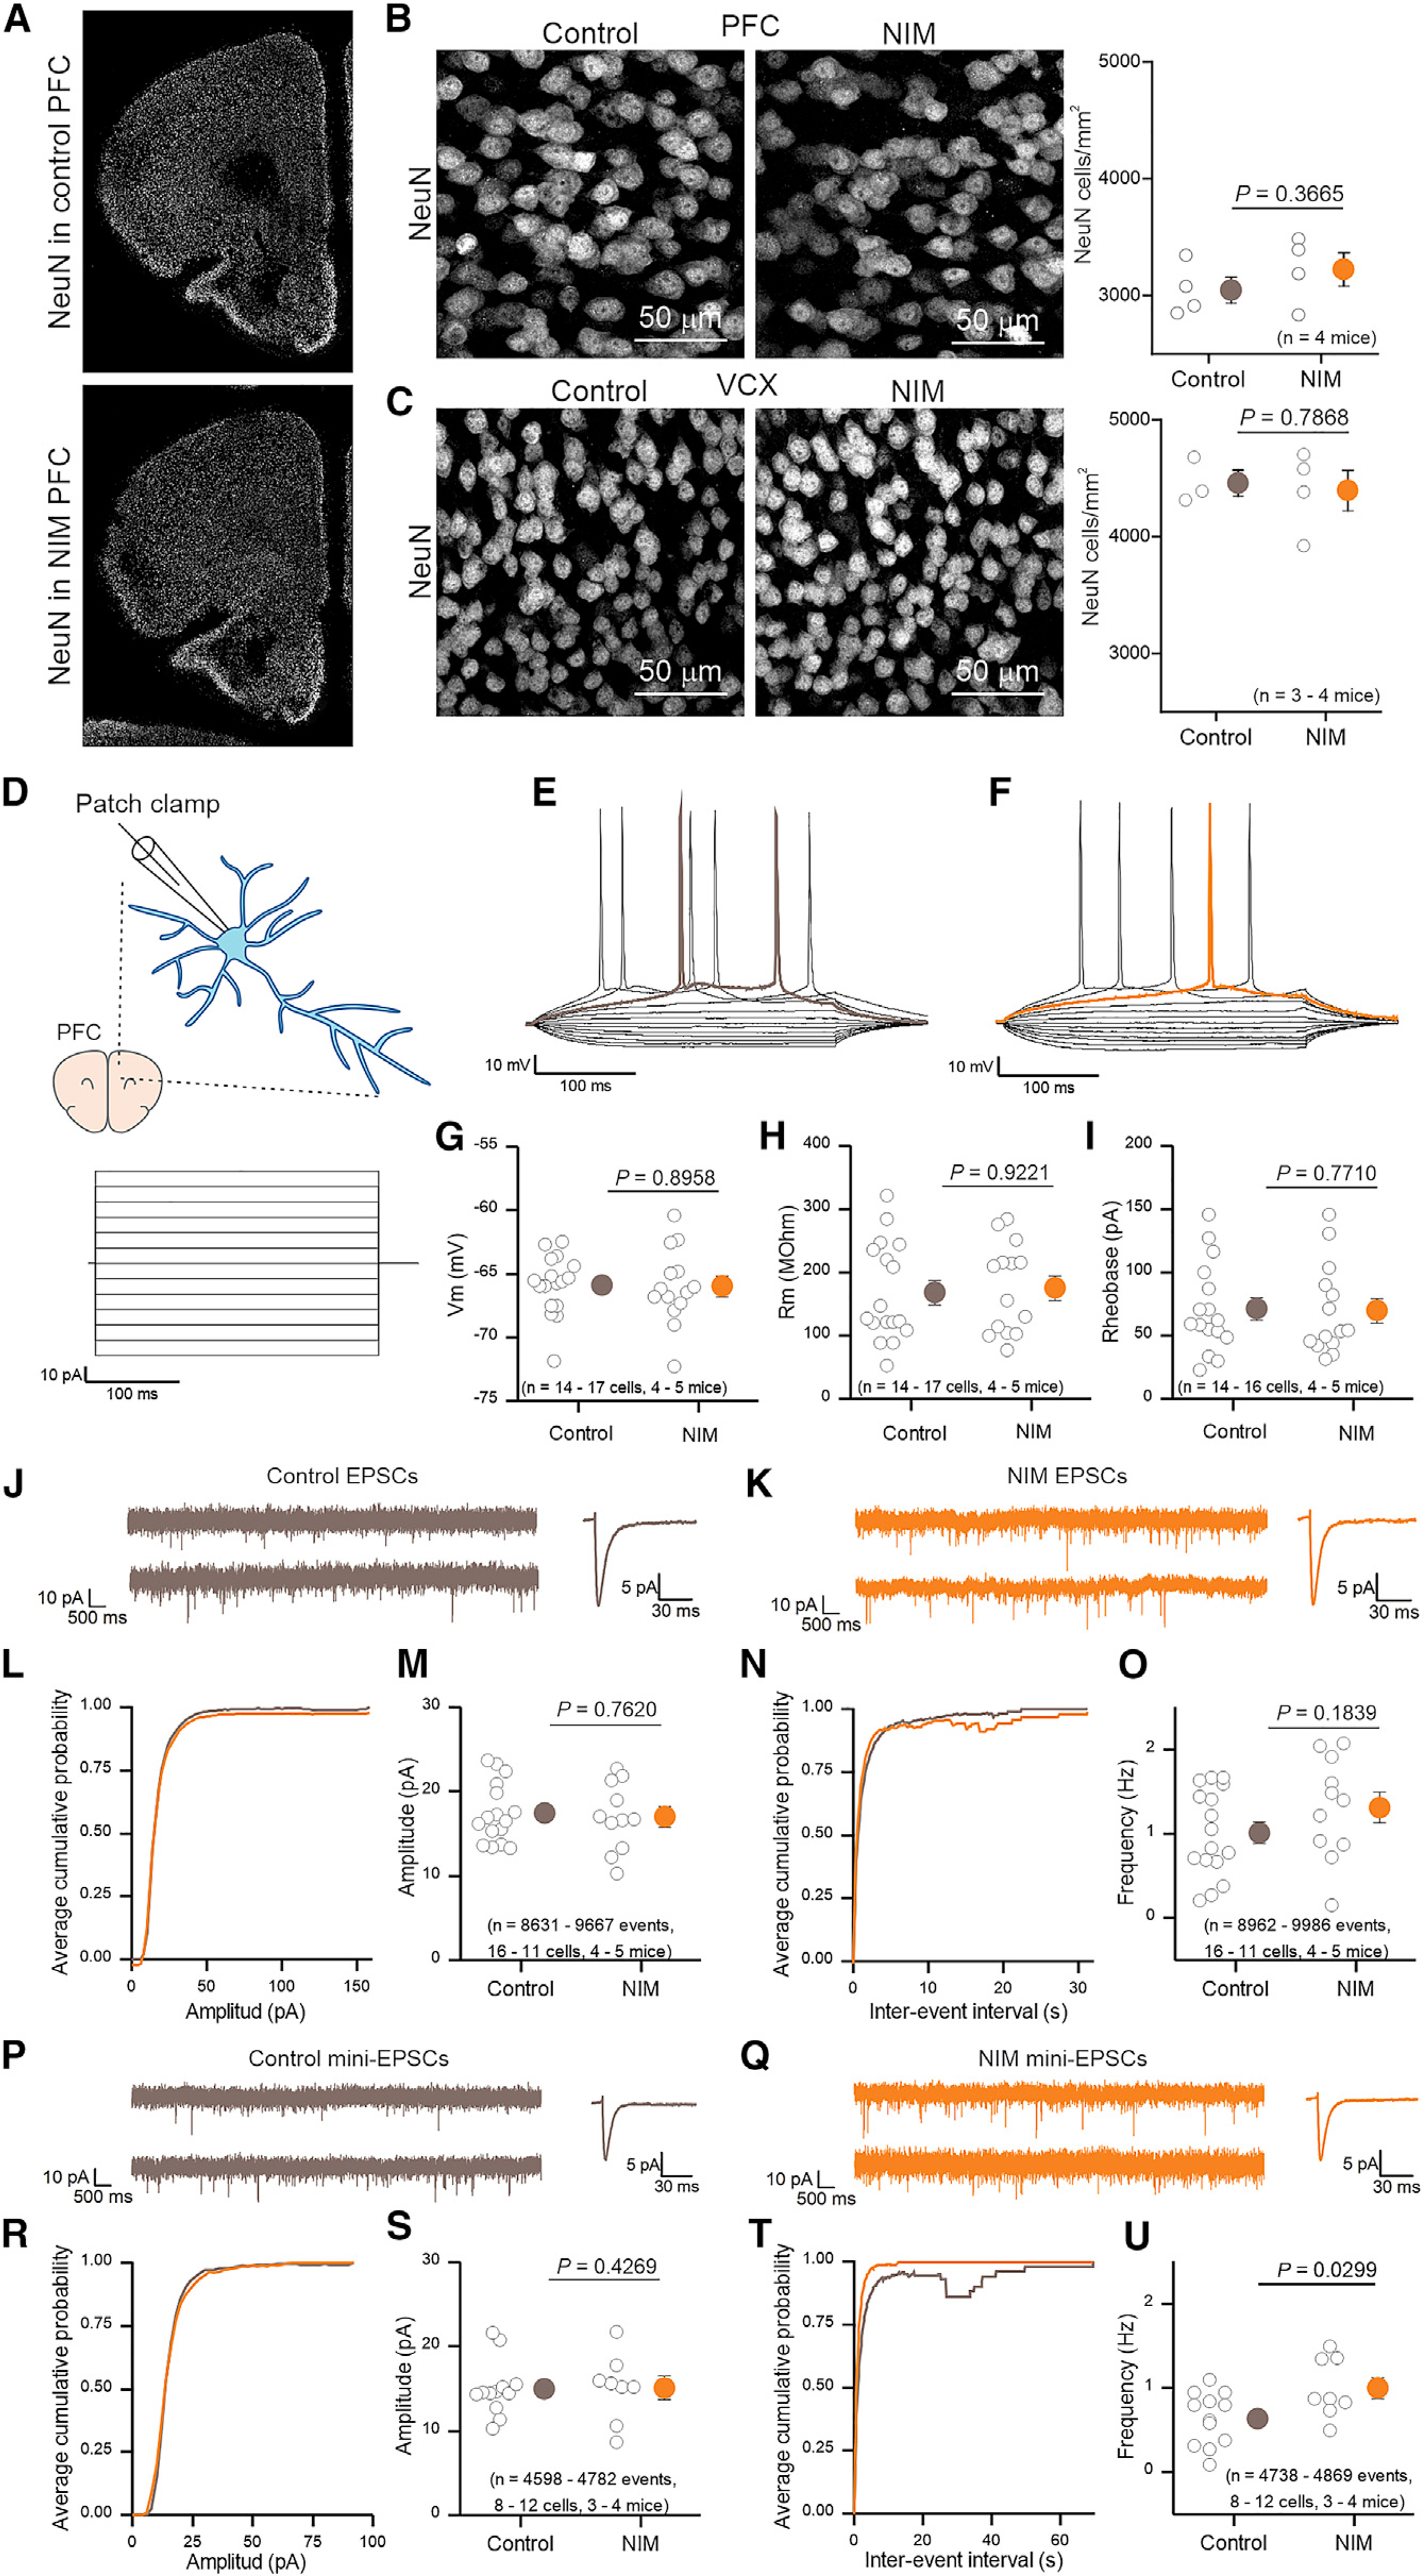
Astrocytic contributions to neuroinflammation are widely implicated in disease, but they remain incompletely explored. We assess medial prefrontal cortex (PFC) and visual cortex (VCX) astrocyte and whole-tissue gene expression changes in mice following peripherally induced neuroinflammation triggered by a systemic bacterial endotoxin, lipopolysaccharide, which produces sickness-related behaviors, including anhedonia. Neuroinflammation-mediated behavioral changes and astrocyte-specific gene expression alterations peak when anhedonia is greatest and then reverse to normal. Notably, region-specific molecular identities of PFC and VCX astrocytes are largely maintained during reactivity changes. Gene pathway analyses reveal alterations of diverse cell signaling pathways, including changes in cell-cell interactions of multiple cell types that may underlie the central effects of neuroinflammation. Certain astrocyte molecular signatures accompanying neuroinflammation are shared with changes reported in Alzheimer's disease and mouse models. However, we find no evidence of altered neuronal survival or function in the PFC even when neuroinflammation-induced astrocyte reactivity and behavioral changes are significant.

Keywords: LPS; RNA-seq; anhedonia; astrocyte; astrocyte reactivity; brain endothelial cell; cell communication; microglia; neuroinflammation; neuron; prefrontal cortex.


Conflict of interest statement

Declaration of interests B.S.K. is a consultant for Third Rock Ventures. The remaining authors declare no competing interests.

Figures

Figure 1.
Figure 1.. LPS-induced anhedonia, sickness behavior, and overall inflammatory responses
(A) Timeline for the neuroinflammation model (NIM) and its behavioral assessments. (B) Weight of control and LPS-injected animals before injection (0 days) and 1, 2, and 3 days after injection. ANOVA F (1.50, 61.74) = 11.84, p = 0.0002. n = 21–22 mice per group. (C) Time immobile during 6 min of open field test 1,2, and 3 days after injection. Baseline was generated with non-injected animals. ANOVA F (1.73, 51.86) = 12.39, p < 0.0001. n = 16 mice per group. (D) On the left of the graph, the bottle preference is shown when the mice are given the choice between two bottles of water 2 days before the injection (baseline). On the right, the sucrose preference test 1, 2, and 3 days after injection is shown. ANOVA F (1.72, 34.46) = 7.30, p = 0.0034. n = 11 cages, 24 mice per group. (E) One day after LPS or PBS i.p. injection, whole-tissue PFC RNA-seq detected 1,517 differentially expressed genes (DEGs) between NIM and control, with FDR < 0.05 and FPKM (fragments per kilobase of transcript per million mapped reads) > 1. n = 4 mice per group. (F) Principal component analysis of the top 2,000 most variable genes. (G) NIM versus control log2 ratio of known inflammatory molecules. (H) Top 20 pathways altered in NIM PFC astrocytes, identified by Ingenuity Pathway Analysis (IPA). Closed circles in graphs indicate mean ± SEM. In some cases, the error bars representing SEM are smaller than the symbol used for the mean. The statistical analyses for (B)–(D) were performed with two-way ANOVA for repeated measures. Time treatment interaction F and p values are reported above. **p < 0.01 > 0.001, ***p < 0.001 after a Tukey post hoc analysis for the interaction between time and treatment. IPA Z score indicates whether the pathway is predicted to be inhibited (blue) or activated (red). In some cases, activation or inhibition cannot be predicted (gray).
Figure 2.
Figure 2.. Cortical region-specific and neuroinflammation time-specific transcriptional alterations in astrocytes
(A–C) Principal component analysis (top 1,000 most variable genes) of NIM and control astrocyte RNA, from PFC and VCX, 1 (A), 2 (B) and 14 days (C) after LPS or PBS injection. (D) Number of astrocyte DEGs between 1-day control PFC and VCX (FDR < 0.05, FPKM > 1). (E) Number of astrocyte DEGs between 1-day NIM PFC and VCX (FDR < 0.05, FPKM > 1). (F) Overlap of PFC-enriched genes (compared to VCX) between 1-day control and NIM conditions. (G) Overlap of VCX-enriched genes (compared to PFC) between 1-day control and NIM conditions. (H) Top 20 PFC-enriched genes when compared to VCX in both 1-day control and NIM conditions (see F). (I) Top 20 VCX-enriched genes when compared to PFC in both 1-day control and NIM conditions (see G). (J and K) Number of PFC (J) or VCX (K) NIM versus control DEGs (FDR < 0.05, FPKM > 1) in astrocytes at 1, 2, and 14 days. (L) Overlap of 1-day NIM versus control DEGs between PFC and VCX (FDR < 0.05, FPKM > 1). (M) Overlap of NIM versus control astrocyte DEGs (FDR < 0.05, FPKM > 1) between PFC and VCX at 1 and 2 days. (N) Top 20 NIM versus control upregulated (top) and downregulated (bottom) genes that are common across 1-day PFC, 1-day VCX, 2-day PFC, and 2-day VCX astrocytes. (O) Top 20 NIM versus control upregulated (top) and downregulated (bottom) genes that are uniquely altered (FDR < 0.05, FPKM > 1) in 1-day PFC astrocytes. For the whole figure, n = 3–4 biological samples per group; each biological sample was generated from the tissue of two mice.
Figure 3.
Figure 3.. Assessment of PFC cell-specific responses during neuroinflammation from input RNA-seq
(A–C) Principal component analysis (top 2,000 most variable genes) of NIM and control input RNA, from PFC and VCX, 1 (A), 2 (B) and 14 days (C) after LPS/PBS injection. (D–E) Number of PFC (D) or VCX (E) NIM versus control DEGs (FDR < 0.05, FPKM > 1) in input samples at 1, 2, and 14 days. (F) tSNE (t-distributed stochastic neighbor embedding) plot of the mouse frontal cortex main cell types identified with single cell RNA (scRNA)-seq from a published dataset (http://dropviz.org; Saunders et al., 2018). (G) Pie charts indicating the proportion of 1-day input downregulated (left) and upregulated (right) genes that are enriched in each cell type listed in the legend below. The numbers in each section of the pie chart indicate the number of DEGs for that cell type. (H) Same as in (G) but for 2-day input samples. (I) Overlap of all cell-enriched NIM versus control DEGs between 1 and 2 days. (J) Overlap of microglia, endothelial, projection neuron (P. Neuron), astrocyte, and oligodendrocyte NIM versus control DEGs between 1 and 2 days. (K) Bar graph representing the 2 day/1 day ratio of the number of DEGs for all cell-enriched genes (input), microglia (M), endothelial cells (E), projection neurons (P-N), astrocytes (A), and oligodendrocytes (O). For the whole figure, n = 3–4 biological samples per group; each biological sample was generated from tissue of two mice.
Figure 4.
Figure 4.. PFC cell-specific altered pathways and cell-cell interaction mechanisms
(A and B) Top 10 IPA pathways identified for the microglia-enriched DEGs at 1 day (A) or 2 days (B). (C) Overlap of the identified IPA pathways from microglia-enriched DEGs between 1 and 2 days. (D–O) Same as (A)–(C) but for endothelial cells (D–F), projection neurons (G–I), astrocytes (J–L), or oligodendrocytes (M–O). (P and Q) Homotypic (P) and heterotypic (Q) adhesion and ligand-receptor cell-cell interaction mechanisms that are altered in NIM. The arrows indicate the directionality of the signal, e.g., ligand → receptor. (R) Differentially expressed upstream regulators of microglia, endothelial cells, projection neurons, and astrocyte DEGs. The upstream regulators could be receptors, ligands, or transcription factors (TFs) that are expressed in the same cell, or in the neighboring ones: microglia (M), endothelial cells (E), projection neurons (P-N), astrocytes (A), or dendrocytes (O). For the whole figure, n = 3–4 biological samples per group; each biological sample was generated from tissue of two mice.
Figure 5.
Figure 5.. Astrocyte reactivity in PFC and VCX astrocytes
(A) NIM versus control RNA-seq differential expression of the top astrocyte reactivity genes in 1-, 2-, and 14-day PFC and VCX astrocytes. In the heatmaps, red indicates upregulation and blue indicates downregulation when comparing NIM versus control. An asterisk indicates the genes that were differentially expressed with FDR < 0.05. n = 3–4 biological samples per group; each biological sample was generated from tissue of two mice. (B) Representative immunostaining of S100β in PFC brain slices. (C and D) Representative images from GFAP staining and area % coverage of GFAP in control and NIM PFC (C) or VCX (D). n = 9 mice per group in (C) and 4 mice per group in (D). (E and F) Representative images from S100β staining and number of S100β-positive cells per mm2 in control and NIM PFC (E) or VCX (F). n = 3–4 mice per group. (G and H) Representative images from Iba1 staining and number of Iba1-positive cells per mm2 in control and NIM PFC (G) or VCX (H). n = 4 mice per group. In the scatterplots, open circles are raw data with closed circles indicating mean ± SEM. In some cases, the error bars representing SEM are smaller than the symbol used for the mean. Scale bars, 50 μm. Note that in (C), the number of mice is greater for the GFAP evaluations. This is because all of the experiments shown in this figure were not performed in parallel, and thus we included GFAP in all such evaluations as an internal reference, which meant its n number was higher.
Figure 6.
Figure 6.. Functional and morphological alterations of PFC astrocytes during neuroinflammation
(A) Representative images of 2-day control and NIM PFC astrocytes filled by lucifer yellow iontophoresis. (B–D) Volume of soma (B), territory (C), and branches + processes (D) of 2-day control and NIM astrocytes. Cell compartment volumes were calculated with Imaris software. (E) Number of branches that ramify from the soma of 2-day control and NIM astrocytes. n = 15–16 cells from five to seven mice per group. (F and G) Whole-cell voltage clamp was performed on 2-day control (F) and NIM (G) astrocytes before and in the presence of 250 μM Ba2+. On the left, representative waveforms for total and Ba2+ insensitive currents are shown. On the right, average current-voltage relationships are shown. (H) On the left, representative waveforms for control and NIM Ba2+-sensitive currents are shown. On the right, average current-voltage relationships for control and NIM Ba2+-sensitive currents are shown. (I) Membrane potential of control and NIM astrocytes before and during Ba2+. (J) Conductance of control and NIM astrocytes before and during Ba2+. n = 11 cells from four to five mice per group. (K) Representative traces of 2-day control and NIM spontaneous Ca2+ signals (in 300 nM TTX) in soma, branches, and processes. The amplitude of Ca2+ signals is higher in control somas and branches than in NIM; however, Ca2+ signals are more frequent in the processes of NIM than in control (Table S1). (L and M) Single (gray) and average (brown or orange) traces of astrocyte soma and branch Ca2+ increase in response to 1-min exposure to 100 μM ATP (L) or 10 μM phenylephrine (PE) (M). In the scatterplots, open circles are raw data, with closed circles indicating mean ± SEM. In some cases, the error bars representing SEM are smaller than the symbol used for the mean. Scale bars, 20 μm.
Figure 7.
Figure 7.. Neuronal and synaptic properties of PFC pyramidal neurons during neuroinflammation
(A) Representative immunostaining of NeuN in PFC brain slices. (B and C) Representative images from NeuN staining and number of NeuN-positive cells per mm2 in control and NIM PFC (B) or VCX (C). n = 4 mice per group. (D) Whole-cell current clamp was performed in 2-day NIM and control PFC pyramidal neurons. 10-pA steps were applied during 300 ms. (E and F) Representative voltage waveforms from control (E) and NIM (F). Rheobase trace is highlighted in brown for control and orange for NIM. (G–I) Control and NIM pyramidal neuron membrane potential (G), membrane resistance (H), and rheobase (I). n = 14–17 cells from four to five mice per group. (J and K) Representative EPSC (10 μM bicuculline) current clamp recording and single EPSC example from control (J) and NIM (K) PFC pyramidal neurons. (L) Average cumulative probability plot for EPSC amplitude. (M) EPSC average amplitude for 2-day control and NIM PFC pyramidal neurons. n = 8,631–9,667 events from 11–16 cells from four to five mice per group. (N) Average cumulative probability plot for EPSC inter-event intervals. (O) EPSCs frequency for 2-day control and NIM PFC pyramidal neurons in a 10-min recording. n = 8,962–9,986 events from 11–16 cells from four to five mice per group. (P and Q) Representative mini-EPSC (10 μM bicuculline and 300 nM TTX) current clamp recording and single mini-EPSC example from control (P) and NIM (Q) PFC pyramidal neurons. (R) Average cumulative probability plot for mini-EPSC amplitude. (S) Mini-EPSC average amplitude for 2-day control and NIM PFC pyramidal neurons. n = 4,598–4,782 events from 8–12 cells from three to four mice per group. (T) Average cumulative probability plot for mini-EPSC inter-event intervals. (U) Mini-EPSCs frequency for 2-day control and NIM PFC pyramidal neurons in a 10-min recording. N = 4,738–4,869 events from 8–12 cells from three to four mice per group. In the scatterplots, open circles are raw data with closed circles indicating mean ± SEM. In some cases, the error bars representing SEM are smaller than the symbol used for the mean. Scale bars, 20 μm.

References

    1. Barnes J, Mondelli V, and Pariante CM (2017). Genetic contributions of inflammation to depression. Neuropsychopharmacology 42, 81–98. - PMC - PubMed
    1. Barres BA (2008). The mystery and magic of glia: A perspective on their roles in health and disease. Neuron 60, 430–440. - PubMed
    1. Ben Haim L, and Rowitch DH (2017). Functional diversity of astrocytes in neural circuit regulation. Nat. Rev. Neurosci 18, 31–41. - PubMed
    1. Bennett FC, and Molofsky AV (2019). The immune system and psychiatric disease: A basic science perspective. Clin. Exp. Immunol 197, 294–307. - PMC - PubMed
    1. Bhattacharya A, Lord B, Grigoleit JS, He Y, Fraser I, Campbell SN, Taylor N, Aluisio L, O’Connor JC, Papp M, et al. (2018). Neuropsychopharmacology of JNJ-55308942: Evaluation of a clinical candidate targeting P2X7 ion channels in animal models of neuroinflammation and anhedonia. Neuropsychopharmacology 43, 2586–2596. - PMC - PubMed

Publication types

Substances