. 2021 Aug 10;36(6):109512.
doi: 10.1016/j.celrep.2021.109512.

Actinin BioID reveals sarcomere crosstalk with oxidative metabolism through interactions with IGF2BP2

Affiliations

Actinin BioID reveals sarcomere crosstalk with oxidative metabolism through interactions with IGF2BP2

Feria A Ladha et al. Cell Rep. .

Abstract

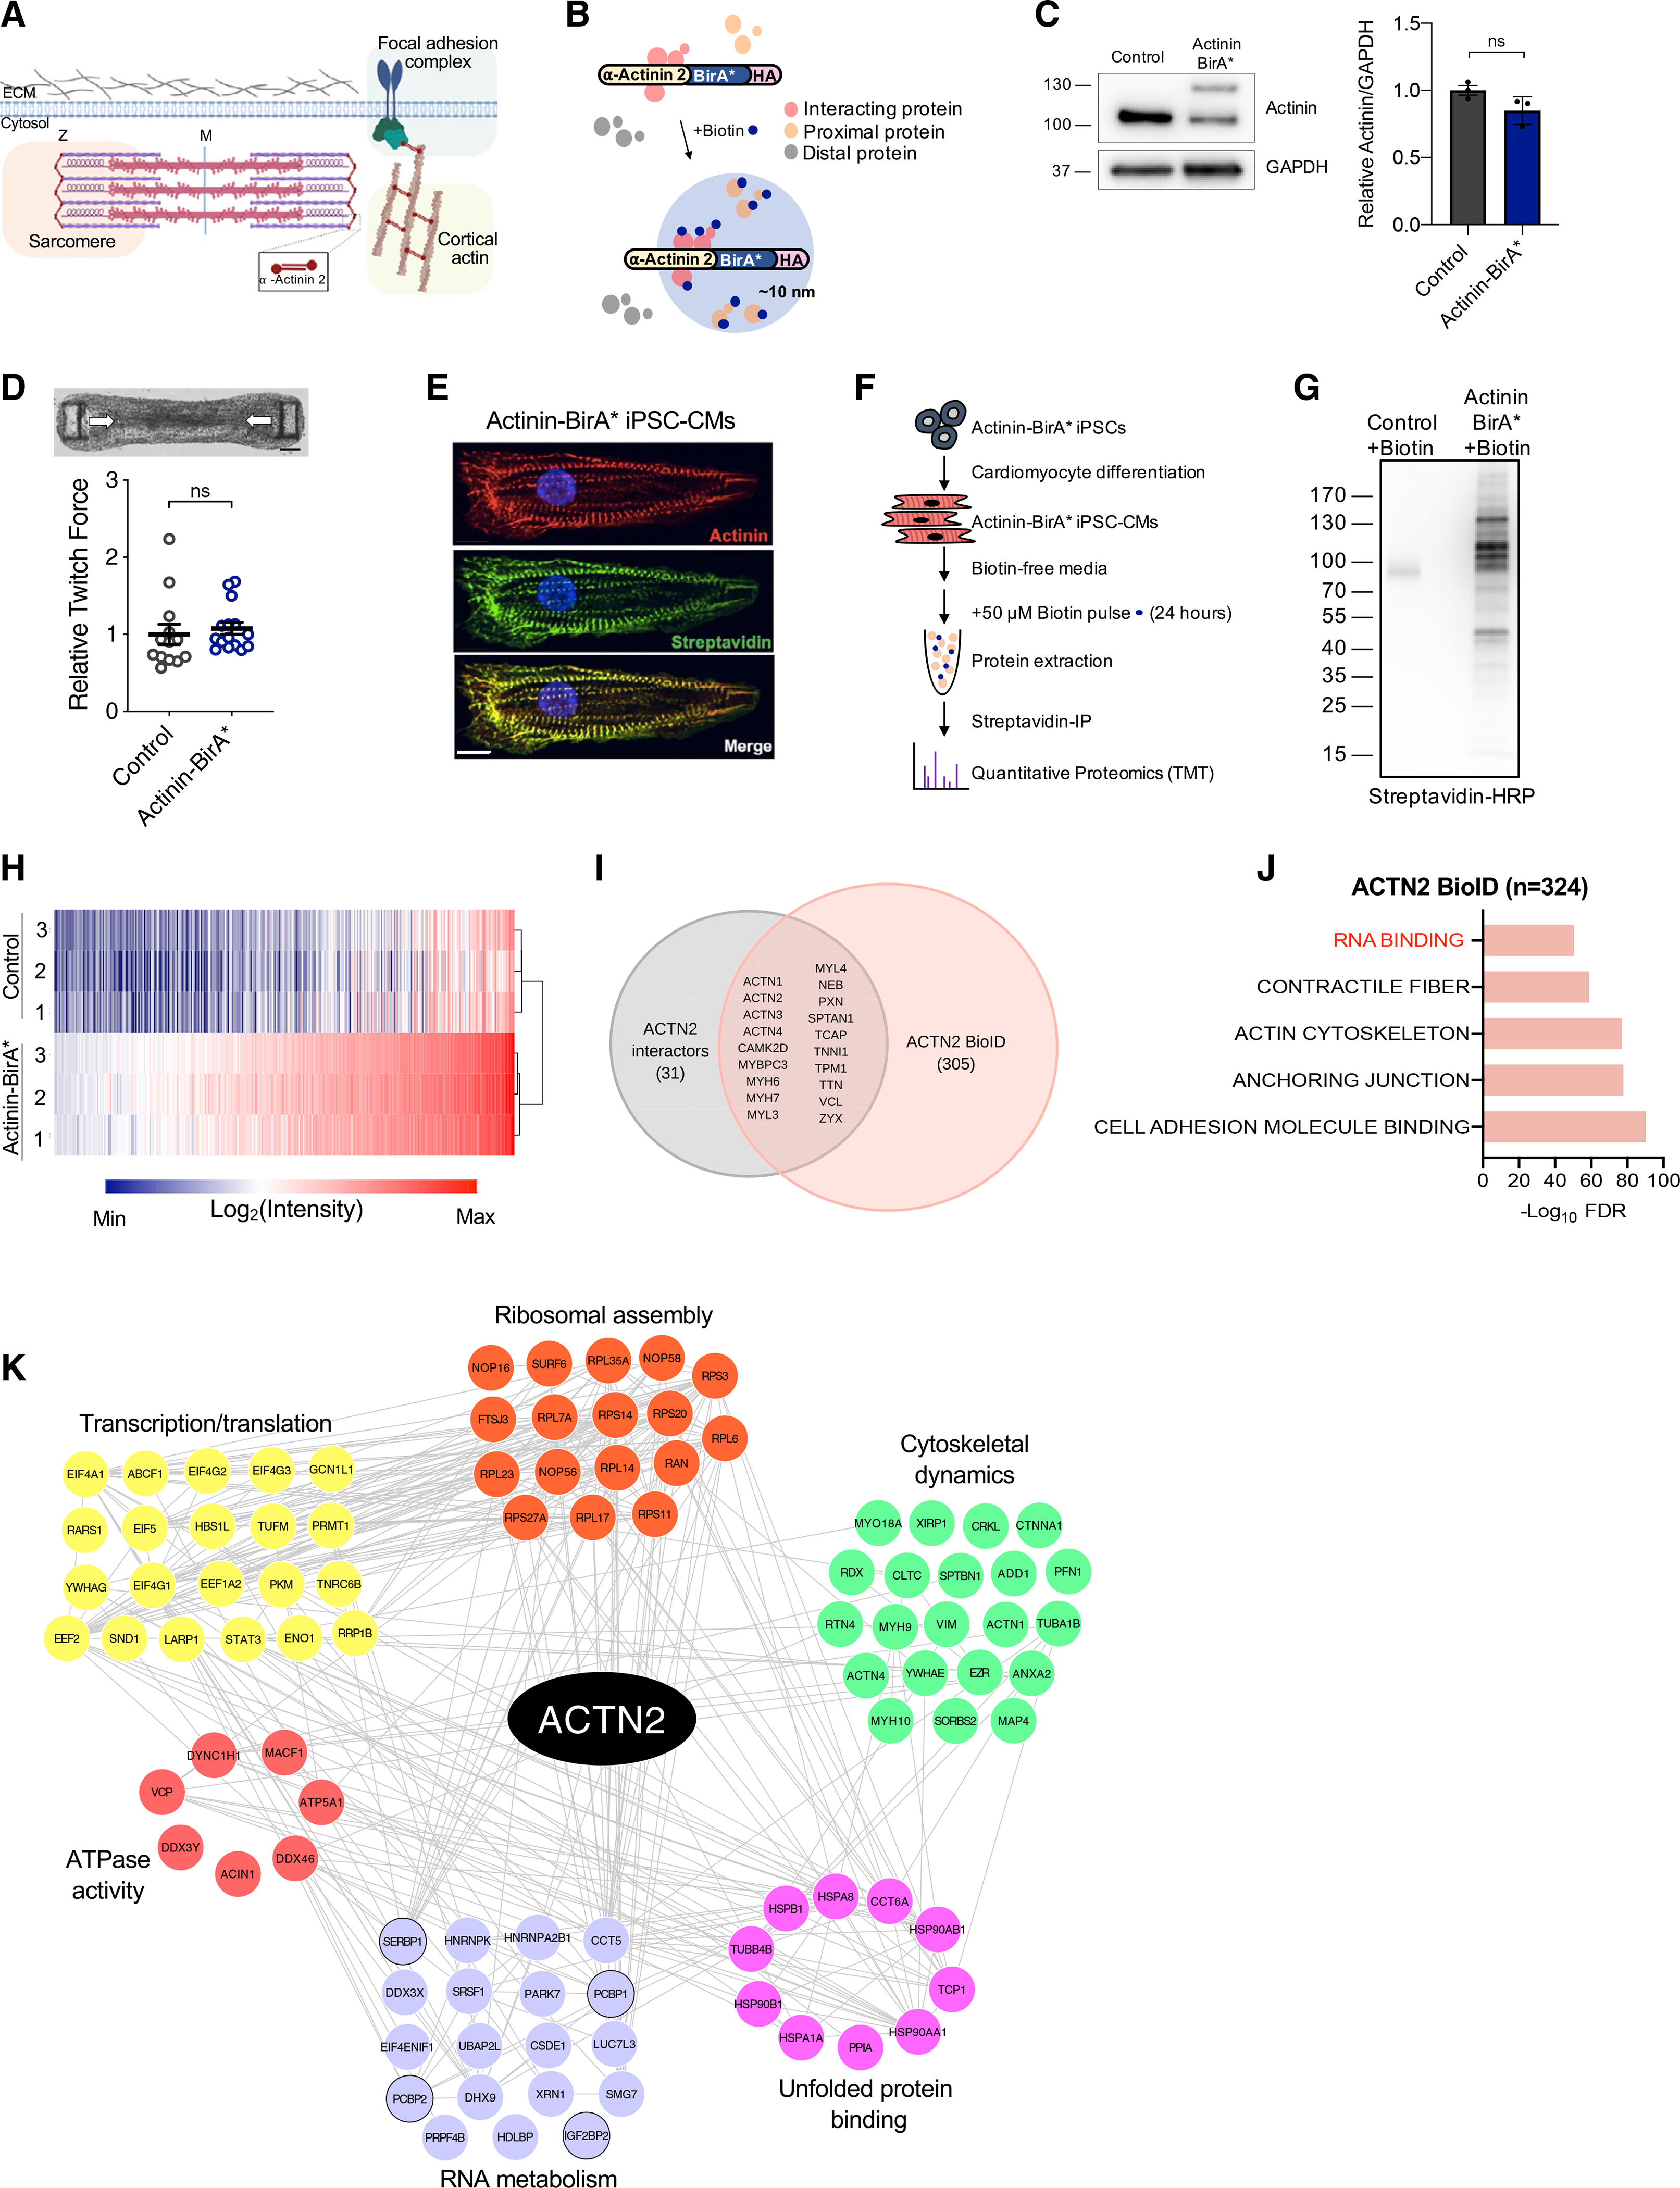
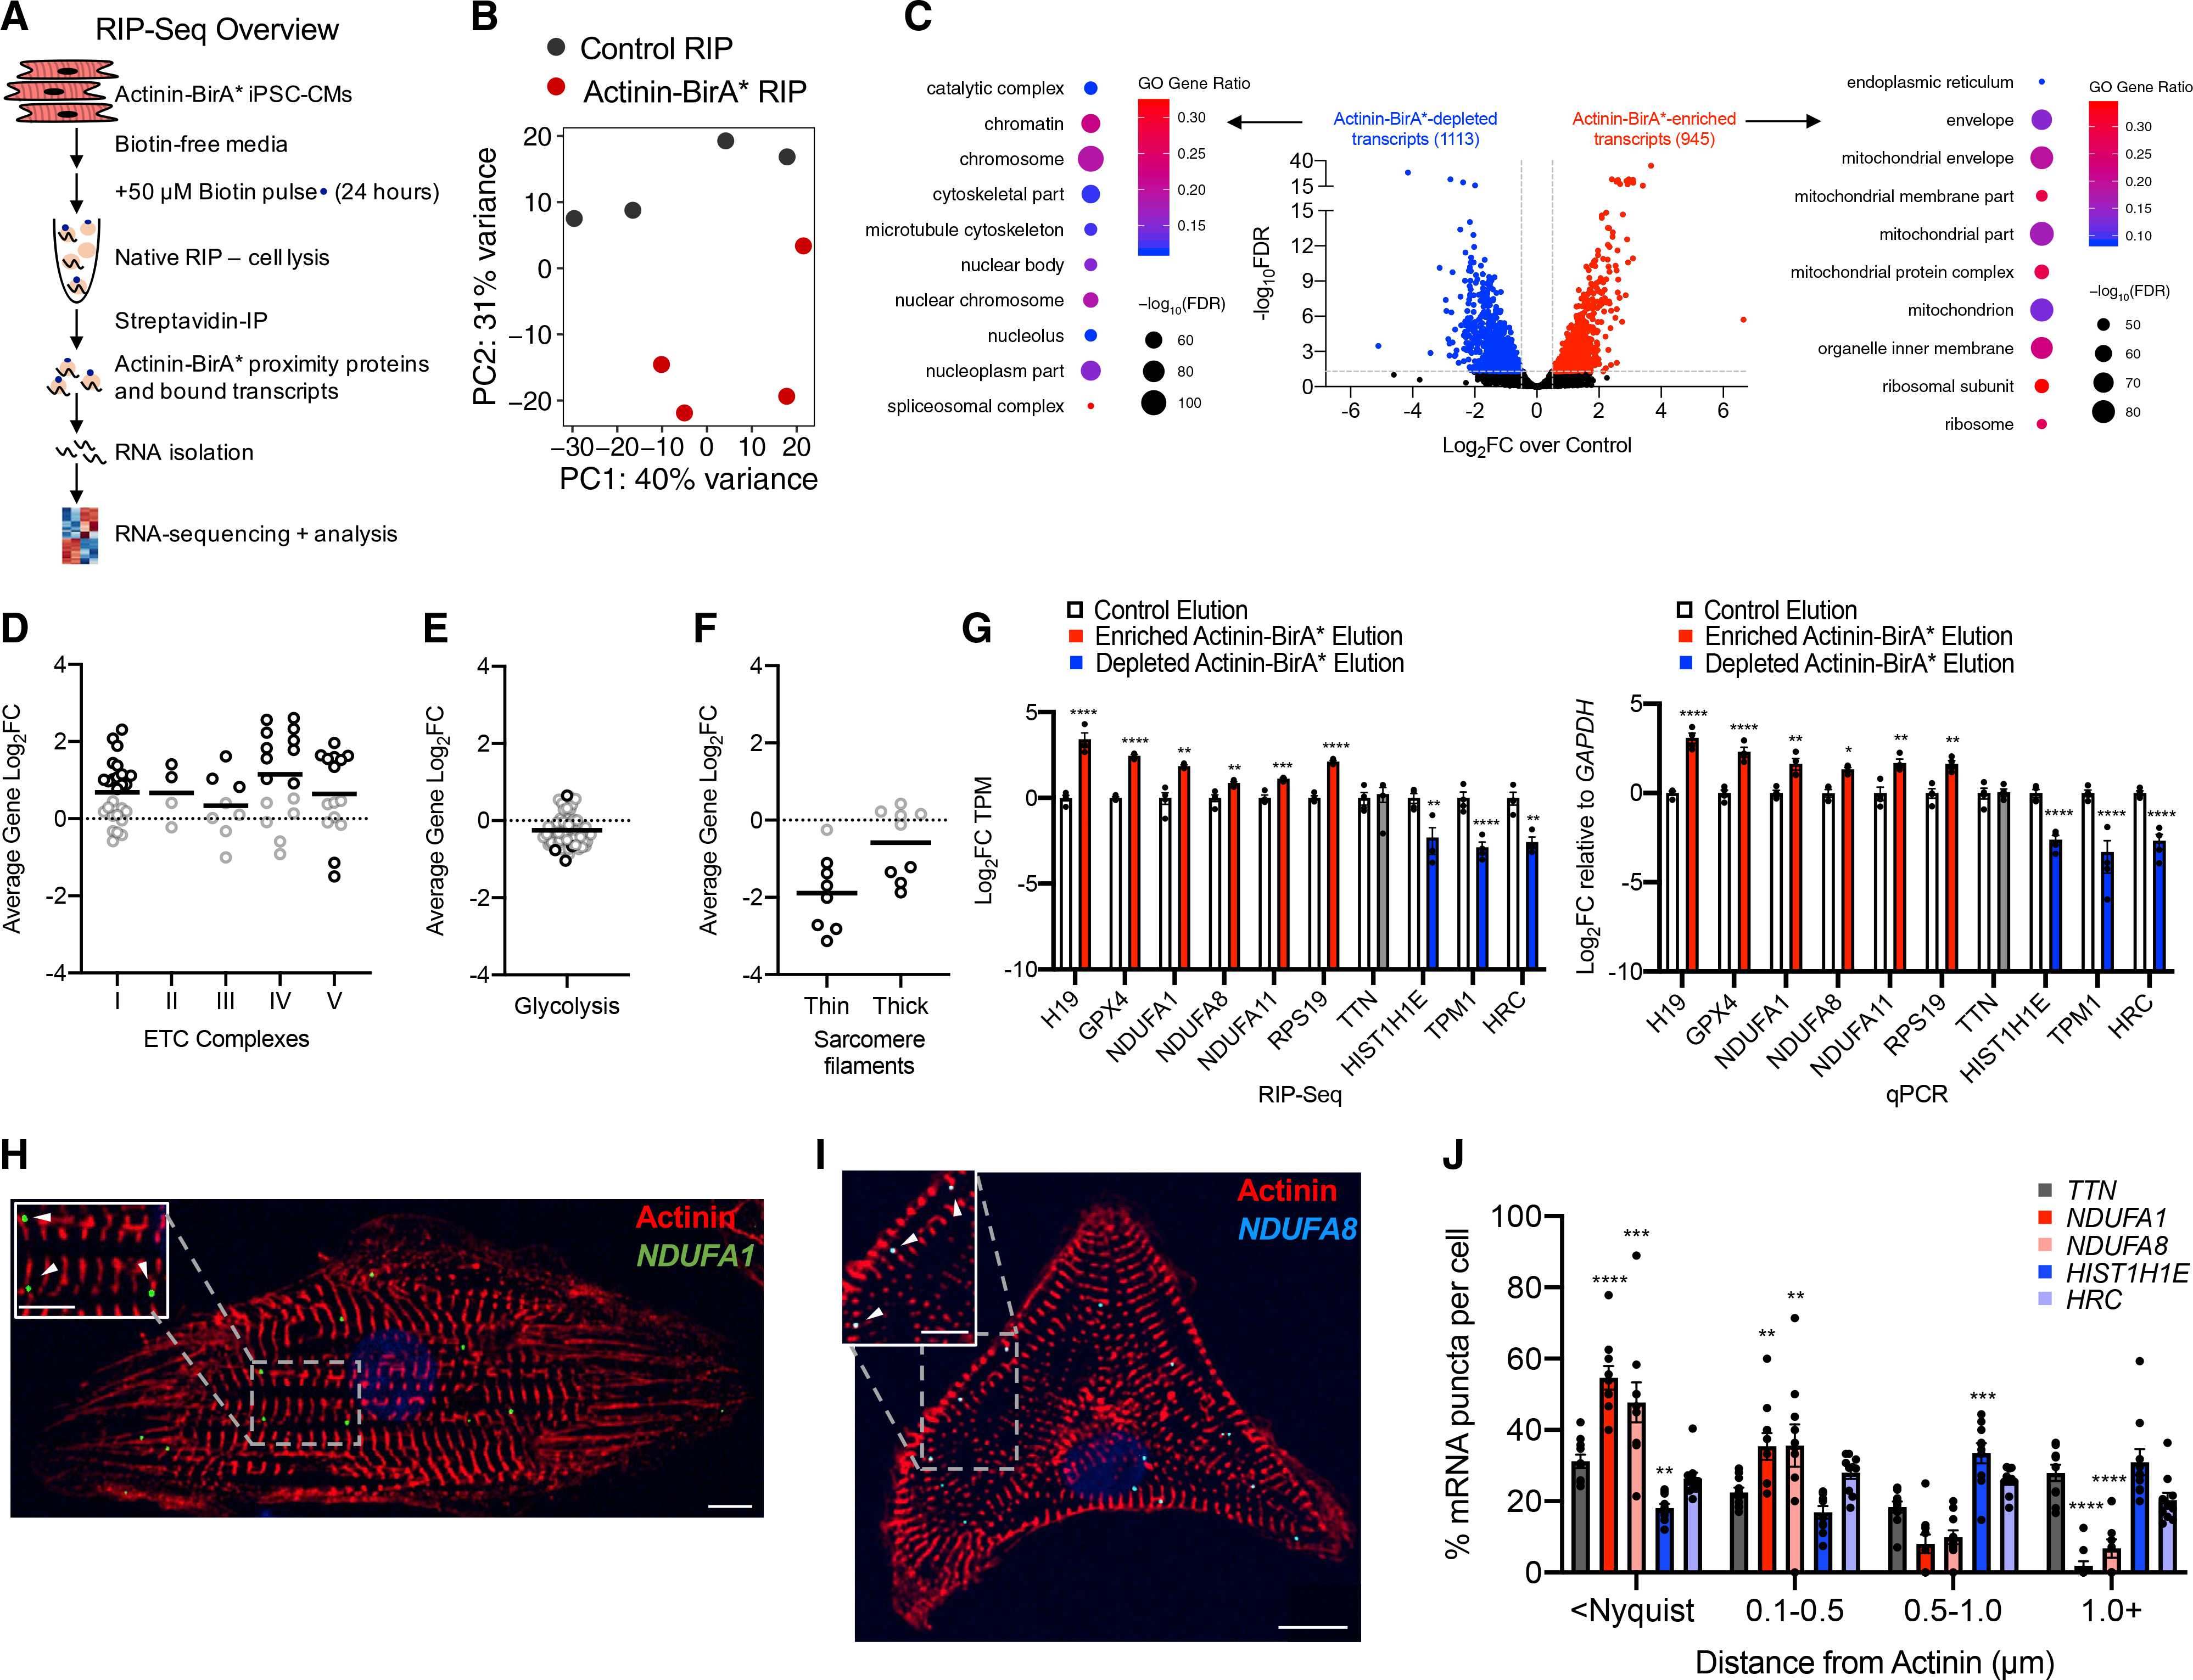
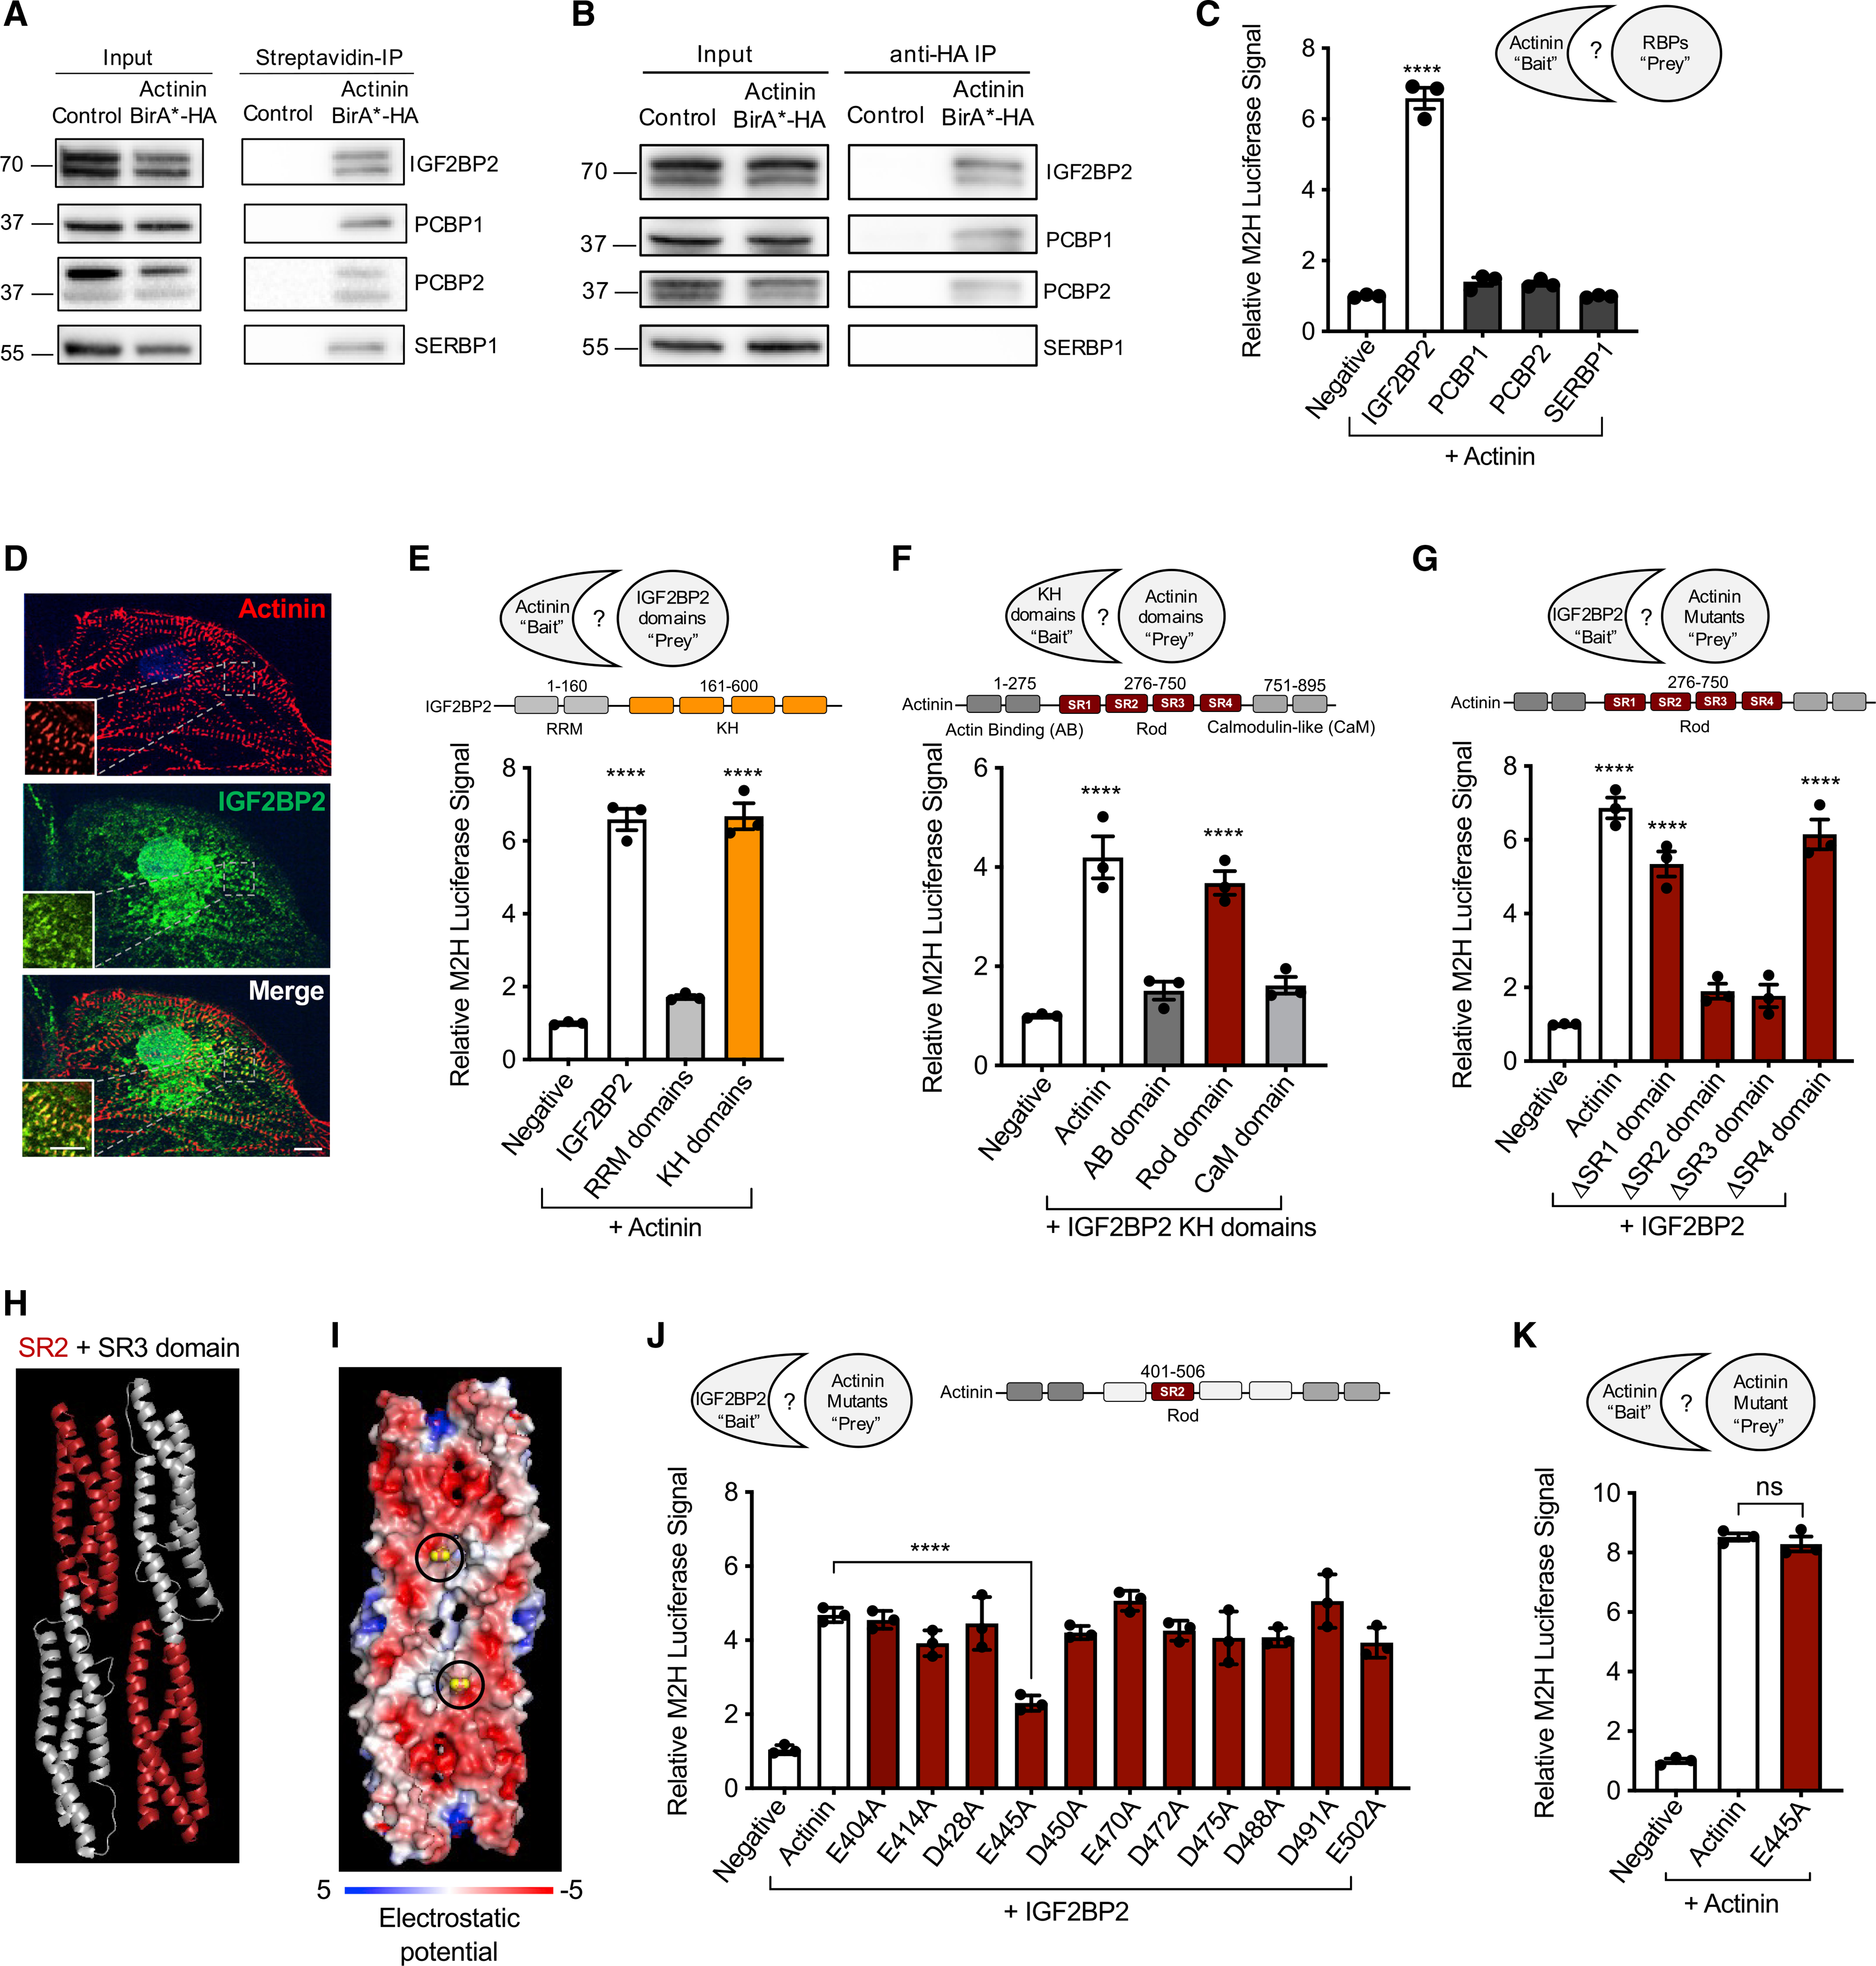
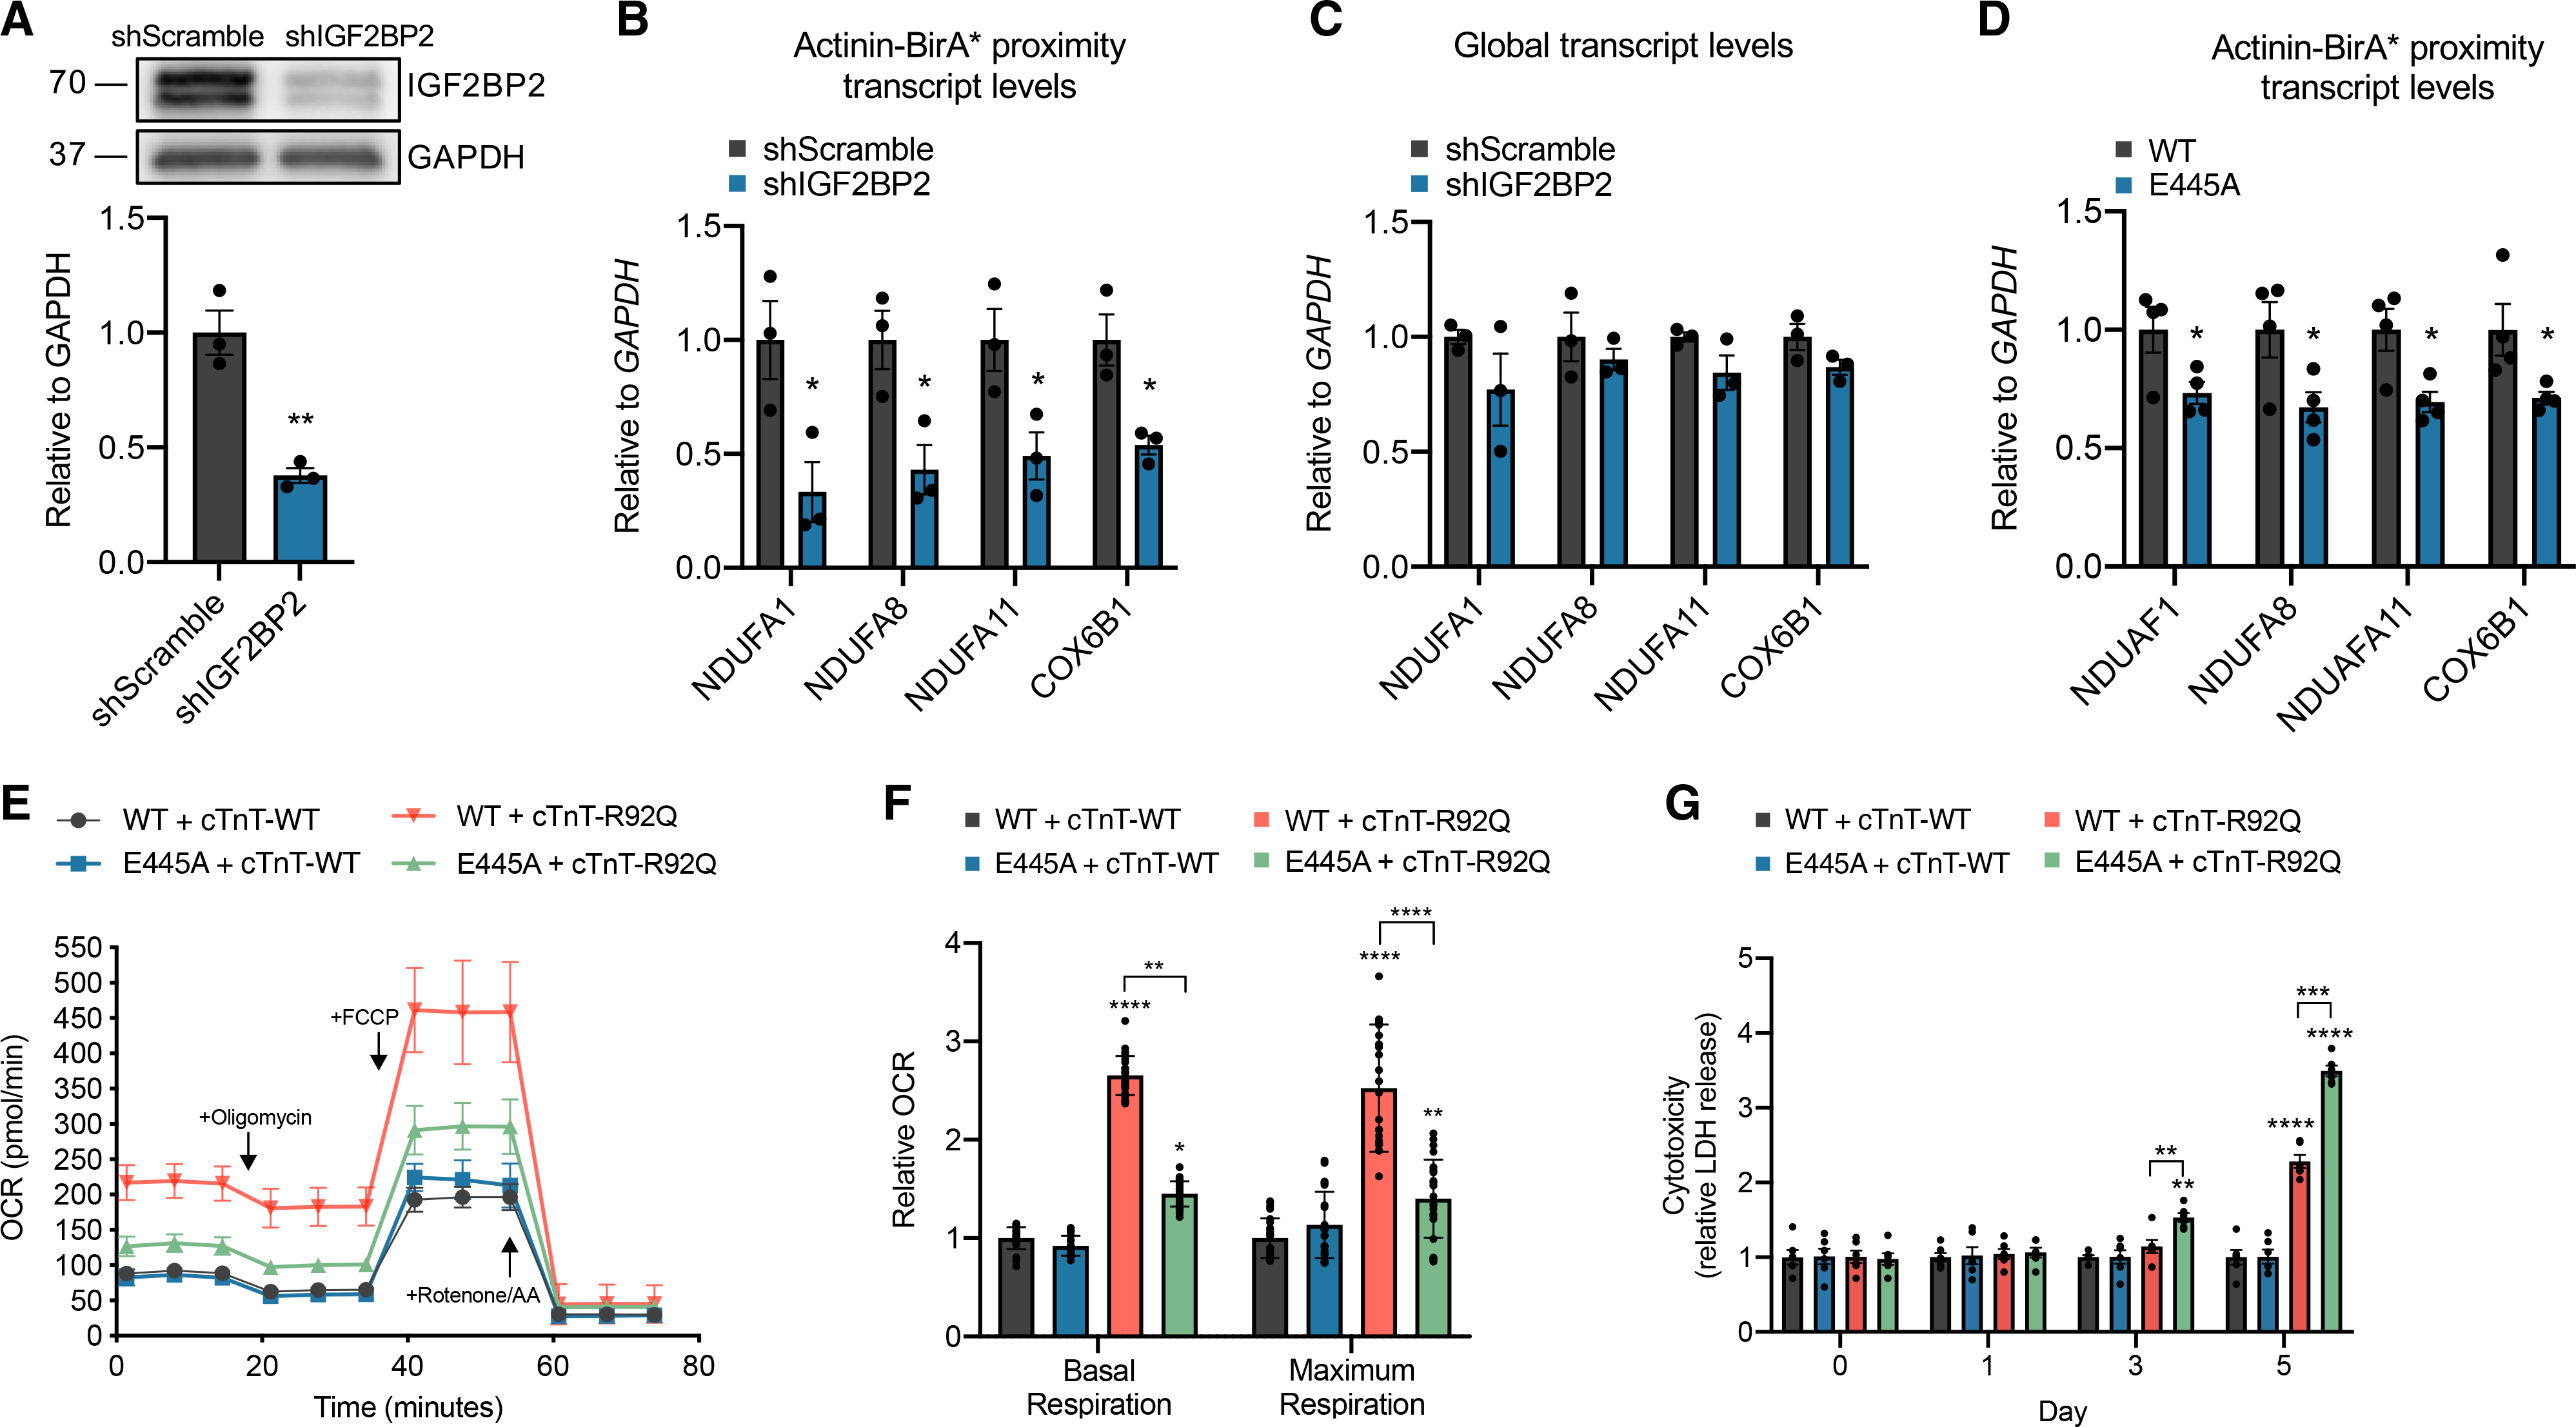
Actinins are strain-sensing actin cross-linkers that are ubiquitously expressed and harbor mutations in human diseases. We utilize CRISPR, pluripotent stem cells, and BioID to study actinin interactomes in human cardiomyocytes. We identify 324 actinin proximity partners, including those that are dependent on sarcomere assembly. We confirm 19 known interactors and identify a network of RNA-binding proteins, including those with RNA localization functions. In vivo and biochemical interaction studies support that IGF2BP2 localizes electron transport chain transcripts to actinin neighborhoods through interactions between its K homology (KH) domain and actinin's rod domain. We combine alanine scanning mutagenesis and metabolic assays to disrupt and functionally interrogate actinin-IGF2BP2 interactions, which reveal an essential role in metabolic responses to pathological sarcomere activation using a hypertrophic cardiomyopathy model. This study expands our functional knowledge of actinin, uncovers sarcomere interaction partners, and reveals sarcomere crosstalk with IGF2BP2 for metabolic adaptation relevant to human disease.

Keywords: BioID; IGF2BP2; RNA-binding proteins; Z-disc; actinin; mRNA localization; oxidative phosphorylation; protein-protein interactions; quantitative proteomics; sarcomere.


Conflict of interest statement

Declaration of interests The authors declare no competing interests.

Figures

Figure 1.
Figure 1.. BioID to identify actinin proximity partners through sarcomere assembly
(A) Overview of actinin localization in cardiomyocytes including sarcomere Z-disk, focal adhesion, and cortical actin cytoskeleton. (B) Overview of the BioID method using Actinin-BirA* fusion to study actinin-proximal protein networks. (C) Actinin-BirA* and control non-BirA* iPSC-CM lysates were probed with anti-actinin and anti-GAPDH antibodies to identify (left) and quantify (right) Actinin-BirA* fusion (~130 kD) and endogenous actinin (~100 kD). (D) Actinin-BirA* cardiac microtissues have similar twitch force compared to non-BirA* controls (n = 12–15) (scale bar, 150 μm). (E) Confocal micrograph of Actinin-BirA* iPSC-CMs decorated with antibodies to actinin (red), streptavidin-AF488 (green), and DAPI DNA co-stain (blue) (scale bar, 10 μm). (F) Overview of BioID experimental methods. (G) iPSC-CM lysates were probed with streptavidin-horseradish peroxidase (HRP) to examine Actinin-BirA*-biotinylated proteins. (H) Heatmap and hierarchical clustering of log2-transformed intensity values for the 324 Actinin-BirA* hits (L2FC ≥ 1 and FDR < 0.05 relative to control non-BirA*) from combined TMT experiments. (I) Venn diagram of ACTN2 BioID protein dataset (red circle) and published ACTN interactors obtained from STRING where ACTN was bait (gray circle). (J) 324 proteins from ACTN2 BioID were analyzed by GO and key enrichment terms are listed. (K) ACTN2 BioID proteins in RNA-binding GO term were uploaded to STRING for subnetwork analysis. The resulting network was imported into Cytoscape (v. 3.7.2) and CLUSTER and BINGO features were utilized for clustering and GO term identification. Hits that were additionally studied are circled in black. Data are n ≥ 3 (C and D); mean ± SEM; significance assessed by Student’s t test (C and D) or two-way ANOVA followed by a two-stage linear step-up procedure of Benjamini, Krieger, and Yekutieli to correct for multiple comparisons (H) and defined by p > 0.05 (ns) (C and D). See also Figure S1 and Video S1.
Figure 2.
Figure 2.. Identification of transcripts bound to RNA-binding proteins in actinin neighborhoods
(A) Overview of modified RIP-seq protocol to study RNA transcripts bound to RNA-binding proteins in actinin neighborhoods by streptavidin affinity purification of RNA-binding proteins followed by RNA isolation and sequencing. (B) PCA plot shows clustering of Actinin-BirA* RIP-seq samples relative to non-BirA* controls (n = 4). (C) Volcano plot of RIP-seq data shaded red for 945 enriched transcripts (FDR < 0.05, L2FC ≥ 0.5) or blue for 1,113 depleted transcripts (FDR < 0.05, L2FC ≤ −0.5). Differentially enriched transcripts were analyzed by GO and enrichment terms are listed for enriched and depleted transcripts. (D) ETC gene components spanning respiratory chain complex I-V proteins are enriched on average. Each circle represents a single ETC gene; black circle for statistically significant transcript. (E) Glycolysis gene components are not enriched on average. Each circle represents a single glycolysis gene. (F) Thin and thick filament sarcomere are depleted on average. Each circle represents a single sarcomere gene. (G) qPCR validation of candidate RIP-seq hits (n = 4). (H) Representative confocal micrograph of iPSC-CMs decorated with antibodies to actinin (red), DAPI DNA co-stain (blue), and RNA FISH probes against NDUFA1 (green) (scale bars: main image, 10 μm; inset, 5 μm). (I) Representative confocal micrograph of iPSC-CMs decorated with antibodies to actinin (red), DAPI DNA co-stain (blue), and RNA FISH probes against NDUFA8 (cyan) (scale bars: main image, 10 μm; inset, 5 μm). (J) Quantification of RNA proximity to actinin protein. Statistics are relative to TTN. Data are derived from n = 10 cells. Data are mean ± SEM; significance assessed by Benjamini Hochberg method (C) or ANOVA using Holm-Sidak correction for multiple comparisons (G and J) and defined by p < 0.05 (*), p ≤ 0.01 (**), p ≤ 0.001 (***), p ≤ 0.0001 (****) unless otherwise stated. See also Figure S2.
Figure 3.
Figure 3.. Fine mapping actinin interactions with the RNA-binding protein IGF2BP2
(A) Representative immunoblot probed with antibodies to IGF2BP2, PCPB1, PCPB2, and SERBP1 in streptavidin affinity-purified iPSC-CM lysates. Double band represents two IGF2BP2 splice products. (B) Representative immunoblot probed with antibodies to IGF2BP2, PCPB1, PCPB2, and SERBP1 in anti-HA immunoprecipitated iPSC-CM lysates. (C) M2H (conducted in HEK293T cells) results demonstrating that IGF2BP2 interacts with full-length actinin, but not PCBP1, PCPB2, or SERBP1. (D) Representative confocal micrograph demonstrating partial colocalization of actinin (anti-actinin; red) with IGF2BP2 (anti-IGF2BP2; green) with DAPI DNA (blue) co-stain in iPSC-CMs (scale bars: main image, 10 μm; inset, 5 μm). (E) M2H study conducted to fine map the direct interaction between actinin and IGF2BP2. IGF2BP2 was divided into RRM (residues 1–160) and KH (residues 161–600) domains to fine map the interaction. (F) M2H results to map the direct interaction between the KH domain of IGF2BP2 and Actinin. Actinin was divided into AB (residues 1–275), rod (residues 276–750), and CaM domains (residues 751–895). (G) M2H results to map IGF2BP2’s interaction within actinin rod domain through deletions of each spectrin repeat (SR). (H) Ribbon structure PyMOL of actinin’s SR2 and SR3 domains (SR2 highlighted in red). (I) Visualization of electrostatic potential of SR2 and SR3 domains. Actinin residue E445 circled in diagram and shaded yellow. (J) M2H alanine scanning mutagenesis results within actinin SR2 domain with IGF2BP2 demonstrates partial disruption by E445A. (K) M2H results demonstrating preservation of wild-type (WT) actinin interaction with E445A actinin. All data are n = 3 and mean ± SEM; significance assessed by ANOVA using Holm-Sidak correction for multiple comparisons (C, E, F, G, J, and K) and defined by p > 0.05 (ns), p ≤ 0.0001 (****). See also Figure S3.
Figure 4.
Figure 4.. Actinin-IGF2BP2 interactions regulate ETC transcript localization to actinin neighborhoods and metabolic adaptation to hypercontractility in an HCM model
(A) Representative immunoblot of lysates from iPSC-CMs treated with shRNA targeting IGF2BP2 or scramble control probed with antibodies to IGF2BP2 and GAPDH. (B) Streptavidin affinity purification of transcripts bound to RNA-binding proteins in actinin neighborhoods after IGF2BP2 knockdown, followed by qPCR of ETC transcripts NDUFA1, NDUFA8, NDUFA11, and COX6B1. (C) qPCR analysis of global transcript levels of NDUFA1, NDUFA8, NDUFA11, and COX6B1 after IGF2BP2 knockdown. (D) Streptavidin affinity purification of transcripts bound to actinin-proximal RNA-binding proteins with overexpressing lenti-Actinin-WT or lenti-Actinin-E445A, followed by qPCR of ETC transcripts NDUFA1, NDUFA8, NDUFA11, and COX6B1. (E) Oxygen consumption rates after co-overexpression of either lenti-Actinin-WT or lenti-Actinin-E445A with lenti-cTnT-WT or lenti-cTnT-R92Q in iPSC-CMs. (F) OCR parameter quantifications comparing lenti-Actinin-WT and lenti-Actinin-E445A with either lenti-cTnT-WT or lenti-cTnT-R92Q. (G) LDH activity in conditioned media collected from iPSC-CMs expressing either lenti-Actinin-WT or lenti-Actinin-E445A with lenti-cTnT-WT or lenti-cTnT-R92Q in glucose-free media supplemented with galactose for 5 days. Data are n ≥ 3; mean ± SEM; significance assessed by Student’s t test (A–D) or by ANOVA using Holm-Sidak correction for multiple comparisons (F and G) and defined by p < 0.05 (*), p ≤ 0.01 (**), p ≤ 0.001 (***), p ≤ 0.0001 (****). See also Figure S4.

Similar articles

Cited by

References

    1. Aguer C, Gambarotta D, Mailloux RJ, Moffat C, Dent R, McPherson R, and Harper ME (2011). Galactose enhances oxidative metabolism and reveals mitochondrial dysfunction in human primary muscle cells. PLoS ONE 6, e28536. - PMC - PubMed
    1. Auerbach D, Bantle S, Keller S, Hinderling V, Leu M, Ehler E, and Perriard JC (1999). Different domains of the M-band protein myomesin are involved in myosin binding and M-band targeting. Mol. Biol. Cell 10, 1297–1308. - PMC - PubMed
    1. Aye TT, Soni S, van Veen TA, van der Heyden MA, Cappadona S, Varro A, de Weger RA, de Jonge N, Vos MA, Heck AJ, and Scholten A (2012). Reorganized PKA-AKAP associations in the failing human heart. J. Mol. Cell. Cardiol 52, 511–518. - PubMed
    1. Benjamini Y, Krieger AM, and Yekutieli D (2006). Adaptive linear step-up procedures that control the false discovery rate. Biometrika 93, 491–507.
    1. Beqqali A, Monshouwer-Kloots J, Monteiro R, Welling M, Bakkers J, Ehler E, Verkleij A, Mummery C, and Passier R (2010). CHAP is a newly identified Z-disc protein essential for heart and skeletal muscle function. J. Cell Sci 123, 1141–1150. - PubMed

Publication types