. 2021 Aug 10;36(6):109525.
doi: 10.1016/j.celrep.2021.109525.

Integration of T helper and BCR signals governs enhanced plasma cell differentiation of memory B cells by regulation of CD45 phosphatase activity

Affiliations

Integration of T helper and BCR signals governs enhanced plasma cell differentiation of memory B cells by regulation of CD45 phosphatase activity

Peter Szodoray et al. Cell Rep. .

Abstract

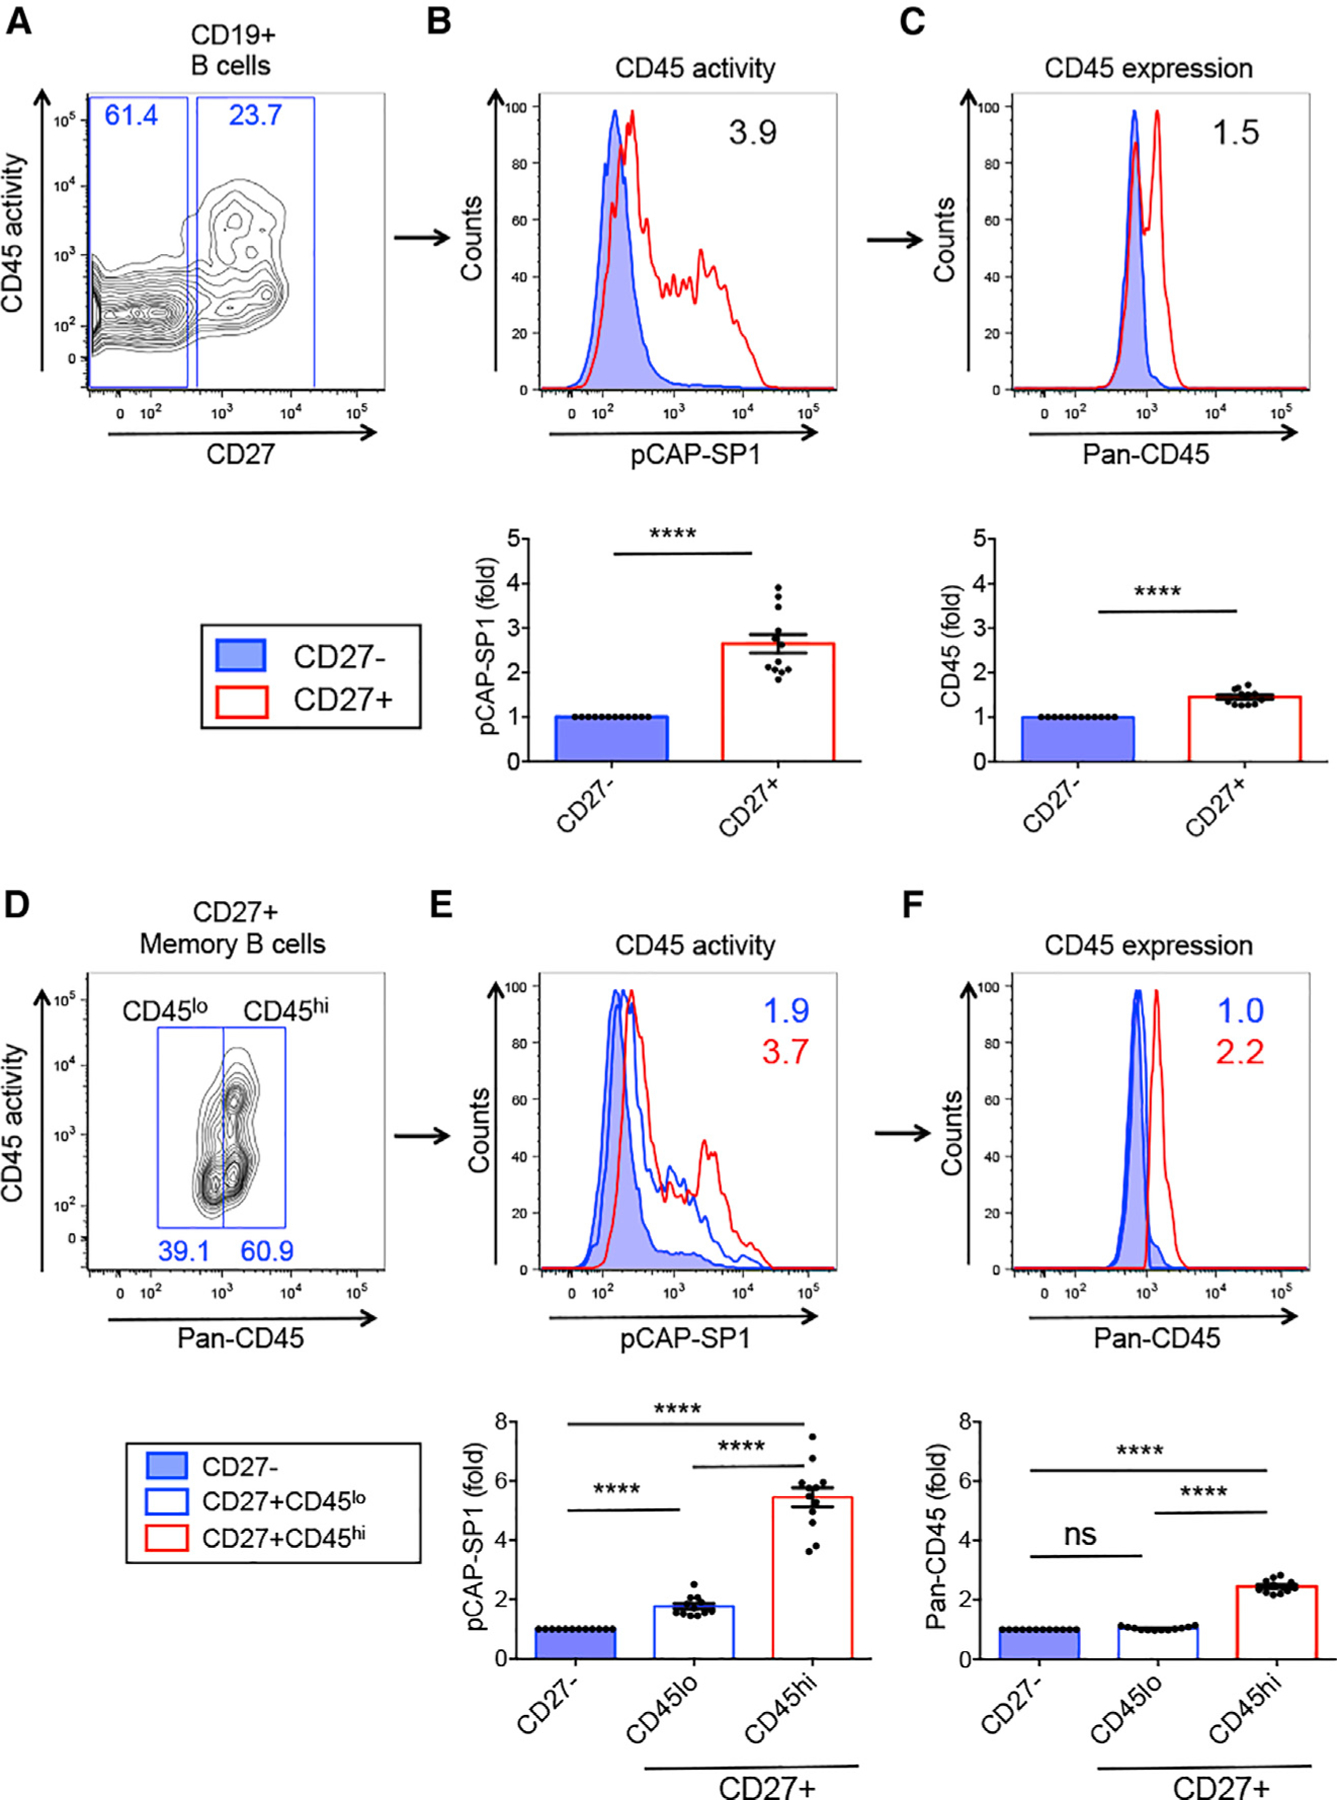
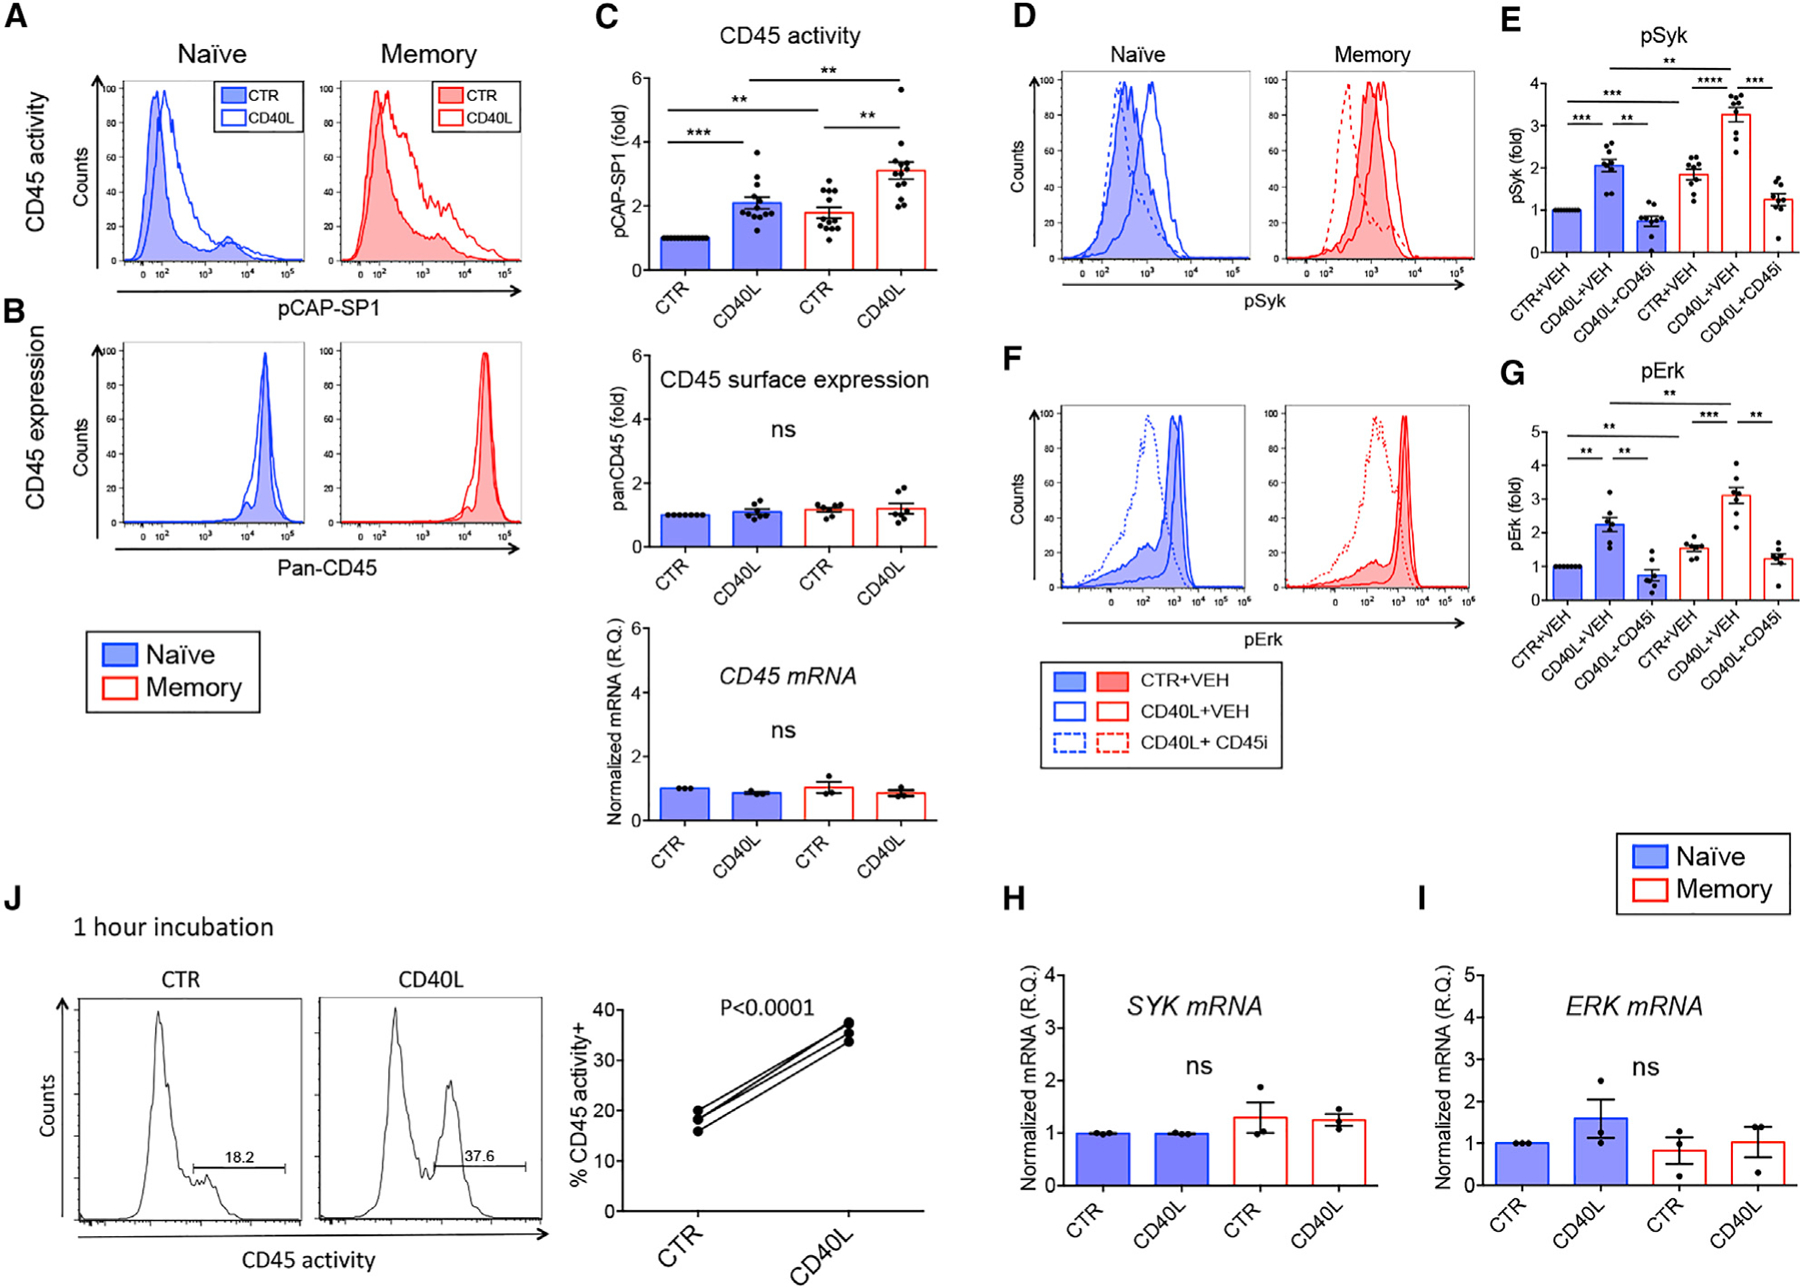
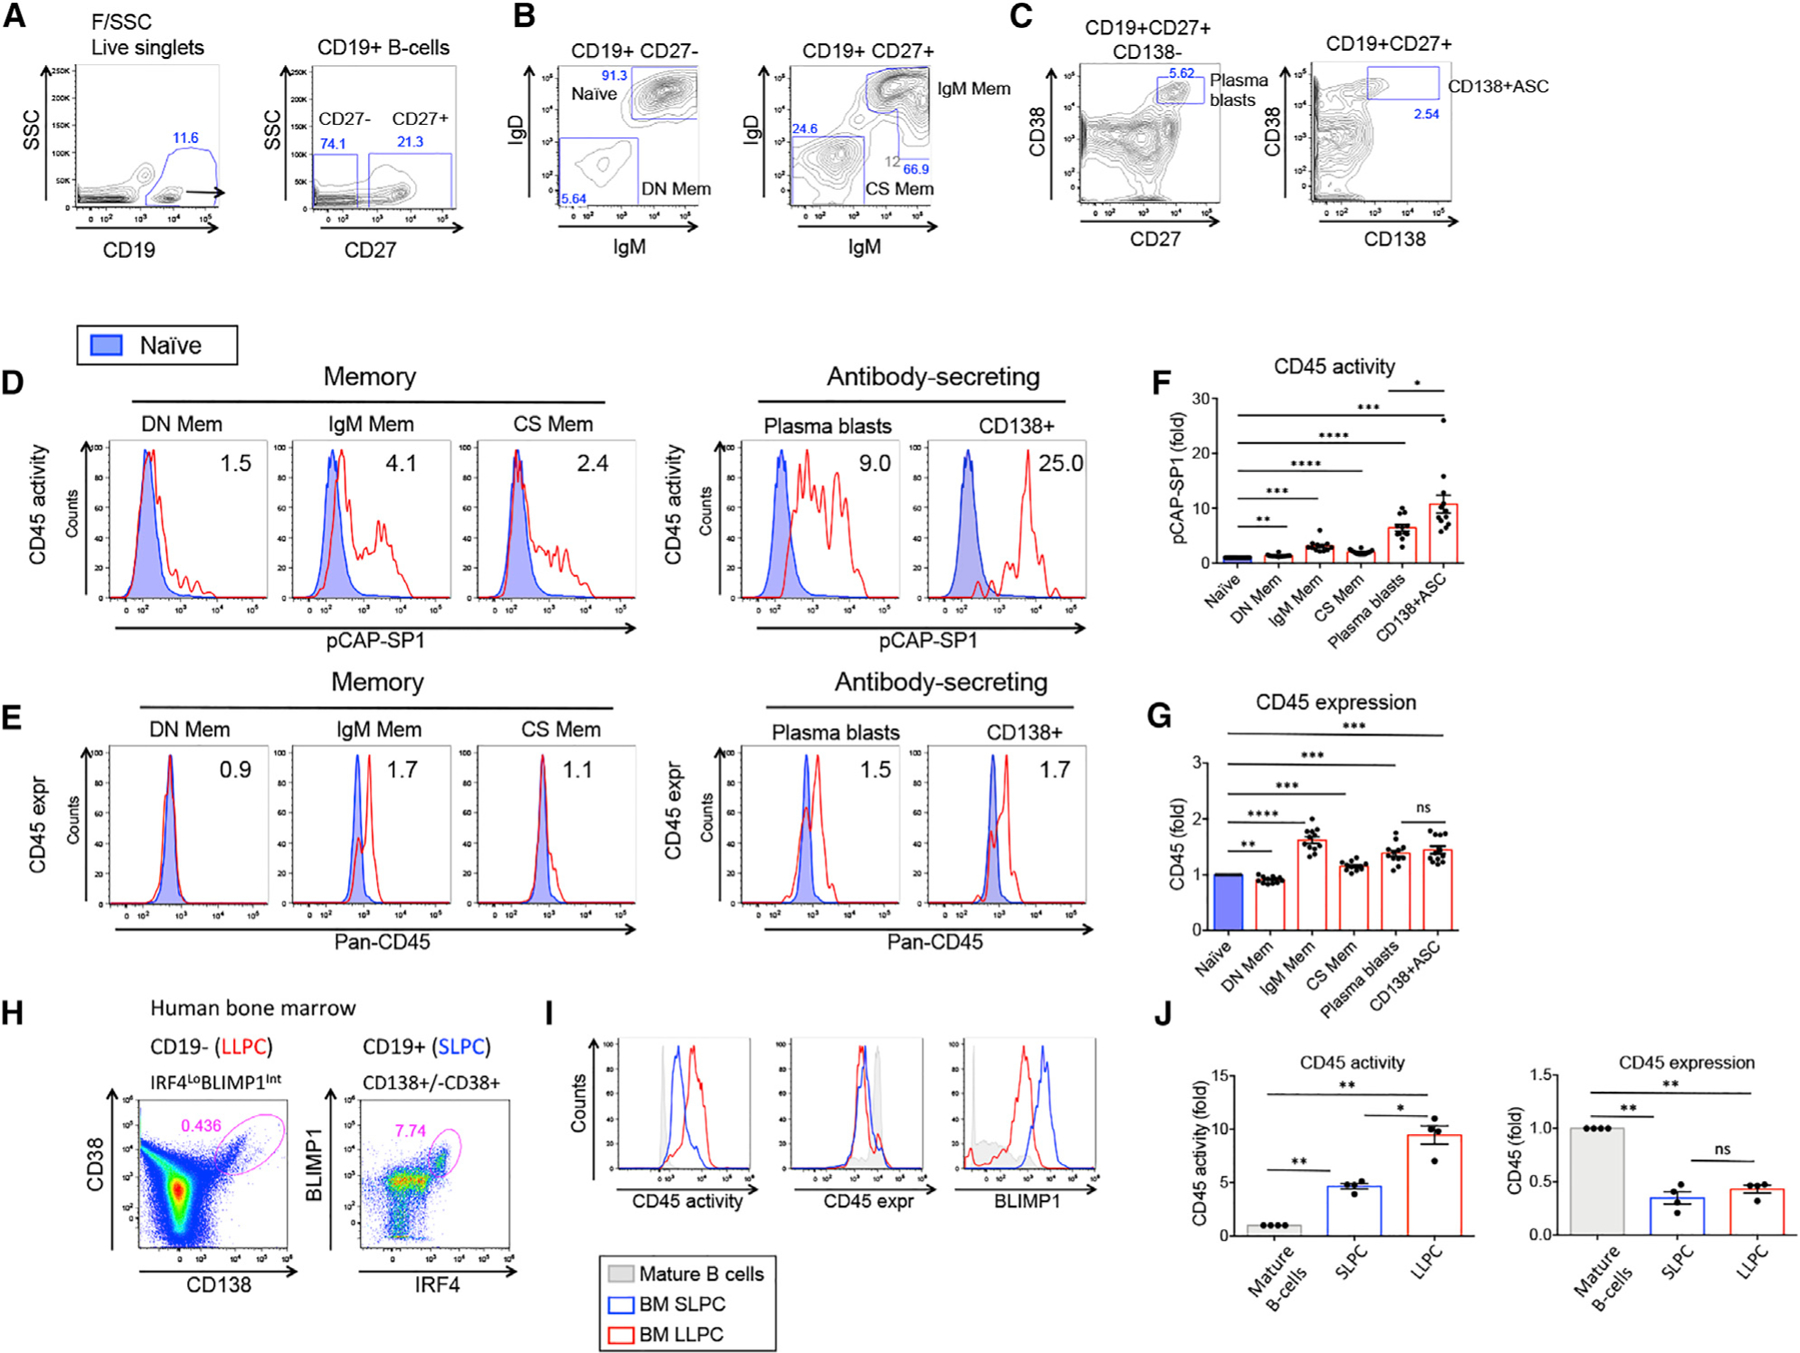
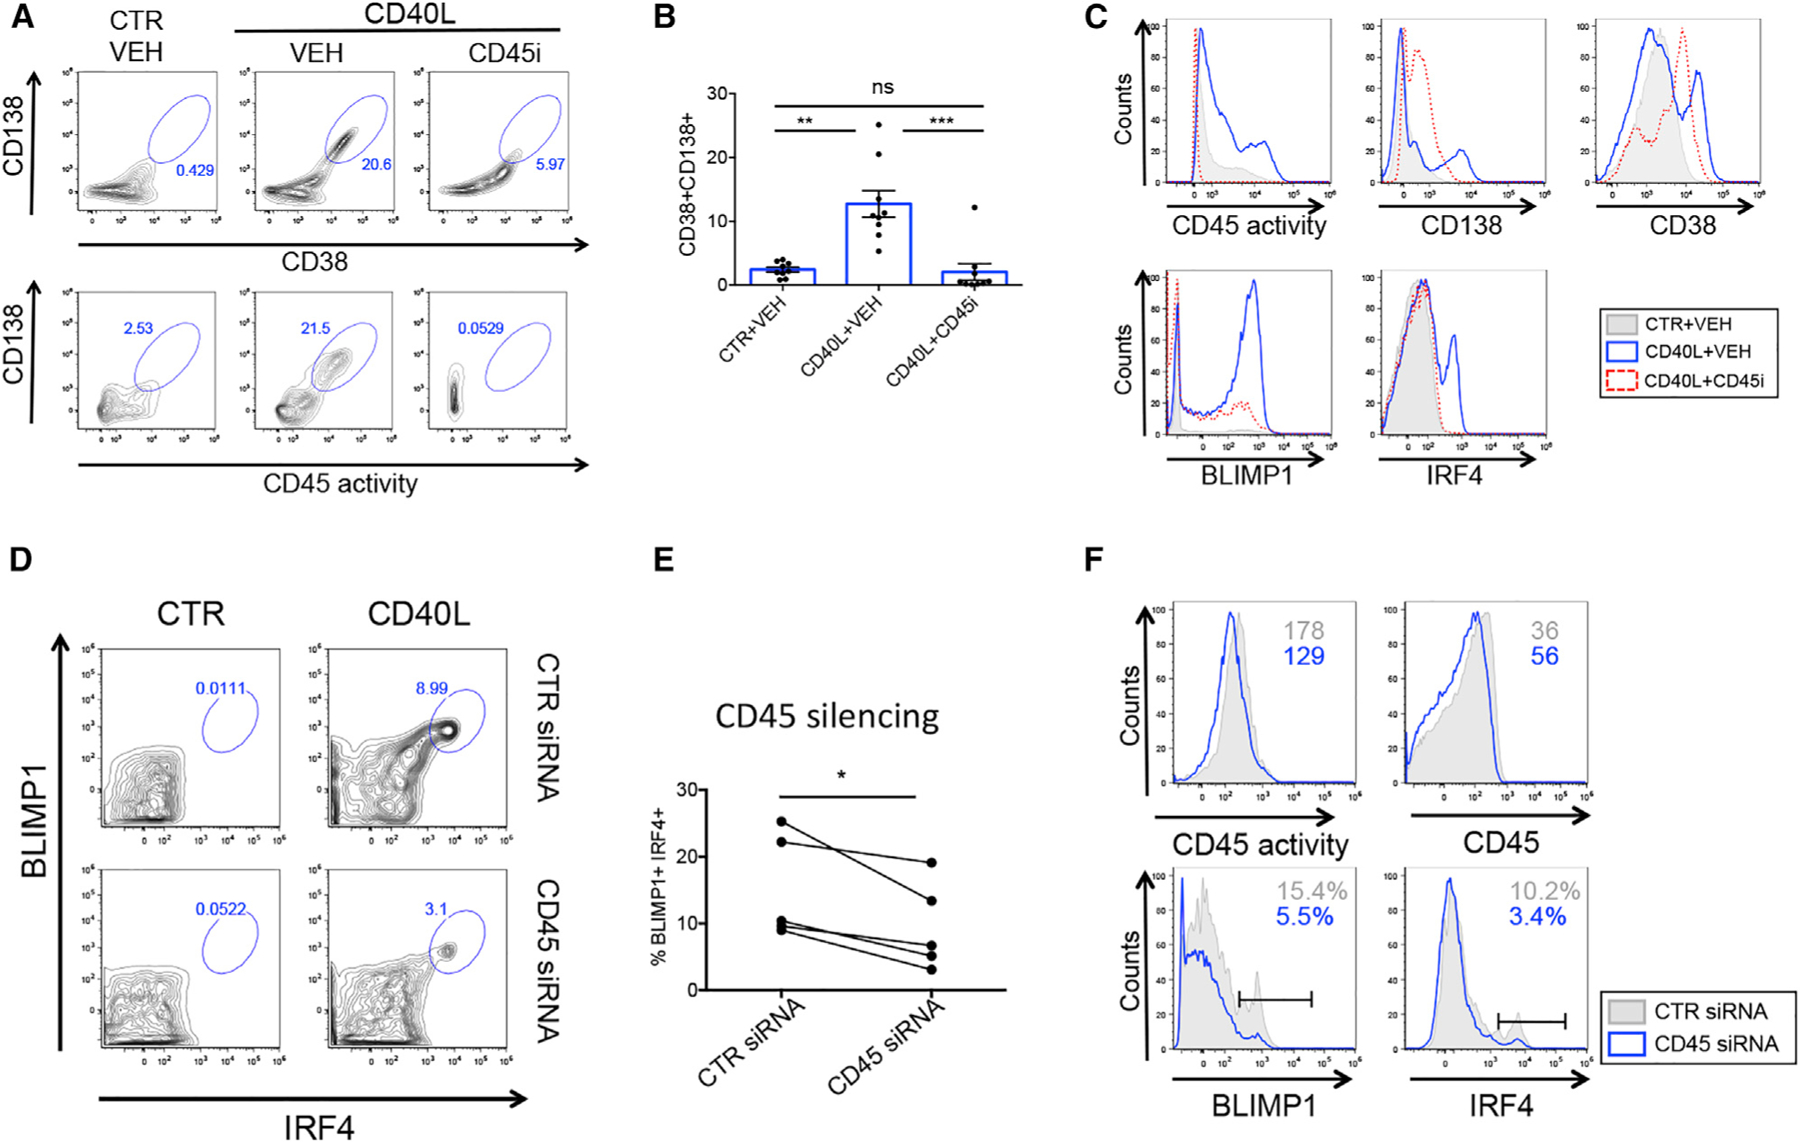
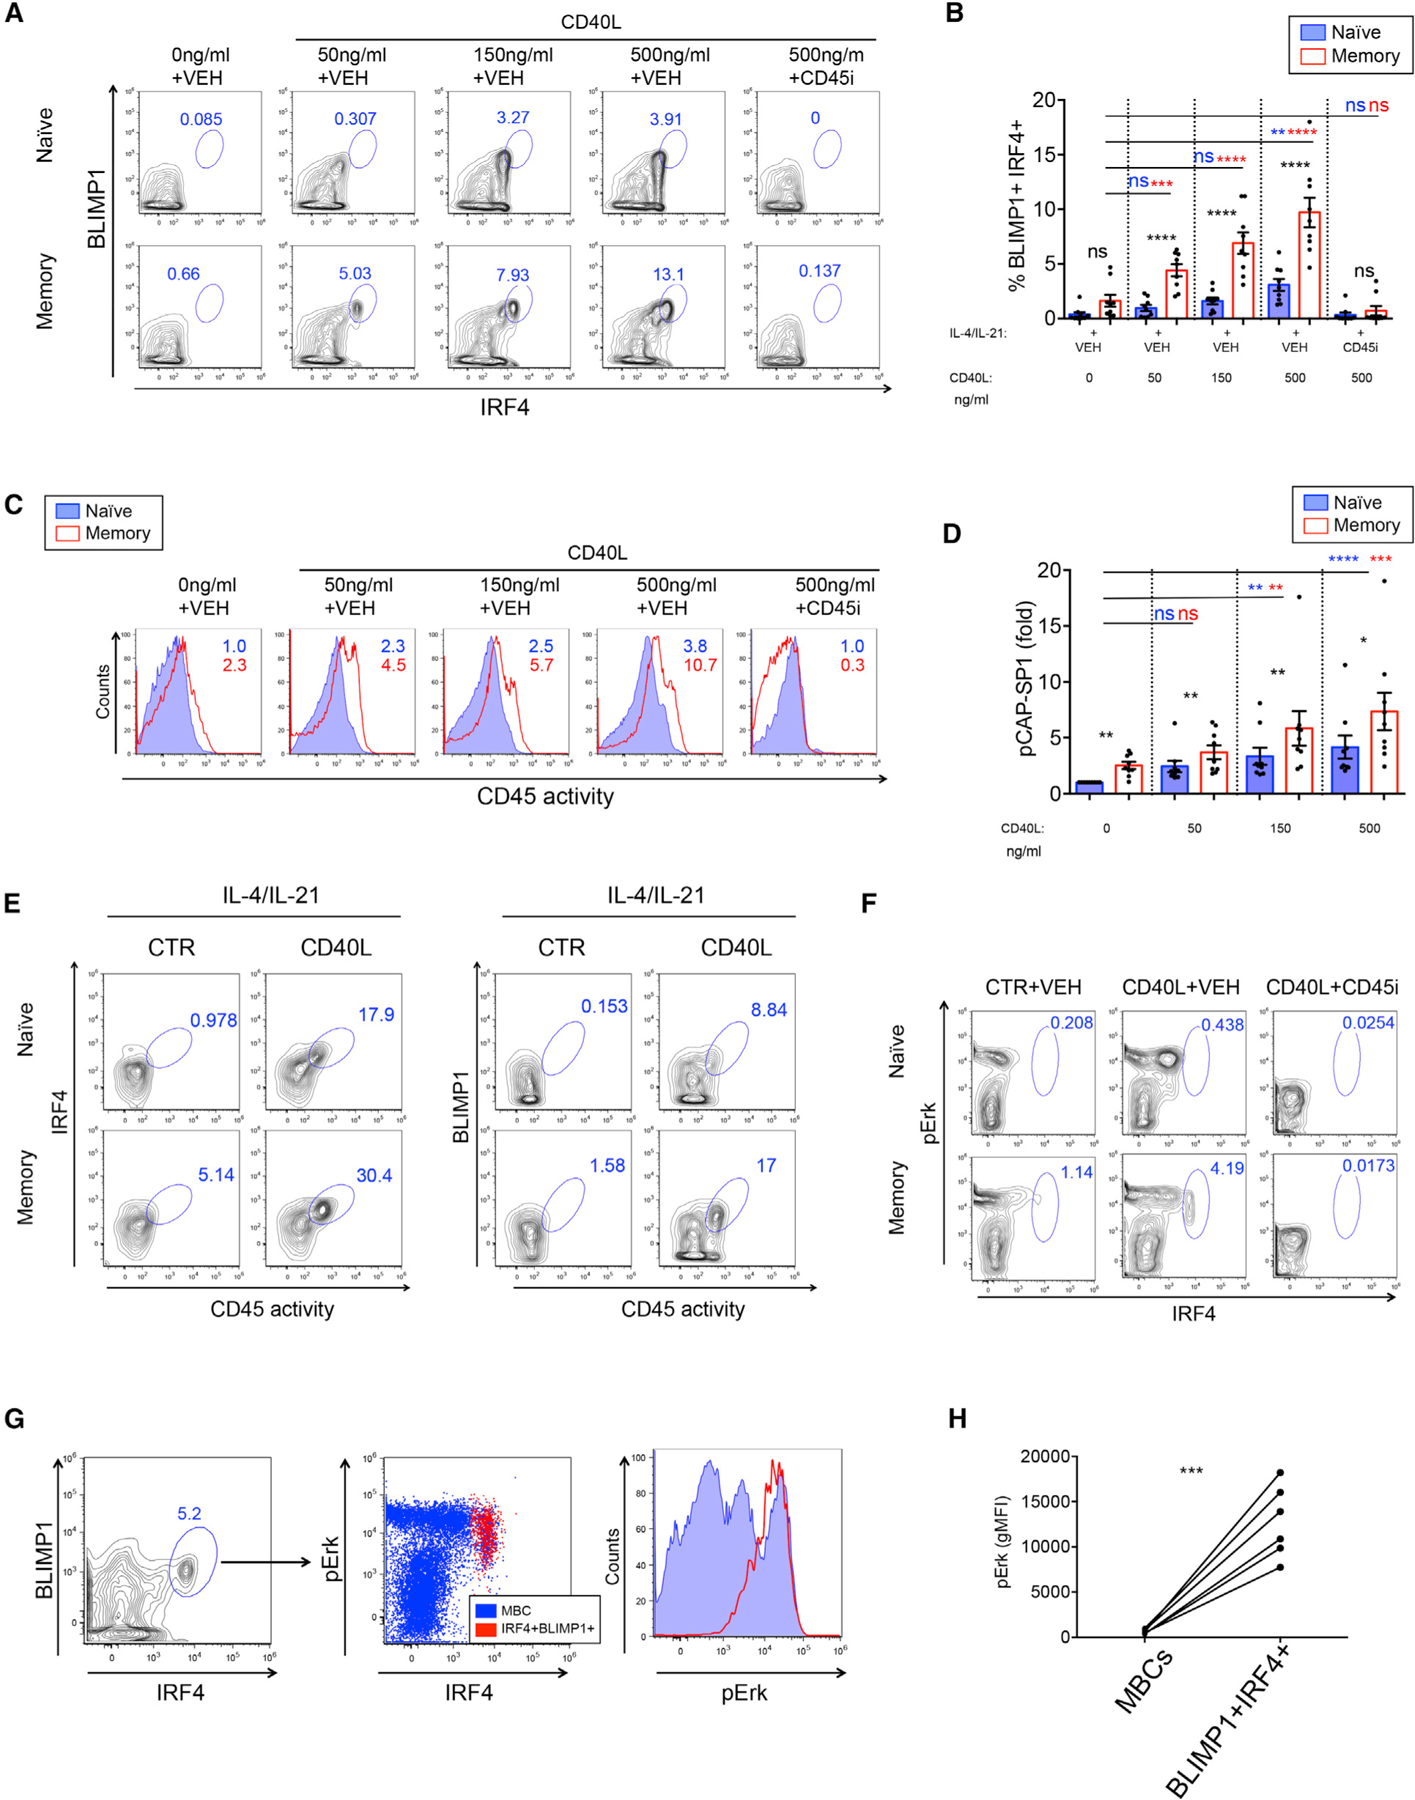
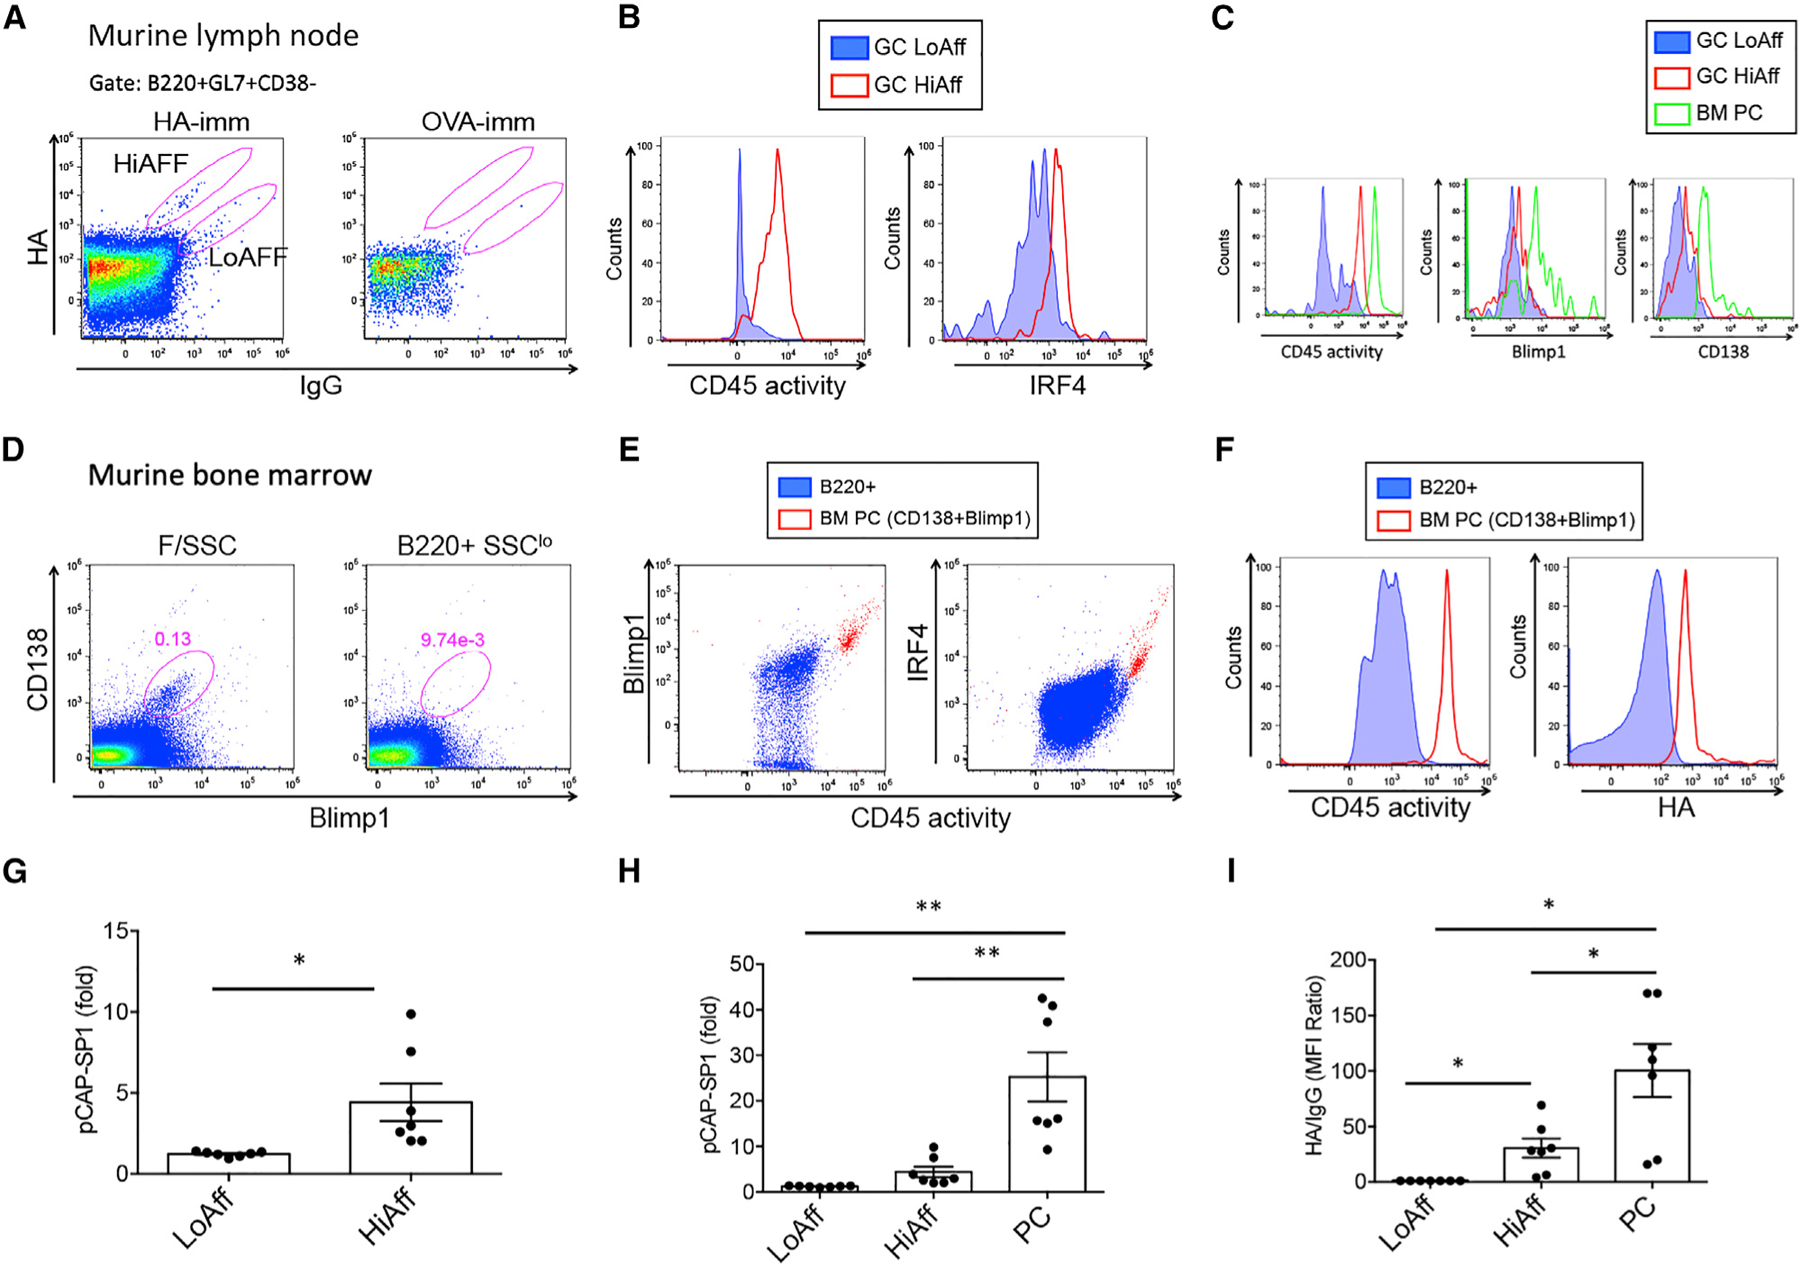
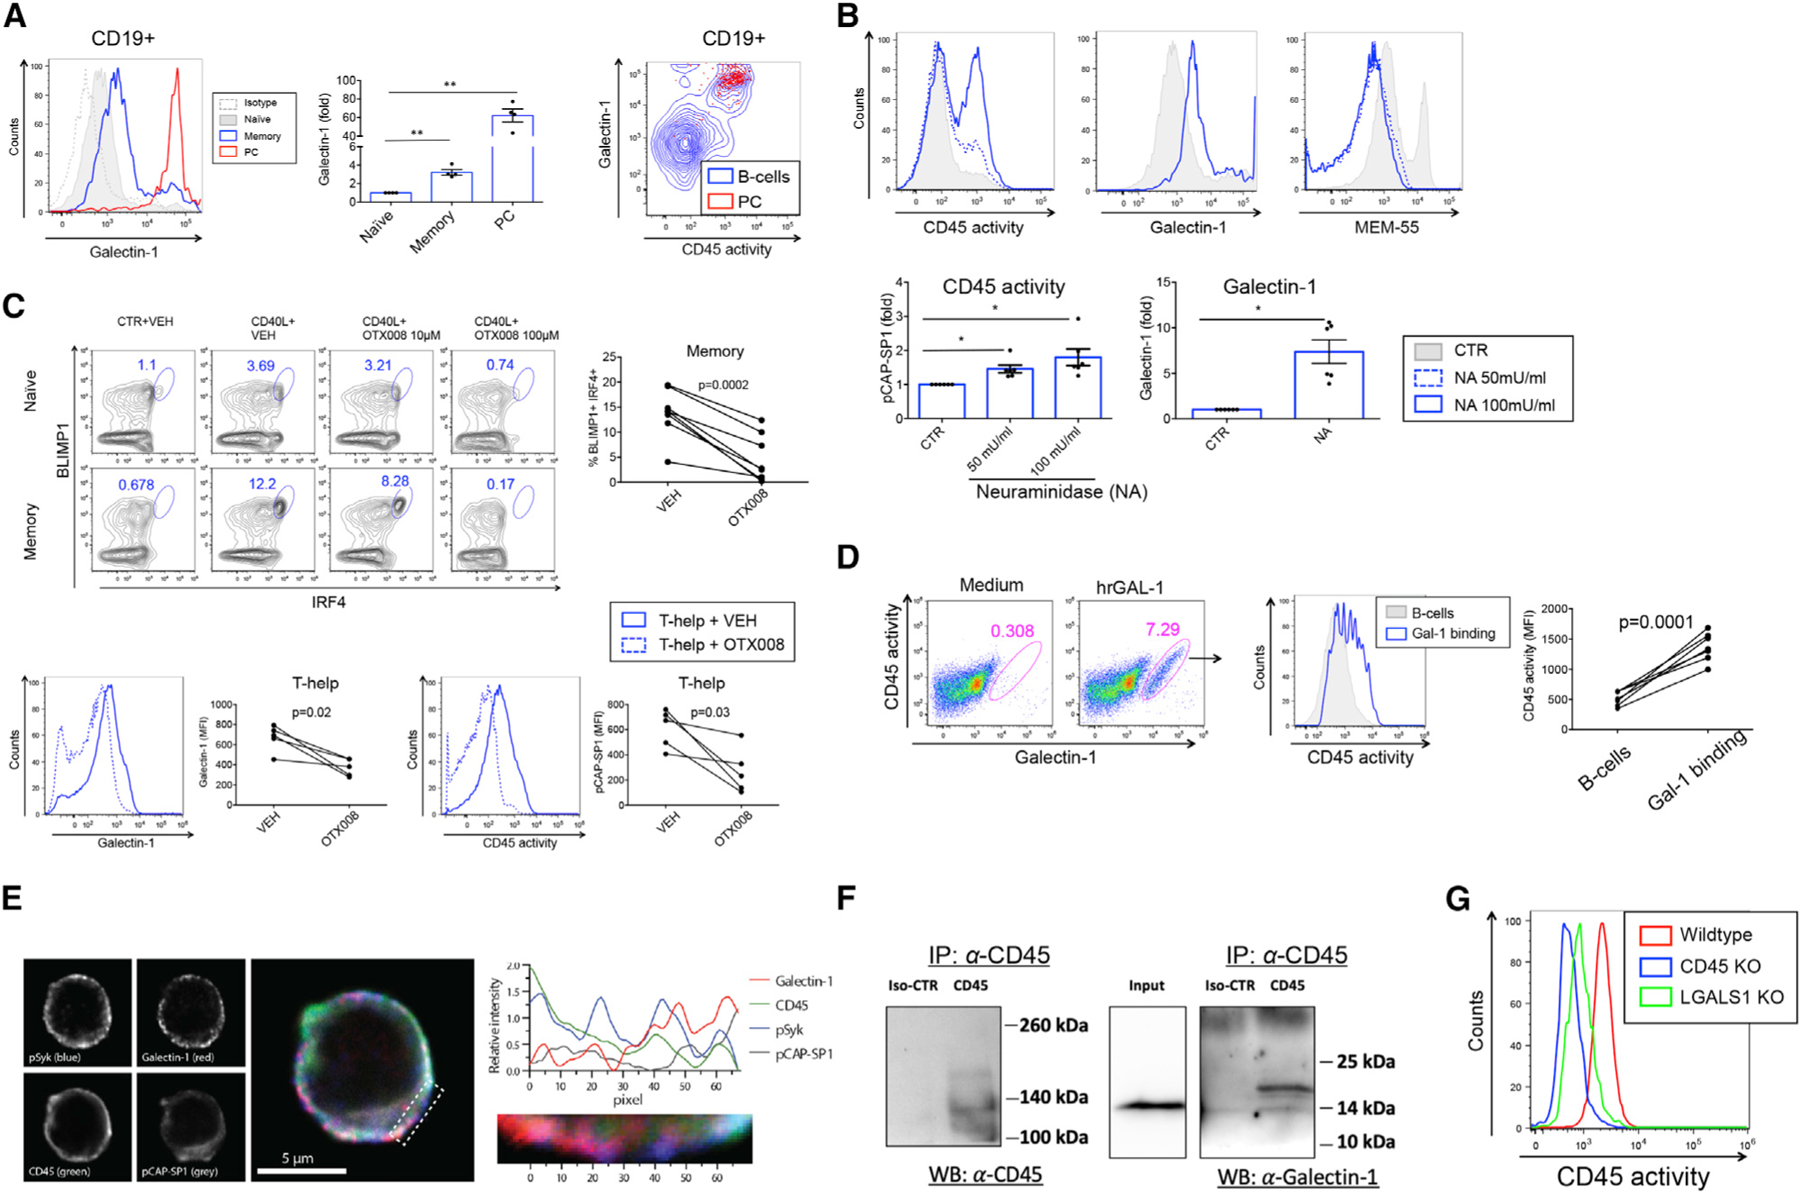
Humoral immunity relies on the efficient differentiation of memory B cells (MBCs) into antibody-secreting cells (ASCs). T helper (Th) signals upregulate B cell receptor (BCR) signaling by potentiating Src family kinases through increasing CD45 phosphatase activity (CD45 PA). In this study, we show that high CD45 PA in MBCs enhances BCR signaling and is essential for their effective ASC differentiation. Mechanistically, Th signals upregulate CD45 PA through intensifying the surface binding of a CD45 ligand, Galectin-1. CD45 PA works as a sensor of T cell help and defines high-affinity germinal center (GC) plasma cell (PC) precursors characterized by IRF4 expression in vivo. Increasing T cell help in vitro results in an incremental CD45 PA increase and enhances ASC differentiation by facilitating effective induction of the transcription factors IRF4 and BLIMP1. This study connects Th signals with BCR signaling through Galectin-1-dependent regulation of CD45 PA and provides a mechanism for efficient ASC differentiation of MBCs.

Keywords: B cell memory; B cell receptor signaling; BLIMP1; CD45 phosphatase activity; Galectin-1; IRF4; T cell help; antibody-secreting cell.


Conflict of interest statement

Declaration of interests The authors declare no competing interests.

Figures

Figure 1.
Figure 1.. CD45 phosphatase activity is increased in human memory B cells
(A) Flow cytometry dot plot showing CD45 phosphatase activity versus CD27 expression on gated CD19+ human peripheral B cells. (B and C) CD45 phosphatase activity (B) and CD45 surface expression (C) of CD27 (blue) and CD27+ B cells (red). Numbers in histograms represent CD45 activity (pCAP-SP1) (B) or CD45 surface expression (C) as the mean fluorescence intensity (MFI) ratio of CD27+/CD27 B cells. Bottom graphs: pCAP-SP1 or CD45 surface expression (MFI) in CD27+ relative to CD27 B cells. (D) CD45 expression versus CD45 phosphatase activity in gated CD27+ MBCs; CD45hi and CD45lo expression gates are shown. (E) CD45 phosphatase activity and (F) CD45 expression in CD27+ MBCs expressing low (blue open histogram) or high (red open histogram) levels of surface CD45 compared to CD27 B cells (filled blue histogram). Graphs show pCAP-SP1 or CD45 MFI relative to CD27 B cells. n = 12. Related to Figure S1. ****p < 0.0001.
Figure 2.
Figure 2.. CD45 phosphatase activity is upregulated upon CD40L stimulation and leads to more potent BCR signaling in MBCs
(A and B) CD45 phosphatase activity (A) and CD45 surface expression (B) in naive B cells (left panels) and MBCs (right panels), control (CTR) treated (filled histogram) or CD40L (open histograms). (C) CD45 phosphatase activity (upper panel, n = 13), panCD45 surface expression (middle panel, n= 7), and CD45 mRNA levels (lower panel, n = 3) of naive B cells (blue) and MBCs (red), CTR or CD40L treated. Graphs show pCAP-SP1 (upper panel) or CD45 (middle panel) MFI values relative to naive B cells. Lower graph: Quantitative real-time PCR of CD45 mRNA normalized to POLR2A expressed as RQ (relative quantity). (D and F) Activated BCR signaling kinases pSyk (D) and pErk (F) upon BCR cross-linking in naive B cells (left panel) or MBC (right panel) in CTR+vehicle (VEH) (filled histograms), CD40L+VEH (open histograms), or CD40L+CD45 inhibitor (open dotted histograms). (E and G) Graphs show pSyk (n= 9) (E) and pErk (n = 7) (G) MFI values relative to CTR naive B cells. (H and I) Real-time quantitative PCR analysis of SYK (H) and ERK (I) mRNA relative to POLR2A expressed as RQ (n = 3). (J) Purified human B cells were stimulated for 1 h at 37C before CD45 activity was measured. Graph depicts % CD45 activity+ B cells in CTR or CD40L-stimulated B cells (n= 4). Related to Figure S1. **p < 0.01, ***p < 0.001, ****p < 0.0001.
Figure 3.
Figure 3.. CD45 phosphatase activity is increased in human MBC and antibody-secreting cell subsets
(A–C) Flow cytometry dot plots showing gating of peripheral blood B cell subsets. (D and E) CD45 phosphatase activity (D) and panCD45 surface expression (E) in human MBC and ASC subpopulations (red) compared to naive B cells (blue). Numbers in the histograms represent MFI ratio relative to naive B cells. (F and G) Graphs show pCAP-SP1 (F) and panCD45 surface expression (G) MFI values relative to naive B cells (n= 12). (H) Human BM CD19CD38hiCD138+ (left panel) and CD19+CD138+/−CD38+ (right panel) previously shown to contain LLPCs and SLPCs, respectively. (I) CD45 phosphatase activity (left panel), CD45 surface expression (middle panel), and BLIMP1 expression (right panel) in LLPCs (red) and SLPCs (blue) relative to mature BM B cells (CD19+SSCloCD45hi) obtained from the same donor (gray). (J) Graphs show fold change in MFI of CD45 phosphatase activity (left panel) and CD45 surface expression (right panel) from human BM PCs relative to mature BM B cells from the same healthy donor (n = 4). Related to Figure S2. *p < 0.05, **p < 0.01, ***p < 0.001, ****p < 0.0001.
Figure 4.
Figure 4.. Differentiation of antibody-secreting cells by Th signals is CD45-dependent
(A) Flow cytometry plots show gated CD38hiCD138hi ASCs (upper panel) and CD45 activity versus CD138 expression (lower panel) in the presence of Th signals and CD45 inhibitor as indicated. (B) Graph shows % CD38hiCD138hi ASC B cells (n= 8). (C) Histograms show the CD45-dependent regulation of ASC-associated markers and transcription factors. CTR+VEH (gray), CD40L+VEH (blue), CD40L+CD45 inhibitor (red). (D) Human peripheral B cells differentiated toward ASCs in the presence of CTR siRNA (upper panels) or CD45 siRNA (lower panels). (E) Graph shows % IRF4+BLIMP1+ ASCs upon delivery of CTR or CD45 siRNA (n = 5). (F) Flow cytometry histograms show expression of CD45 activity (upper left panel), CD45 surface expression (upper right panel), BLIMP1 (lower left panel), and IRF4 (lower right panel) in purified B cells differentiated toward ASCs in the presence of CTR siRNA (gray) or CD45 siRNA (blue). Related to Figure S3. *p < 0.05, **p < 0.01, ***p < 0.001.
Figure 5.
Figure 5.. Increasing T cell help leads to an incremental increase in CD45 phosphatase activity and efficient MBC differentiation into ASCs
(A) Flow cytometry plots show IRF4 and BLIMP1 expression on gated live cells with increasing levels of CD40L. CD45 inhibitor was used at 1.25 µM. (B) Graph shows % IRF4+BLIMP1+ B cells in naive (blue) and memory (red) B cell cultures. Black asterisks represent significant differences between naive B cells and MBCs. Blue and red asterisks represent significant differences in naive B cells or MBCs stimulated with increasing concentrations of CD40L, respectively (n=9). (C) CD45 phosphatase activity in naive B cells (blue) and MBCs (red) upon incremental concentrations of CD40L. (D) Graph shows fold increase in MFI of CD45 phosphatase activity relative to naive unstimulated B cells (n = 9). (E) Flow cytometry plots show co-expression of CD45 phosphatase activity and expression of PC transcription factors IRF4 and BLIMP1 in naive B cells and MBCs upon provision of Th signals or CTR-treated B cells. (F) Flow cytometry plot showing co-expression of pErk and IRF4 in MBCs differentiated toward ASCs. (G) Dot plot shows IRF4+BLIMP1+ ASCs (left panel) backgating to IRF4+pErk+ cells (red) compared to overall MBCs (blue) (middle panel). Right panel: Histogram shows expression of pErk in IRF4+BLIMP1+ ASCs (red) compared to total MBCs (blue). (H) Graph shows pErk MFI values in MBCs and IRF4+BLIMP1+ ASCs (n = 6). Related to Figures S3–S5. *p < 0.05, **p < 0.01, ***p < 0.001, ****p < 0.0001.
Figure 6.
Figure 6.. CD45 phosphatase activity defines high-affinity germinal center (GC) PC precursors in a T cell-dependent vaccination system
(A) Representative dot plots showing LN GC B cells (B220+GL7+CD38) and high- and low-affinity HA-reactive cells; HA binding versus IgG expression is shown. (B) Histograms show CD45 activity (left) and IRF4 expression (right) in GC low- (blue-filled histograms) and high-affinity (red) B cells. (C) BM PCs gated as Blimp1+CD138+ cells (green) overlayed on histograms of low- (blue) and high-affinity (red) GC B cells showing CD45 activity (left) and Blimp1 (middle) and CD138 (right) expression levels. (D) Dot plots show BM PC gate from forward and side scatter (F/SSC)-gated cells (left) and from B220+SSClo-gated cells (right). (E) PCs were backgated on dot plots depicting CD45 activity and Blimp1 (left) and CD45 activity and IRF4 (right); PCs are depicted as red dots, BM B220+ B cells are represented in blue. (F) PCs (red) and B220+ B cells (blue) were analyzed for CD45 activity (left) and HA binding (right). (G and H) Graphs show MFI of CD45 activity of low-affinity (LoAff) and high-affinity (HiAff) GC B cells and BM PCs relative to B220+ B cells within the same sample (LN or BM). (I) Graph shows MFI ratio of HA normalized to IgG. Data are representative of two experiments including seven immunized mice in addition to immunization and staining controls. Related to Figure S6. *p < 0.05, **p < 0.01.
Figure 7.
Figure 7.. Galectin-1 enhances CD45 phosphatase activity and PC differentiation
(A) Flow cytometry histogram showing surface staining of Galectin-1 in naive (gray), memory (blue), and PCs (red) in human peripheral blood B cells (left panel). Isotype control is shown by gray-dotted histogram. Graph shows fold increase in surface Galectin-1 staining (MFI) relative to naive B cells (n = 4). Contour plot depicts CD45 activity versus Galectin-1 surface staining in B cells (blue) and PCs (CD138hiCD38hi) (red) backgated to CD45 activityhiGalectin-1hi cells (right panel). (B) Histograms show CD45 activity (left panel), Galectin-1 staining (middle panel), and MEM-55 staining (right panel) in CTR- or NA-treated B cells. Graphs show fold increase in MFI of CD45 phosphatase activity (left lower panel) and Galectin-1 staining (right lower panel) relative to CTR-treated B cells (n = 6). (C) Upper panels: Dot plots show expression of IRF4 and BLIMP1 in naive B cells and MBCs differentiated toward ASCs in the presence of 10 and 100 µM OTX008 or VEH. Graph shows % IRF4+BLIMP1+ B cells in MBC cultures. Lower panels: Galectin-1 surface expression (left panel) and CD45 phosphatase activity (right panel) in VEH-treated (blue histogram) and OTX-treated (blue dotted histogram) MBCs. Graphs show MFI values of Galectin-1 staining (left) and CD45 activity (right) (n = 5). (D) Flow cytometry dot plots show CD45 activity versus Galectin-1 surface staining in the presence of medium or rhGAL-1 (left panels). Histogram shows CD45 phosphatase activity of Galectin-1hi B cells with rhGAL1 (blue) and total B cells (gray) (middle panel). Graph shows MFI values of CD45 activity in total B cells (gray histogram) and GAL-1hi (blue open histogram) B cells (right panel) (n = 6). (E) Representative localization of Galectin-1 relative to pSyk, pCAP-SP1, and CD45 in human B cells. The panels (left) present signals from the individual fluorescence detectors, and the center image is a merge of all four channels. The graph (right) shows the average (z axis) fluorescence intensity for each (x axis) pixel number in the indicated area (below graph and dotted area on center figure). (F) CoIP of CD45 of B cell lysates and immunoblotted with anti-CD45 (left) or anti-Galectin-1 (right). (G) Flow cytometry histogram showing CD45 phosphatase activity in gated live Raji B cells with CRISPR-Cas9 knockdown of CD45 (blue), Galectin-1 (green), and wild-type (red). Related to Figures S7 and S8. *p < 0.05, **p < 0.01.

Similar articles

Cited by

References

    1. Aiba Y, Kometani K, Hamadate M, Moriyama S, Sakaue-Sawano A, Tomura M, Luche H, Fehling HJ, Casellas R, Kanagawa O., et al. (2010). Preferential localization of IgG memory B cells adjacent to contracted germinal centers. Proc. Natl. Acad. Sci. USA 107, 12192–12197. - PMC - PubMed
    1. Alhabbab R, Blair P, Smyth LA, Ratnasothy K, Peng Q, Moreau A, Lechler R, Elgueta R, and Lombardi G. (2018). Galectin-1 is required for the regulatory function of B cells. Sci. Rep 8, 2725. - PMC - PubMed
    1. Allen CD, Okada T, Tang HL, and Cyster JG (2007). Imaging of germinal center selection events during affinity maturation. Science 315, 528–531. - PubMed
    1. Amano M, Galvan M, He J, and Baum LG (2003). The ST6Gal I sialyltransferase selectively modifies N-glycans on CD45 to negatively regulate galectin-1-induced CD45 clustering, phosphatase modulation, and T cell death. J. Biol. Chem 278, 7469–7475. - PubMed
    1. Andersen TK, Zhou F, Cox R, Bogen B, and Grødeland G. (2017). A DNA vaccine that targets hemagglutinin to antigen-presenting cells protects mice against H7 influenza. J. Virol 91, e01340–17. - PMC - PubMed

Publication types