. 2021 Aug 10;54(8):1807-1824.e14.
doi: 10.1016/j.immuni.2021.07.009.

Mutations in the transcription factor FOXO1 mimic positive selection signals to promote germinal center B cell expansion and lymphomagenesis

Affiliations

Mutations in the transcription factor FOXO1 mimic positive selection signals to promote germinal center B cell expansion and lymphomagenesis

Mark P Roberto et al. Immunity. .

Abstract

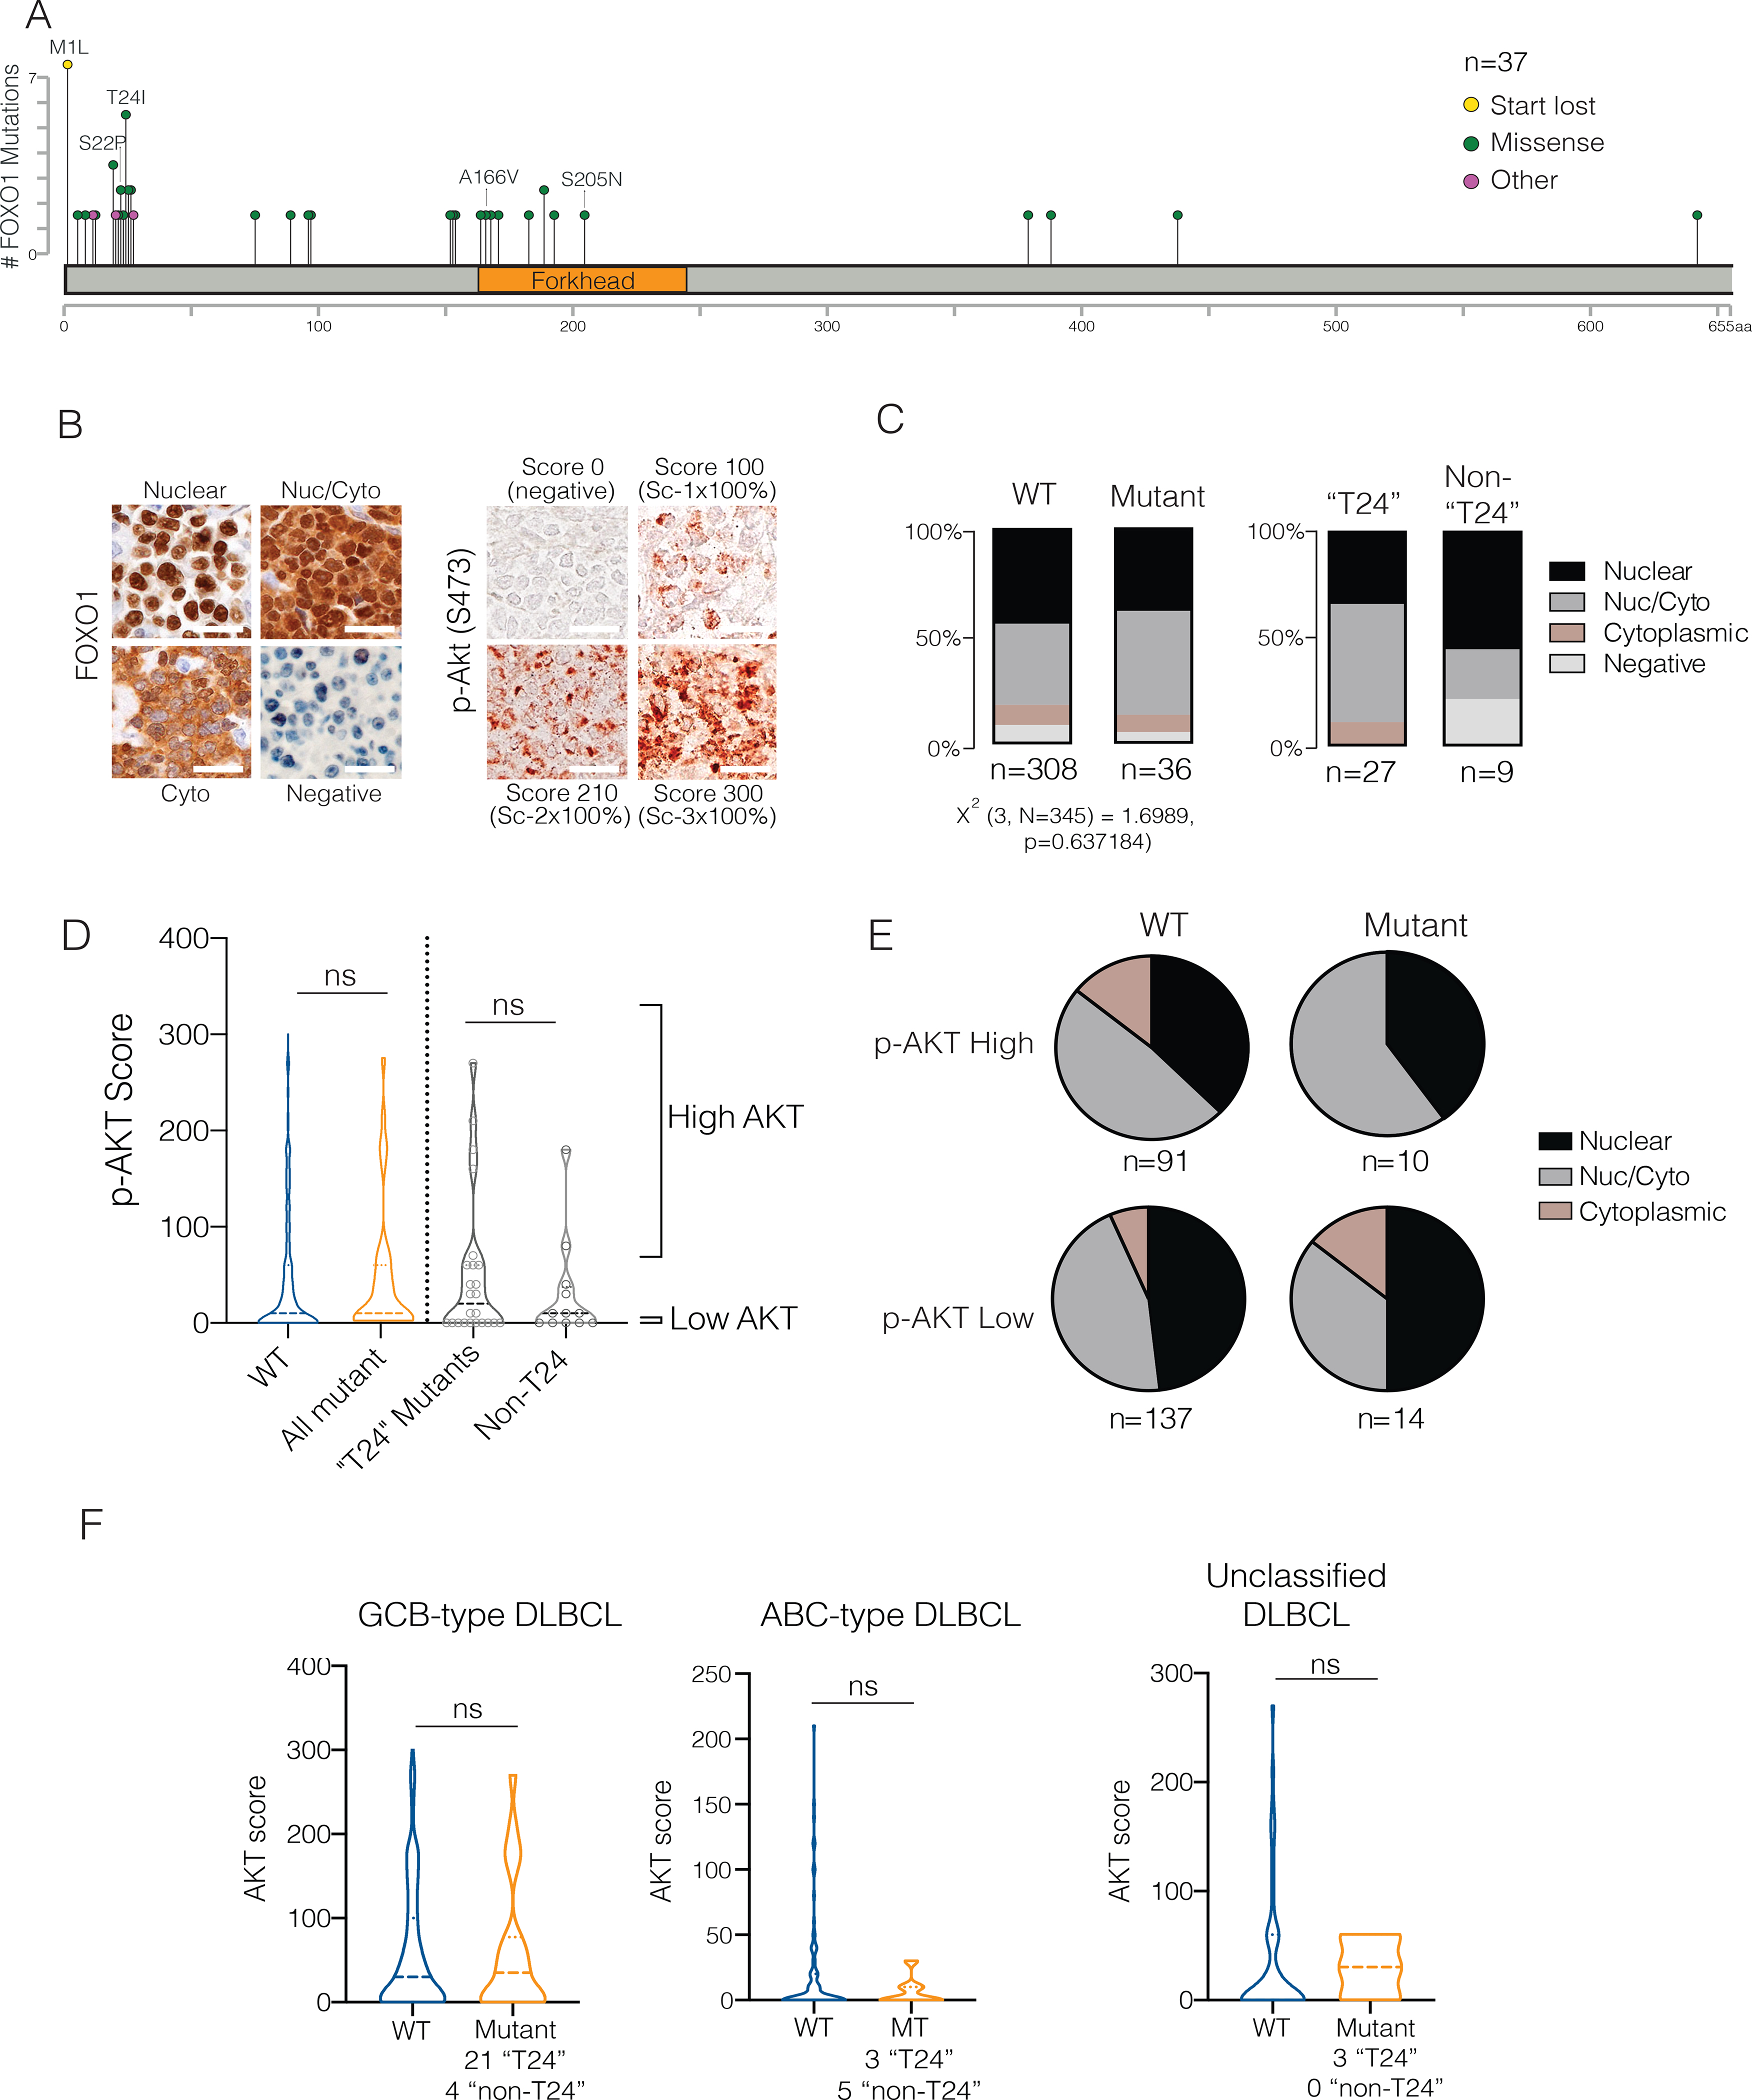
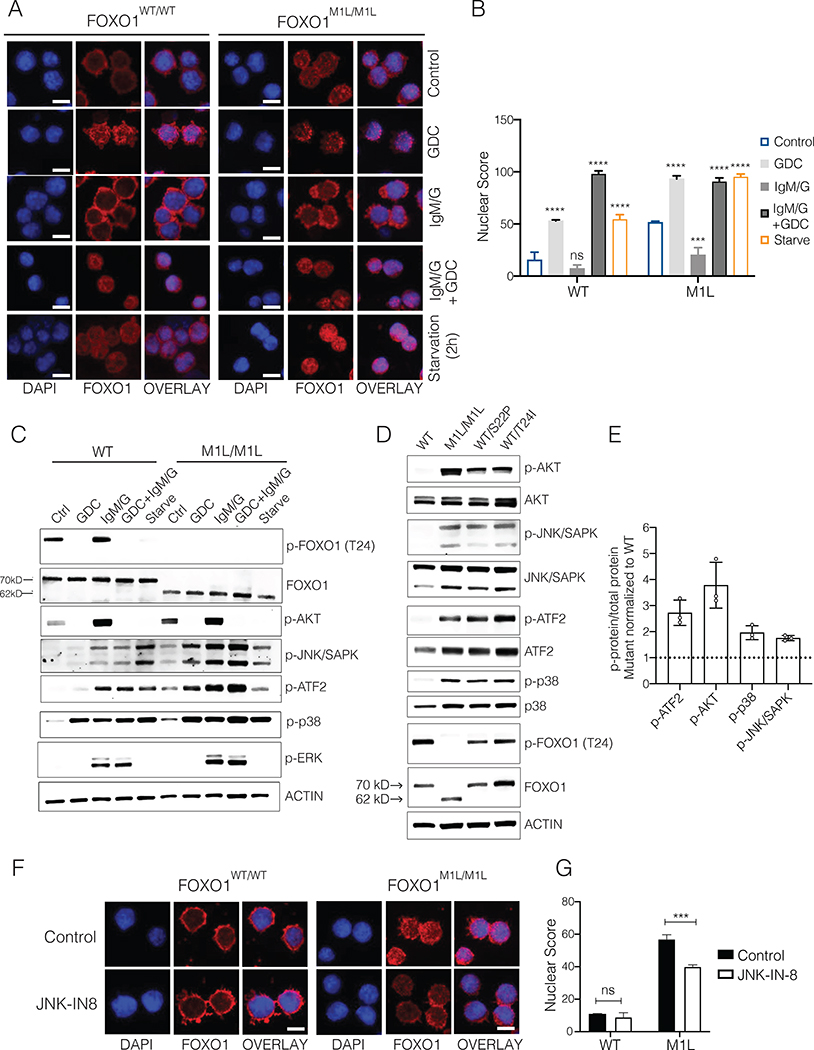
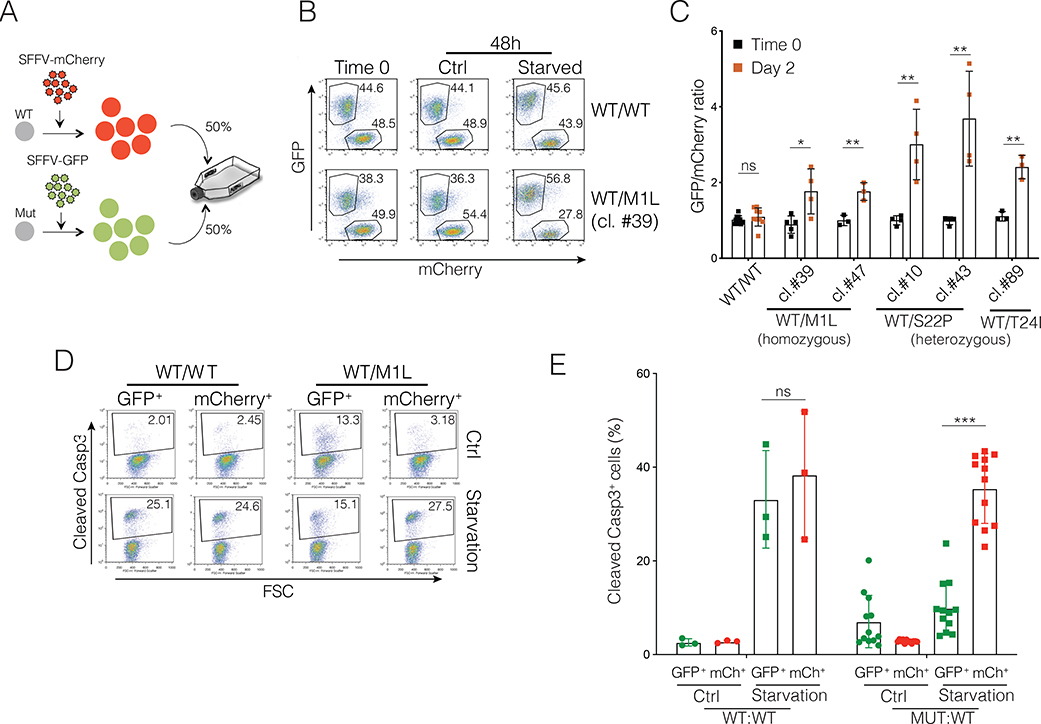
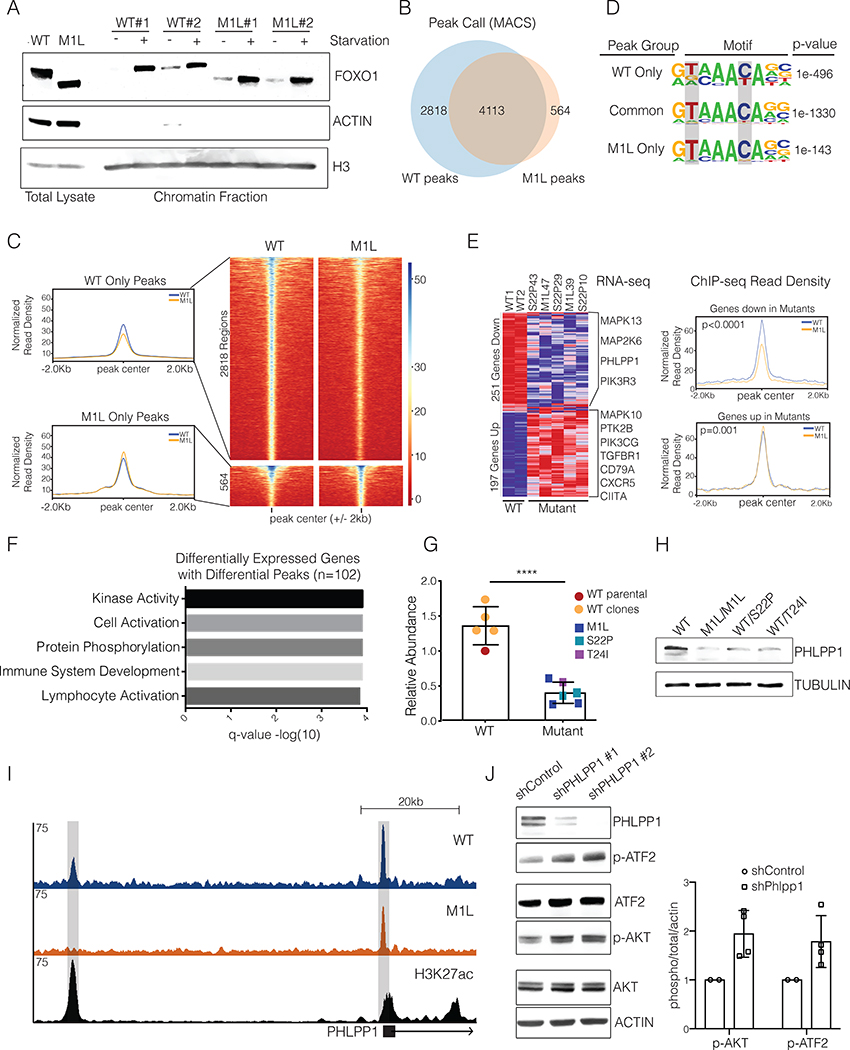
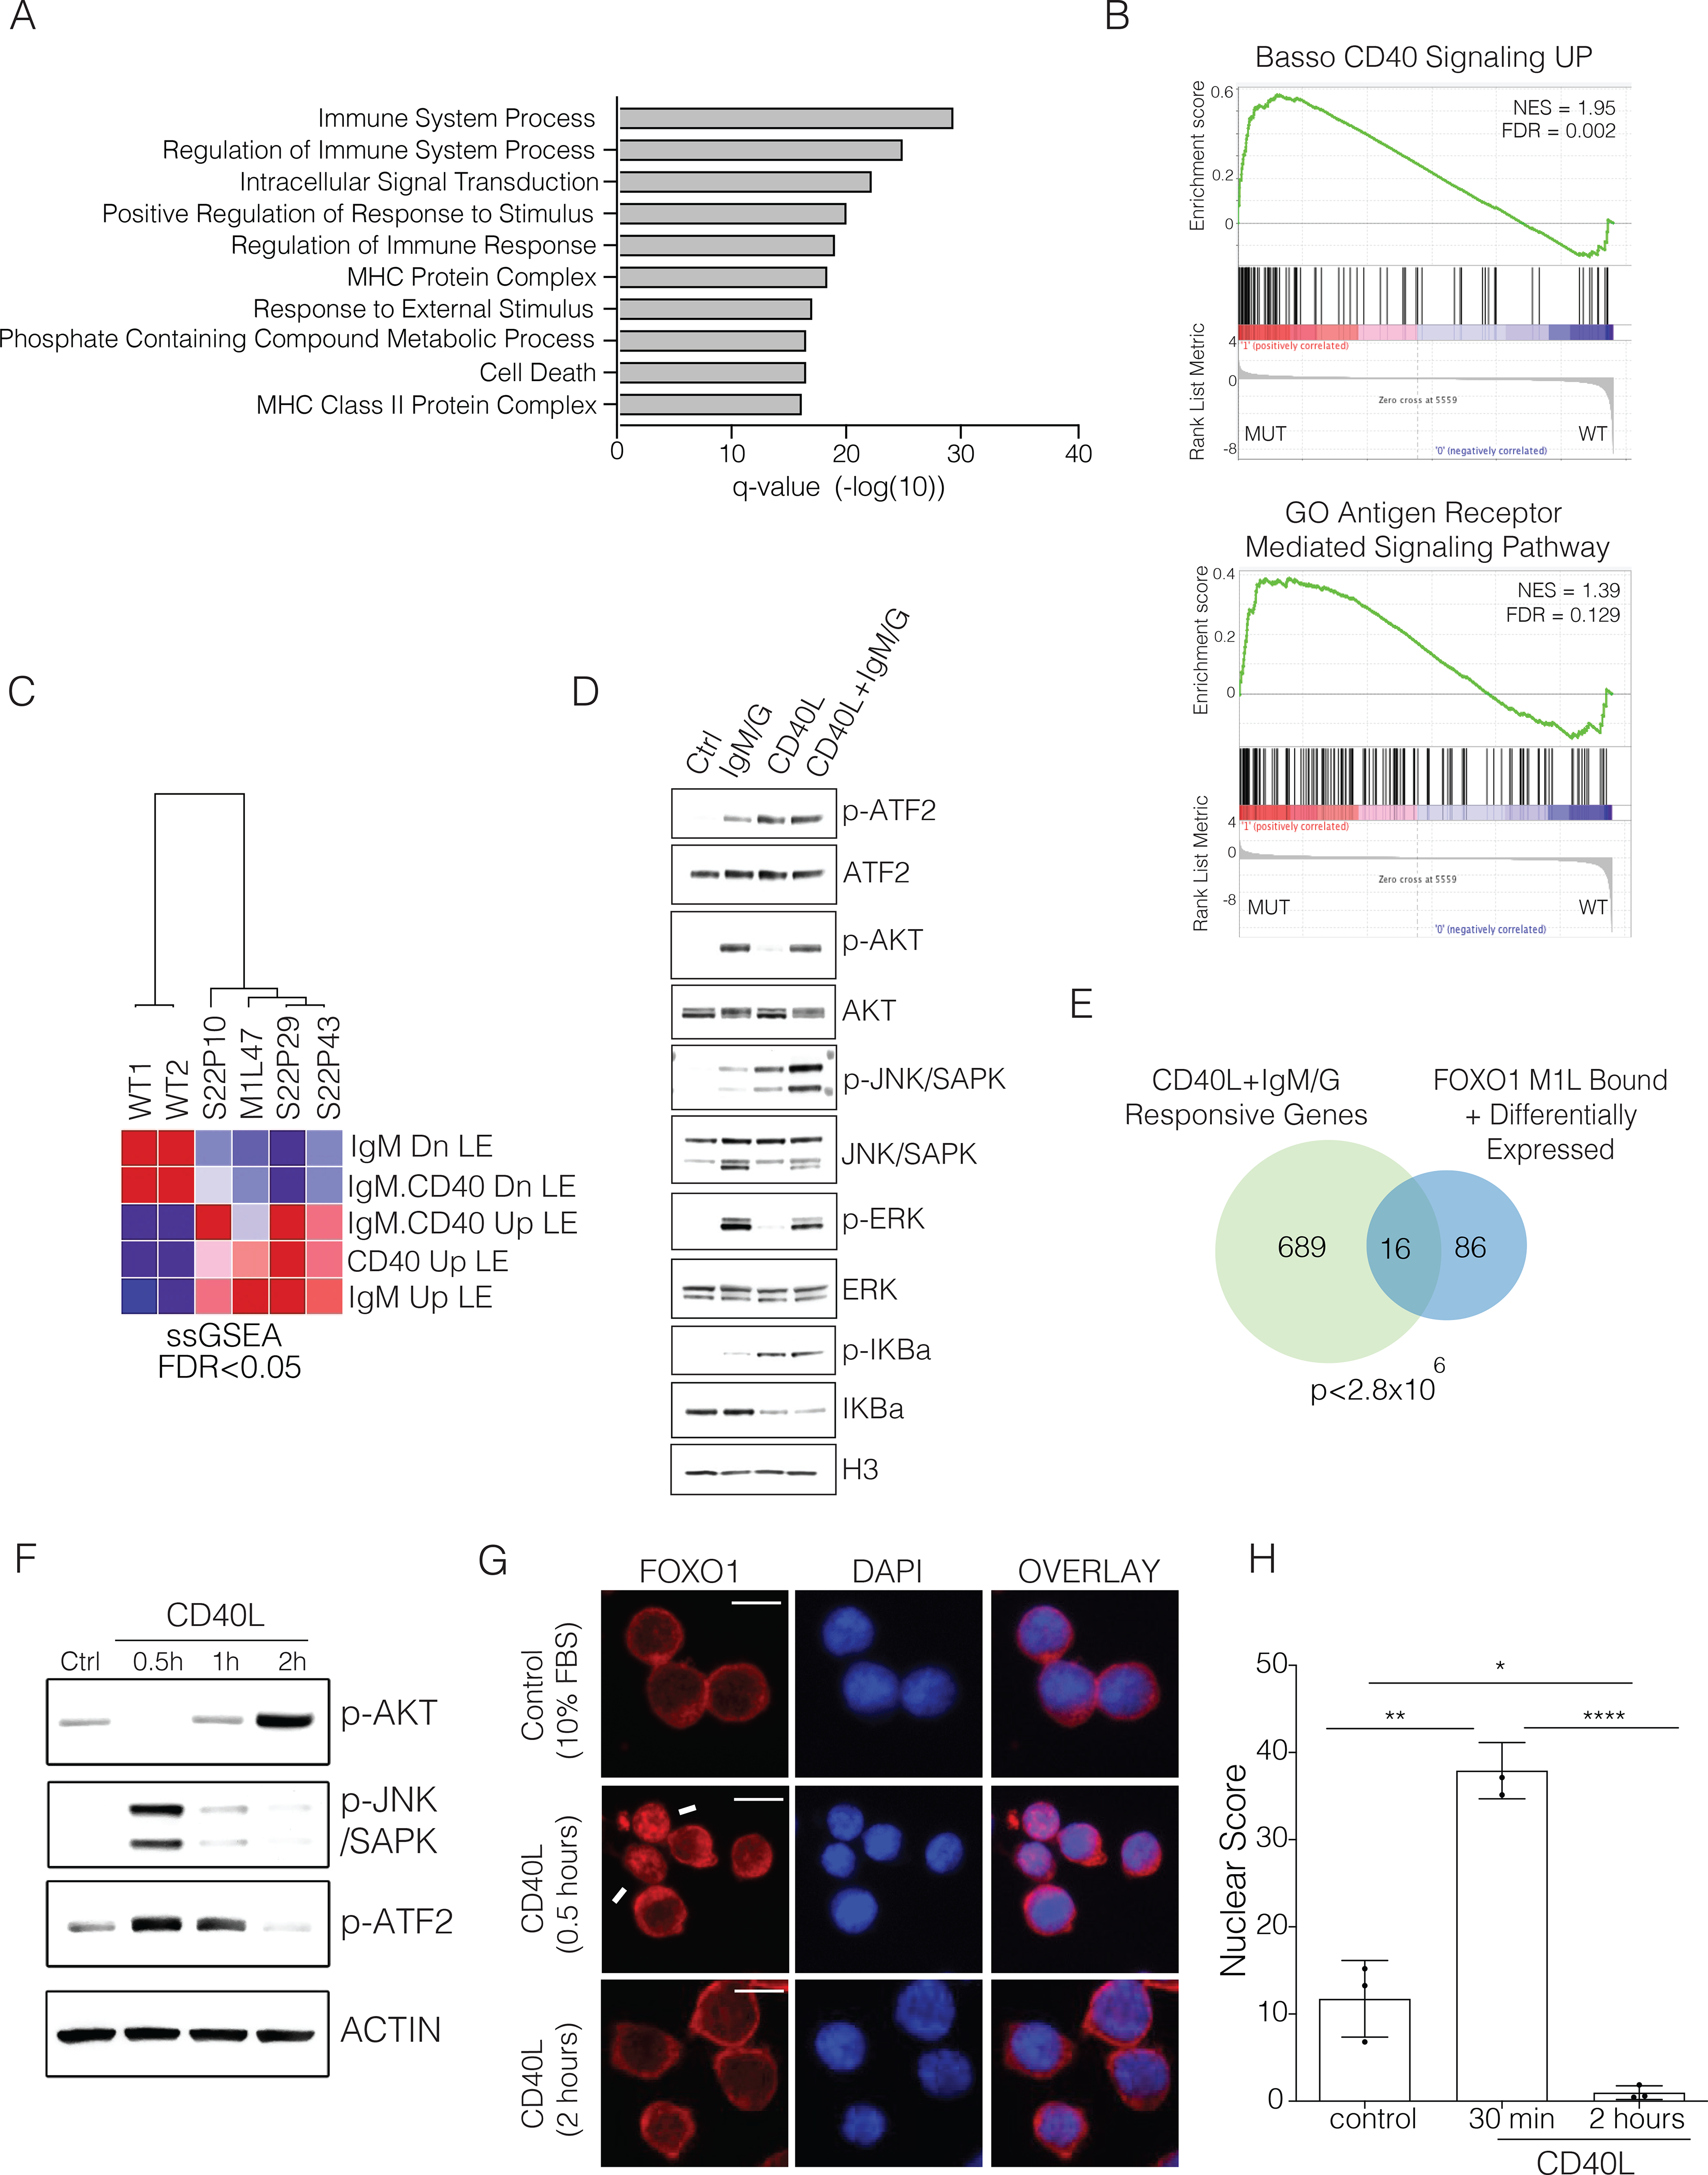
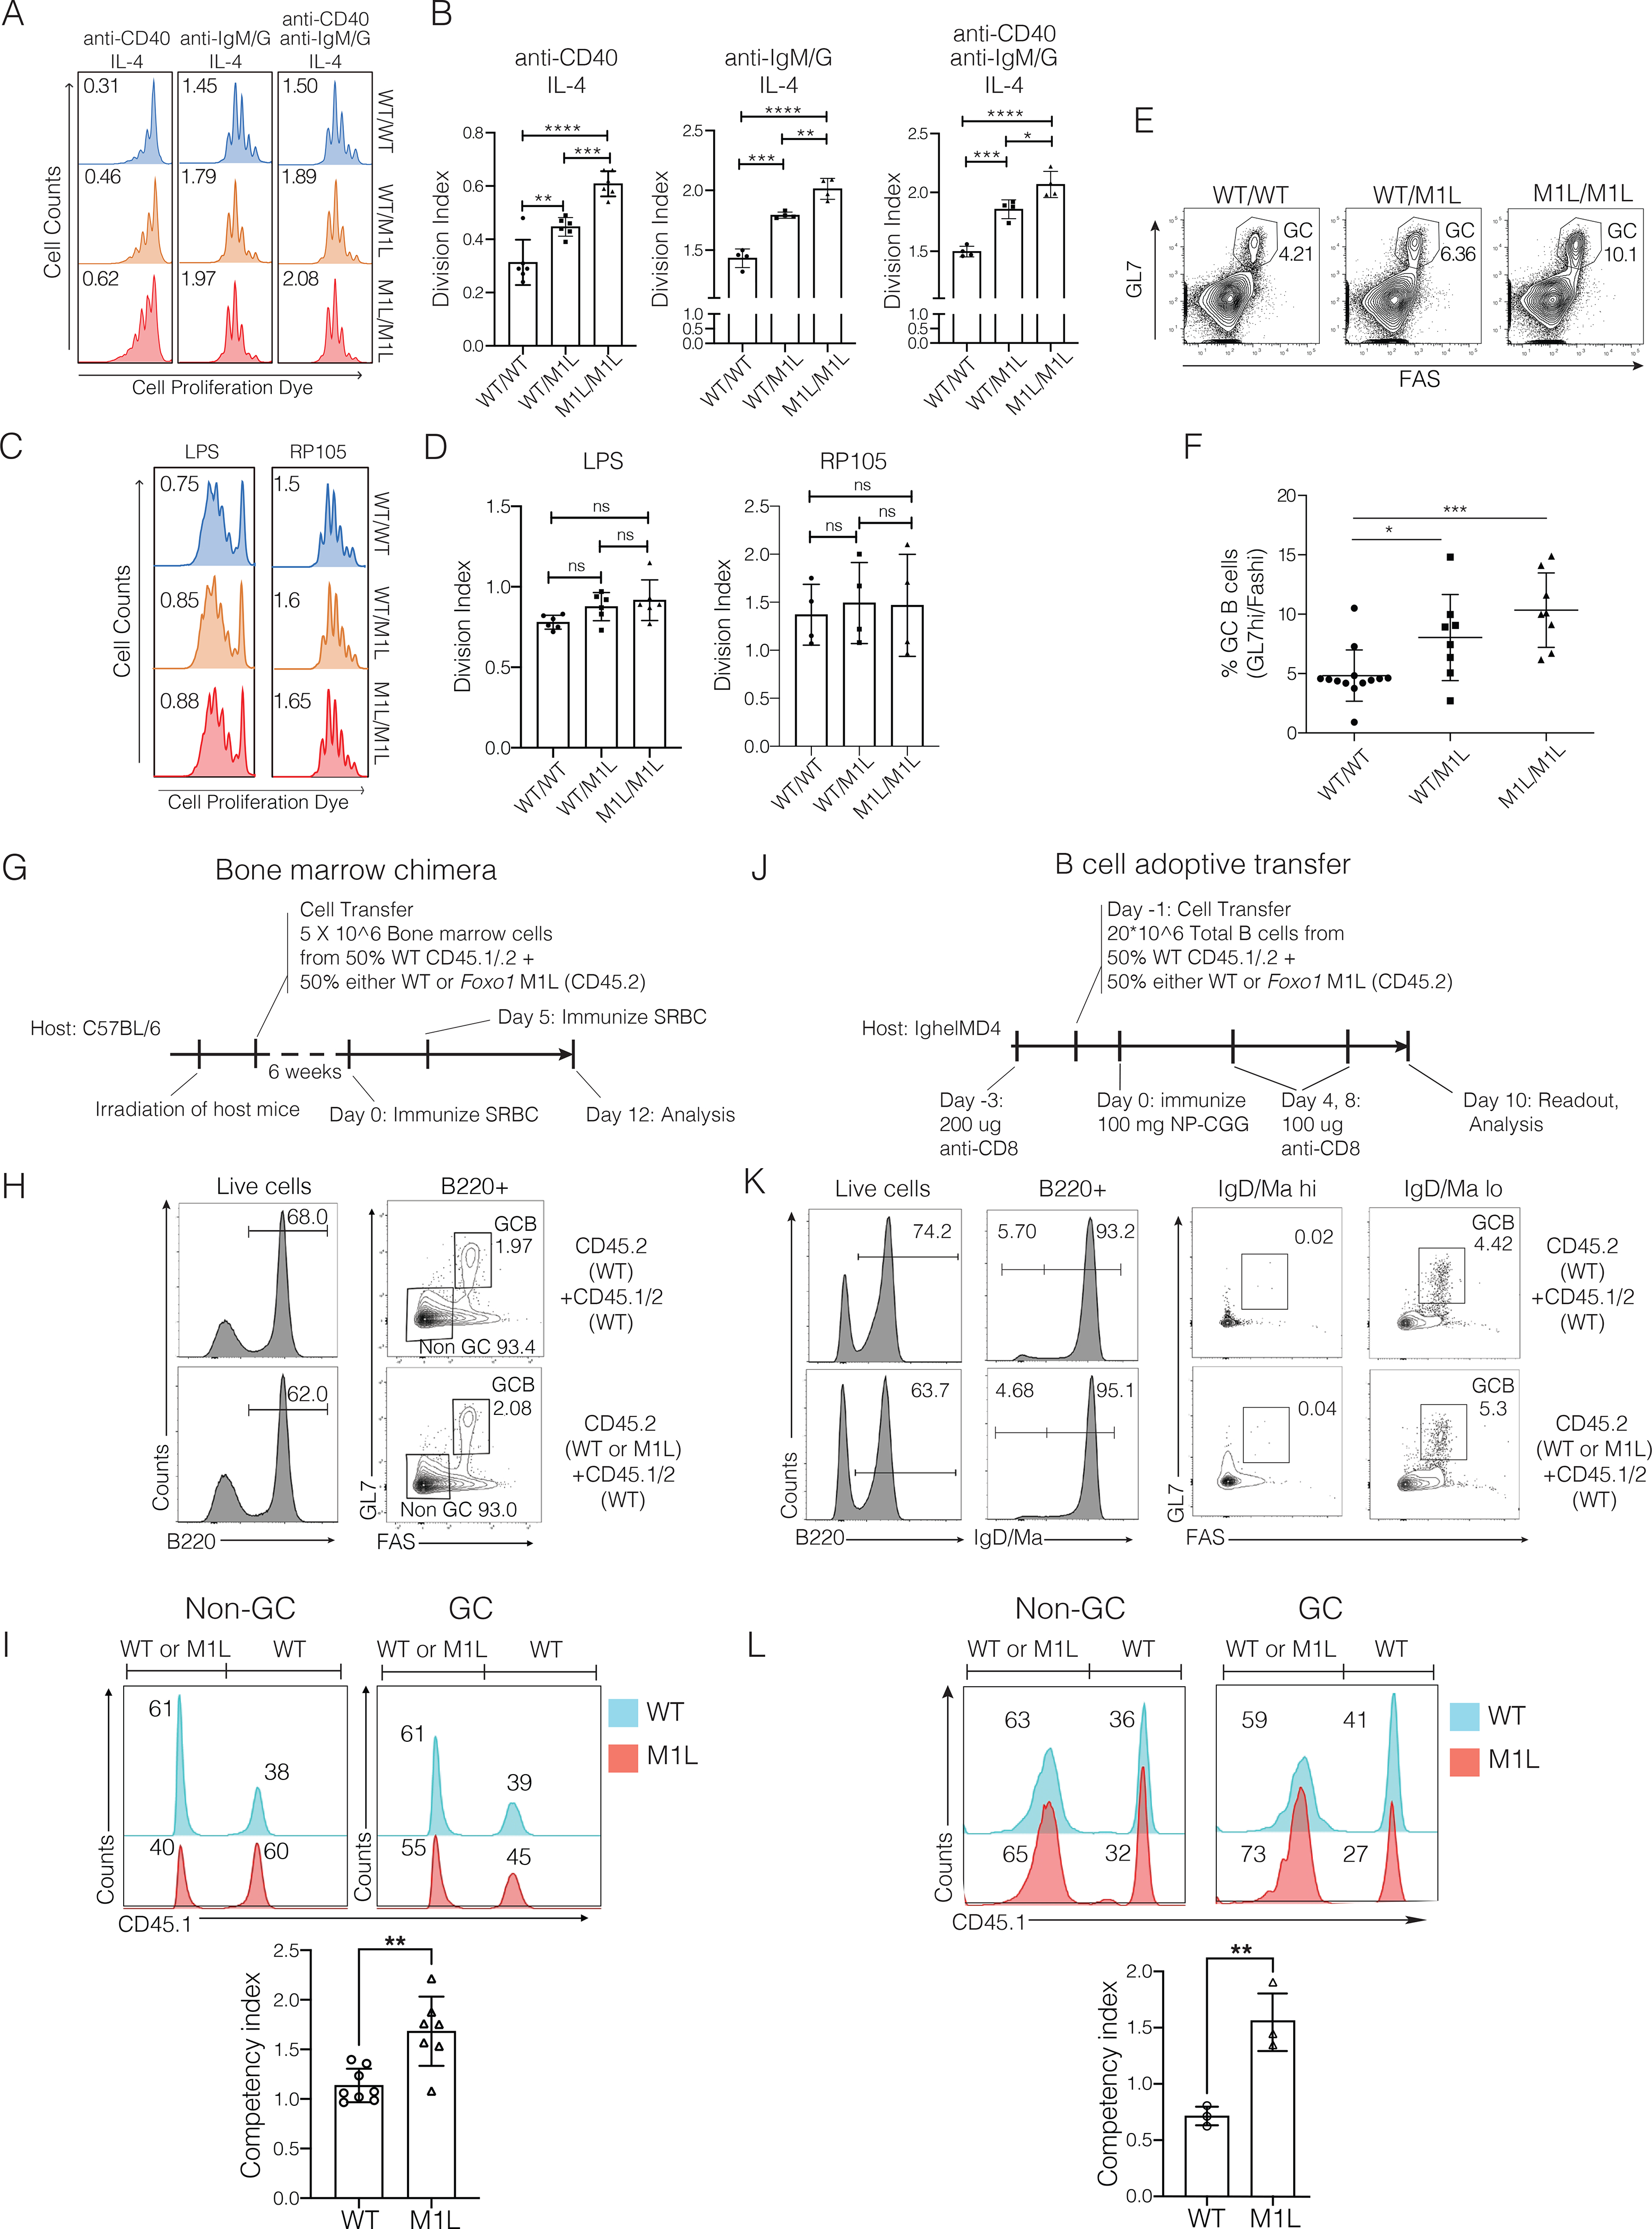
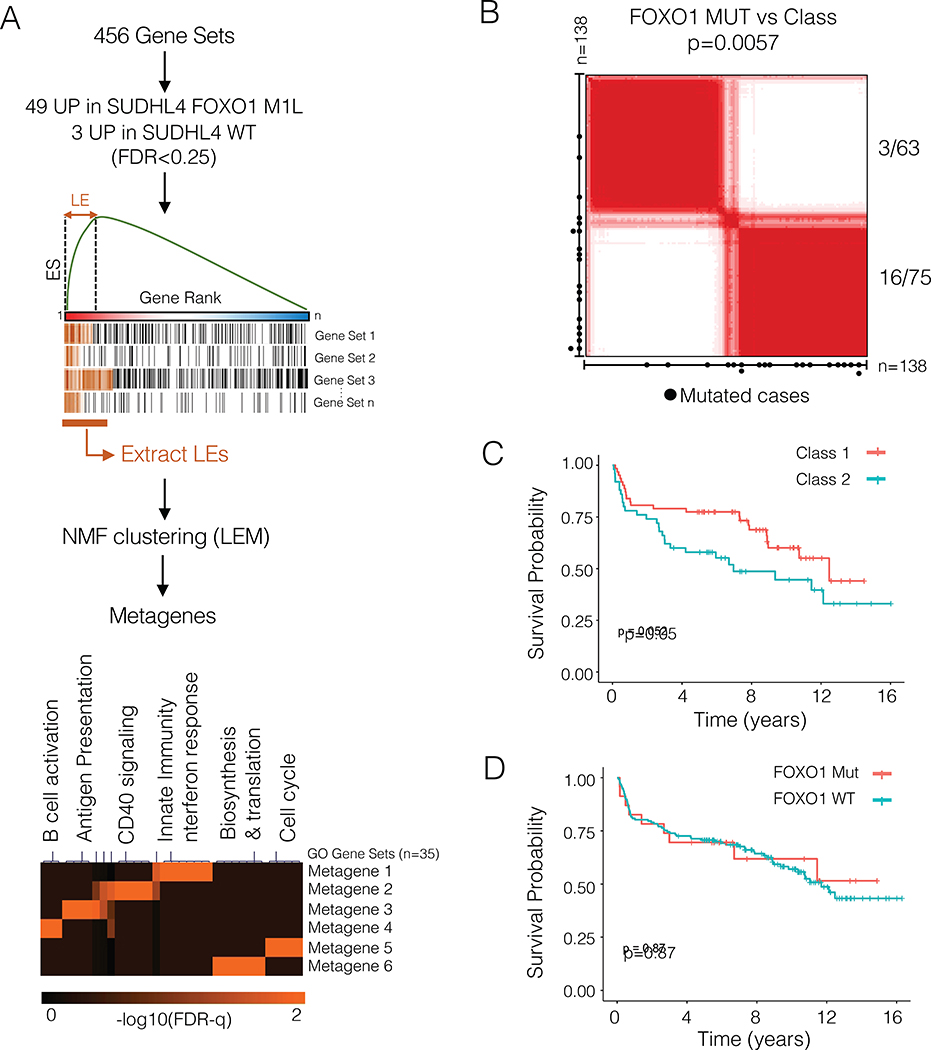
The transcription factor forkhead box O1 (FOXO1), which instructs the dark zone program to direct germinal center (GC) polarity, is typically inactivated by phosphatidylinositol 3-kinase (PI3K) signals. Here, we investigated how FOXO1 mutations targeting this regulatory axis in GC-derived B cell non-Hodgkin lymphomas (B-NHLs) contribute to lymphomagenesis. Examination of primary B-NHL tissues revealed that FOXO1 mutations and PI3K pathway activity were not directly correlated. Human B cell lines bearing FOXO1 mutations exhibited hyperactivation of PI3K and Stress-activated protein kinase (SAPK)/Jun amino-terminal kinase (JNK) signaling, and increased cell survival under stress conditions as a result of alterations in FOXO1 transcriptional affinities and activation of transcriptional programs characteristic of GC-positive selection. When modeled in mice, FOXO1 mutations conferred competitive advantage to B cells in response to key T-dependent immune signals, disrupting GC homeostasis. FOXO1 mutant transcriptional signatures were prevalent in human B-NHL and predicted poor clinical outcomes. Thus, rather than enforcing FOXO1 constitutive activity, FOXO1 mutations enable co-option of GC-positive selection programs during the pathogenesis of GC-derived lymphomas.

Keywords: B cell; CD40; FOXO1; JNK; PI3K; germinal center; mouse model; mutation; non-Hodgkin lymphoma; positive selection.


Conflict of interest statement

Declaration of interests The authors declare no competing interests.

Figures

Figure 1:
Figure 1:. Correlates between FOXO1 mutations, subcellular localization, and PI3K/AKT signaling status in human DLBCL
A) Distribution of 37 FOXO1 mutations found in a series of 345 primary DLBCL (BCC lymphoma collection), colored by categories (Arthur et al., 2018; Ennishi et al., 2019). ‘Other’ refers to in-frame deletions or frameshift mutations. B) Representative images of DLBCL samples stained for FOXO1 (left, subcellular distribution) and p-AKT S473 (right, IHC scores) via immunohistochemistry. Scale bars, 100 microns. C) Left: Summary of FOXO1 subcellular distribution in WT or mutant FOXO1 DLBCL cases. Cases with no detectable FOXO1 protein scored as “negative”. Chi-squared test, not significant. Right: FOXO1 subcellular distribution in mutant cases, subdivided into “T24” (mutations in M1 or R19-L27 segment) and non-“T24” mutations. D) p-AKT scores in WT or mutant FOXO1 patient samples stratified by FOXO1 mutation status. ns, non-significant (Mann-Whitney U Test). E) Distribution of FOXO1 subcellular localization in patient samples according to mutational status and p-AKT score. “High” and “Low” correspond to cases within the top and bottom quartiles of p-AKT scores, respectively. F) Quantification of p-AKT levels in patient samples with or without FOXO1 mutations, separated into DLBCL subtypes (GCB, ABC, or unclassified). ns, non-significant (Mann-Whitney U Test). Violin plots (C-E) show median with upper and lower quartiles. See also Fig.S1 and Table S1.
Figure 2:
Figure 2:. Signaling rewiring by FOXO1 mutants alters FOXO1 distribution in response to upstream signals
A) Re-localization of FOXO1 proteins in WT or FOXO1 M1L/M1L isogenic SUDHL4 cells (immunofluorescence) in response to exposure to anti-IgM/IgG, PI3K inhibitor (GDC-0941) or the combination for 30 minutes (see STAR Methods). Starvation induced by switching cultures to HBSS plus 1% IMDM for 2 hours. Images representative of 4–5 experiments (two technical replicates per clone, two clones per variant, including two WT single clone control lines). Scale bar =100 microns B) Nuclear scores for FOXO1 extracts from IF data in A (see STAR Methods). A minimum of 100 cells were counted for each experiment. Mean ± SD. C) Immunoblot of FOXO1 WT or M1L SUDHL4 cells, treated as described in panel A. Findings were confirmed using a WT clonal control line. D) Immunoblot analysis of WT or mutant FOXO1 isogenic SUDHL4 CRISPR clones (homozygous M1L/M1L; heterozygous WT/S22P and WT/T24I), cultured in IMDM with 10% FBS. Findings were validated using multiple WT single clone controls. E) Densitometry analysis of panel D. Phosphorylated protein levels normalized to total protein, and data from all three mutant cell lines normalized to FOXO1 levels in WT cells. See also Fig.S3. F) Immunofluorescence analysis of FOXO1 protein distribution in WT or FOXO1 M1L/M1L isogenic SUDHL4 cells in response to JNK-IN8 (1uM; 30 min). Images representative of 4–5 experiments (two technical replicates per clone, two clones per variant, including two WT single clone control lines). Scale bar =100 microns G) Summary of FOXO1 nuclear scores (as per immunofluorescence in panel F, see STAR Methods). A minimum of 100 cells were counted for each experiment. Mean ± SD.Unpaired t-test: *p<0.05; **p<0.01, ***p< 0.001
Figure 3:
Figure 3:. Abnormal hyperactivation of PI3K and SAPK/JNK signaling confers increased resistance to starvation-induced apoptosis in FOXO1 mutant SUDHL4 cells
A) Schematics of cell competition assay: CRISPR-edited SUDHL4 clones were transduced with lentiviral particles encoding mCherry (wildtype cells, WT) or GFP (mutant cells, Mut). GFP+ and mCherry+ cells were mixed in 1:1 ratio and co-cultured in full medium (Ctrl, IMDM with 10% FBS) or starvation medium (HBSS with 1% IMDM). GFP:mCherry ratios determined by flow cytometry. A WT (mCherry): WT(GFP) co-culture was used as control. B) Representative flow cytometry analysis of SUDHL4 WT:M1L co-cultures in full medium or under starvation (48h). See also Fig.S4. C) Summary of results of co-culture experiments. Ratios between GFP+ over mCherry+ cells are shown. Each dot represents one independent experiment. WT(GFP+):WT(mCherry+) co-cultures were used as control. Average ± SD. Unpaired t-test: *: p<0.05; **: p<0.01 ***: p< 0.001 D) Representative flow cytometry analysis of caspase-3 activation in FOXO1 WT and mutant SUDHL4 clones (6h co-culture). Results from multiple clones, including two individual WT single clone-derived cells are summarized in panel E. See also Fig.S4. E) Summary of data from panel D. Each dot represents one independent experiment. Mean ± SD (Student’s t-test, two-tailed). Unpaired t-test: *p<0.05; **p<0.01, ***p< 0.001
Figure 4:
Figure 4:. Defective mutant FOXO1 transcriptional repertoires dysregulate signal transduction pathways in GC B cells
A) Immunoblot analysis in chromatin-enriched fractions of WT or M1L mutant SUDHL4 isogenic clones grown in complete medium or upon starvation (2 hr). Total lysates are included for reference. Result representative of 2 independent experiments, validated using a single cell WT clone. B) Overlap between ChIP-seq peaks (MACS2; cutoff p<10−5) found in WT or M1L FOXO1 SUDHL4 cells. Overlap was determined using the HOMER mergePeaks function. See also Fig.S5A and Table S2. C) The heat maps depict sequencing read densities for FOXO1 WT and M1L unique ChIP-seq peaks, centered around peak centers, as determined through the HOMER mergePeaks function. See also Fig.S5B and Table S2. D) Most significant enriched motifs in WT only, M1L only, or common peak regions, as defined by de novo motif enrichment (findMotifsGenome function in HOMER). See also Table S2. E) Left: Comparative RNA-seq analysis of FOXO1 WT (n=2) and mutant (n=5) SUDHL4 clones (448 differentially expressed genes; DESeq2, padj value<0.05). Right: Normalized ChIP-seq read densities for FOXO1 proteins in peaks corresponding to differentially expressed genes. p-values calculated using Kolmogorov-Smirnov test. See also Table S3. F) Gene Ontology analysis (hypergeometric distribution test, Investígate Gene Set tool, MSigDB) of genes both differentially expressed and bound when comparing WT and FOXO1 M1L cells (n=102). See also Table S3. G) qPCR data for PHLPP1 mRNA expression in WT parental line (n=1), WT single clone-derived lines (n=4) and mutant (n=6) FOXO1 SUDHL4 cells cultured in 10% FBS. (p<0.0001, Unpaired, two-tailed Student’s t-test). Equivalent results were observed upon serum starvation (data not shown). H) Immunoblot for PHLPP1 protein in WT and mutant FOXO1 SUDHL4 cell lysates, cultured in full media (10% FBS). I) ChIP-seq tracks from WT or M1L FOXO1 proteins at the PHLPP1 gene locus. Read density tracks from pooled replicates (n=2 WT, n=2 M1L). Y axis shows reads per kilobase per million. The H3K27ac ChIP-seq track (SUDHL4 cells) is from GEO accession num. GSE132365. J) Left: Immunoblot analysis of WT SUDHL4 cells 72h post dox-induction of non-targeting and PHLPP1-specific shRNAs. Blot representative of two independent experiments. Right: Densitometry quantification. Phosphorylated protein in PHLPP1 knockdown cells normalized to levels in control cells.
Figure 5:
Figure 5:. FOXO1 mutants mimic positive selection programs and CD40/BCR activation in GC B cells
A) Gene ontology analysis of 448 genes differentially expressed (DESeq2, padj<0.05) between WT and mutant FOXO1 SUDHL4 cells. Top 10 gene ontologies are shown (hypergeometric distribution, investigate Gene Set tool, MSigDB). See also Table S3. B) Enrichment plots (GSEA) for CD40 and antigen receptor (BCR) gene sets in FOXO1 mutant SUDHL4 cells (see also Table S3). C) Heat map showing results from single-sample Gene Set Enrichment Analysis (ssGSEA) on WT and Mutant FOXO1 SUDHL4 cells, upon interrogating leading edge (LE) genes related to IgM, CD40, or IgM+CD40 stimulation in Ramos cells (Basso et al., 2004) and enriched upon treatment of parental SUDHL4 cells with CD40L and anti-IgM/G antibody (Table S3). D) Immunoblot analysis of SUDHL4 cells stimulated for 30 minutes with anti IgM/G, CD40 ligand, or both for 30 minutes. E) Venn diagram showing overlap of genes differentially expressed in SUDHL4 cells after stimulation with CD40L and anti-IgM; and genes bound by FOXO1 and differentially expressed in FOXO1 WT vs Mutant SUDHL4 cells (Hypergeometric distribution test). See also Table S3. F) Immunoblot analysis of SUDHL4 cells stimulated with CD40L. Lysates from SUDHL4 cells cultured in complete growth medium are used as control. Data representative of 3 independent experiments, validated using a single clone-derived WT SUDHL4 cell lines. G) Immunofluorescence analysis of FOXO1 subcellular distribution in WT SUDHL4 cells in response to CD40L. White arrows point at cells with nuclear FOXO1. Representative images shown (3–5 independent experiments) including validation with an isogenic WT SUDHL4 clonal line. Scale bar=10 microns. H) Quantification of immunofluorescence analysis (F). Data is displayed as the percentage of cells with nuclear FOXO1. A minimum of 100 cells were counted per replicate (n=3–5), Unpaired t test: *p < 0.05; **p < 0.01; ****p < 0.0001.
Figure 6:
Figure 6:. Enhanced sensitivity to T-dependent immune signals and competitive expansion of Foxo1 M1L mutant B cells during GC responses
A) Representative flow cytometry analysis of cell proliferation in Foxo1WT/WT, Foxo1WT/M1L and Foxo1M1L/M1L B cells stimulated for 72 hours with different cytokine plus agonist antibody combinations (see figure and STAR Methods for details). Division indices are shown in the top left corner of each graph. B) Division Index summaries (4–6 biological replicates per each group in panel A). Average ± SEM (ns, not significant, unpaired Student’s t-test). C) Representative flow cytometry analysis of cell proliferation in B cells stimulated for 72 hours with LPS (1 ug/mL) or RP105 (1 ug/mL). Division indices for each population are shown. D) Division Index summaries (n=6 LPS, n=4 RP105). Average ± SEM (ns, not significant, unpaired Student’s t-test). (E-F) Analysis of germinal center responses upon SRBC immunization (spleen, 12 days post-immunization). Panel E, Representative contour plots, flow cytometry analysis of GC B cell fractions (B220+/GL7hi/Fashi). Results are summarized in panel F graph, each symbol represents a single mouse. Mean ± SD. Unpaired Sudent’s t test (See also Fig. S6F–H). G-I) Analysis of competitive GC B cell expansion in mixed bone marrow chimeras. G) Schematic representation of experimental strategy. Irradiated host C57BL/6 mice were reconstituted with bone marrow progenitors isolated from Foxo1WT/WT or Foxo1M1L/M1L (CD45.2), mixed at 1:1 ratio with wildtype CD45.1/.2 progenitors, immunized and analyzed 12 days later. H) Representative flow cytometry plots showing gating of GC B cells (B220+, FAShi, GL7hi) and non-GC B cells (B220+, Faslo, Gl7lo) in splenocytes from mixed chimeras. I) (Top panel) Representative flow cytometry histograms showing the distribution of CD45.1+ (CD45.1/2) and CD45.1- (CD45.2) B cells in GC and non-GC cell compartments. (Bottom panel) Competitive competencies for CD45.1 cells in GC B cell fractions (see STAR Methods for details). J-L) Analysis of competitive GC B cell expansion upon B cell adoptive transfer in IghelMD4 mice. J) Schematic representation of experimental strategy (see STAR Methods for additional details). K) Gating strategy. GC B cells are gated as GL7hiFashi. IghelMD4 B cells are IgD/Ma+ and respond poorly to (4-hydroxy-3-nitrophenyl)acetyl (NP)-peptide conjugates (Goodnow et al., 1988; Mason et al., 1992). Transferred in large numbers, donor B cells are preferentially recruited to GCs (compare IgD/Mahi and IgD/Malo panels). L) (Top panel) Representative flow cytometry results, distribution of CD45.1+ (WT) and CD45.1- (Foxo1WT/WT or Foxo1M1L/M1L) B cells in IgD/MaGC and non-GC B cell fractions. (Bottom panel) Competitive competencies for CD45.1 donor cells (n=3 per group). For all statistical tests, unpaired t-test: *p<0.05; **p<0.01; ***p<0.001.
Figure 7:
Figure 7:. Functional FOXO1 mutant metagenes are conserved in human DLBCL and predict clinical outcome
A) Definition of a functional classifier from RNA-seq data generated in WT vs mutant FOXO1 SUDHL4 isogenic clones. The leading edges of gene-sets enriched at FDR<0.25 in any group (wildtype vs mutant) were clustered into metagenes (Table S4 and STAR Methods). Pathways significantly represented within these metagenes are shown as single-sample Gene Set Enrichment Analysis (ssGSEA) scores in the heatmap below. B) Consensus clustering of GCB-type DLBCL patient samples (n=138) in two functional classes using ssGSEA scores for each metagene. The p-value indicates the enrichment of mutant FOXO1 cases in Class 1 vs. Class 2 (Fisher’s Exact test). C-D) Kaplan-Meier curves for survival probability (univariate analysis). DLBCL patients were stratified by functional class or mutational identity (n=183). p-values, log-rank test.

Similar articles

Cited by

References

    1. Aggarwal M, Sanchez-Beato M, Gomez-Lopez G, Al-Shahrour F, Martínez N, Rodríguez A, Ruiz-Ballesteros E, Camacho FI, Perez-Rosado A, de la Cueva P, et al. (2009). Functional signatures identified in B-cell non-Hodgkin lymphoma profiles. Leuk Lymphoma 50, 1699–1708. - PubMed
    1. Alizadeh AA, Eisen MB, Davis RE, Ma C, Lossos IS, Rosenwald A, Boldrick JC, Sabet H, Tran T, Yu X, et al. (2000). Distinct types of diffuse large B-cell lymphoma identified by gene expression profiling. Nature 403, 503–511. - PubMed
    1. Anders S, Pyl PT, and Huber W (2015). HTSeq--a Python framework to work with high-throughput sequencing data. Bioinformatics 31, 166–169. - PMC - PubMed
    1. Arthur SE, Jiang A, Grande BM, Alcaide M, Cojocaru R, Rushton CK, Mottok A, Hilton LK, Lat PK, Zhao EY, et al. (2018). Genome-wide discovery of somatic regulatory variants in diffuse large B-cell lymphoma. Nat Commun 9, 4001. - PMC - PubMed
    1. Baffi TR, Cohen-Katsenelson K, and Newton AC (2021). PHLPPing the Script: Emerging Roles of PHLPP Phosphatases in Cell Signaling. Annu Rev Pharmacol Toxicol 61, 723–743. - PMC - PubMed

Publication types

MeSH terms