. 2021 Aug 11;7(33):eabg6522.
doi: 10.1126/sciadv.abg6522. Print 2021 Aug.

Protein detection in blood with single-molecule imaging

Affiliations

Protein detection in blood with single-molecule imaging

Chih-Ping Mao et al. Sci Adv. .

Abstract

The ability to characterize individual biomarker protein molecules in patient blood samples could enable diagnosis of diseases at an earlier stage, when treatment is typically more effective. Single-molecule imaging offers a promising approach to accomplish this goal. However, thus far, single-molecule imaging methods have not been translated into the clinical setting. The detection limit of these methods has been confined to the picomolar (10-12 M) range, several orders of magnitude higher than the circulating concentrations of biomarker proteins present in many diseases. Here, we describe single-molecule augmented capture (SMAC), a single-molecule imaging technique to quantify and characterize individual protein molecules of interest down to the subfemtomolar (<10-15 M) range. We demonstrate SMAC in a variety of applications with human blood samples, including the analysis of disease-associated secreted proteins, membrane proteins, and rare intracellular proteins. SMAC opens the door to the application of single-molecule imaging in noninvasive disease profiling.


Figures

Fig. 1
Fig. 1. SMAC chip design.
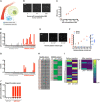
(A) Schematic diagram of the SMAC platform. Proteins of interest were pulled down as clusters via continuous oscillating flow on a multivalent microfluidic device and then probed with fluorophore-labeled detection antibody (Ab). PEG, polyethylene glycol. (B) Schematic diagram depicting features of SMAC (bottom), contrasted to conventional single-molecule imaging methods (top), that enable single-molecule imaging of blood samples at subfemtomolar sensitivity. The miniature size, high-density capture surface, patterned channel shape, and continuous oscillating flow scheme of the SMAC chip synergize to efficiently concentrate proteins of interest on the chip. (C) Target protein clusters were visualized by TIRF microscopy. (D) Schematic diagrams depicting different binding types that give rise to different fluorescence intensity and spot size combinations.
Fig. 2
Fig. 2. SMAC and protein analysis methods.
(A) Schematic diagrams depicting different binding types that give rise to different fluorescence intensity and spot size combinations. Scatter plots (A) and decomposition (B) of spot sizes (σ) and intensities arising from different binding types after Gaussian fitting of each spot. These data were converted into a 2D histogram of intensity and σ as shown in (C). (C) The number of specific binding spots (SR counts) is obtained by subtracting the 2D histogram of a scaled reference histogram conveying the intensity-σ distributions of diffusive background and nonspecific binding from the 2D histogram of raw counts (see Materials and Methods for details). (D) Representative SMAC images of purified GFP molecules at 500 aM and 1 fM concentrations. The intrinsic fluorescence of GFP was measured without detection antibody. (E) Graph illustrating the sensitivity of SMAC with shape analysis (SR counts) using purified GFP from 10 aM to 1 fM. Data are expressed as means ± SD. Scale bar, 4 μm.
Fig. 3
Fig. 3. Detection of secreted and membrane proteins in blood by single-molecule imaging.
(A) Schematic diagram of secreted PSA release from a tumor cell (lime) into a blood vessel (red). SMAC images (B) and shape analysis (C) of purified human PSA at femtomolar concentrations in aqueous buffer. (D) Quantification of PSA in lysate from different numbers of human prostate cancer cells (LnCaP) added into aqueous buffer. SMAC images (E) and quantification of PSA (F) in lysate from one LnCaP cell in either aqueous buffer or human plasma. (G) PSA levels in the blood of patients with prostate cancer (n = 5) and healthy male (n = 4) and female (n = 4) control blood donors. (H) Schematic diagram of membrane-bound programmed death-ligand 1 (PD-L1) release from a tumor cell (lime) into a blood vessel (red). SMAC images (I) and shape analysis (J) of purified human PD-L1 at femtomolar concentrations in aqueous buffer. (K) Quantification of circulating PD-L1 levels in patients with high-grade squamous intraepithelial lesions (HSILs; n = 6) and healthy donors (n = 5). PSA data and PD-L1 data are expressed as means ± SD. Scale bars, 4 μm.
Fig. 4
Fig. 4. Detection of cytoplasmic and nuclear proteins in blood by single-molecule imaging.
(A) Schematic diagram of intracellular cytoGFP release from a tumor cell (lime) into a blood vessel (red). (B) SMAC quantification of serum cytoGFP levels in naïve mice (gray circles; n = 8) and tumor-bearing mice 1 week after oropharyngeal (blue circles; n = 4) or subcutaneous (red circles; n = 4) injection of cytoGFP+ tumor cells (TC-1). (C to E) To induce a spontaneous cytoGFP+ tumor, mice (n = 10) were administered with DNA encoding RasG12V, p53 shRNA, cytoGFP, and luciferase. Graph depicting the relationship between tumor luciferase and serum cytoGFP concentrations assessed by SMAC at an end point of more than 2 months (C) or throughout the first 2 months (D). In (C), tumor-induced mice that displayed a grossly visible tumor were labeled “tumor” (red circles), while those that did not were labeled “pretumor” (blue circles). Using the kinetics data in (D), the time correspondence between serum cytoGFP levels and tumor burden was determined by cross-correlation analysis (E). (F) SMAC images of purified human p53 at femtomolar concentrations in aqueous buffer. Scale bar, 4 μm. (G) Comparison of the sensitivity of SMAC with shape analysis (SR counts, red circles) and ELISA [OD450nm (optical density at 450 nm), blue circles] using purified human p53. The dotted line indicates the ELISA detection limit. (H and I) To stimulate a spontaneous tumor carrying mutant human p53, mice (n = 10) were administered with DNA encoding human p53R175H, RasG12V, and luciferase. Time-course (H) and cross-correlation (I) plots depicting the relationship between tumor luciferase and serum mutant p53 levels measured by SMAC. For cross-correlation plots, each unit time lag is around 5 days. All data are expressed as means ± SD. ****P < 0.0001. P values are from a two-sided unpaired t test.
Fig. 5
Fig. 5. Detection of circulating mutant proteins and autoantibodies in blood by single-molecule imaging.
(A) Schematic diagram depicting release of nuclear p53 from a tumor cell (lime) and anti-p53 autoantibodies from a tumor-specific B cell (aqua) into a blood vessel (red). SMAC images (B) and shape analysis (C) of purified human p53 added at femtomolar concentrations in human plasma. (D) Shape analysis of circulating mutant p53 levels in plasma from patients with HGOC and healthy female blood donors. (E) SMAC images of endogenous anti-p53 autoantibodies in different plasma volumes, from the microliter (10−6 liters) to picoliter (10−12 liters) range, in a patient with HGOC. (F) Comparison of the sensitivity of SMAC (counts, red circles) and ELISA (U/ml, blue circles) using human anti-p53 autoantibodies in human plasma. (G) Quantification of endogenous plasma anti-p53 autoantibodies from patients with HGOC and healthy female blood donors; same cohort as in (D). (H) Heatmap depicting the relative levels of circulating mutant p53 or anti-p53 autoantibodies in the blood of patients with HGOC and healthy blood donors; same cohort as in (D) and (G). (I) Heatmap depicting the relative levels of circulating mutant p53 or anti-p53 autoantibodies in an independent cohort of FIGO stage III ovarian cancer patients with p53-mutant tumors either before or after surgical resection. (J) SMAC analysis of circulating mutant p53 levels in early-stage (FIGO stage I/II) ovarian cancer patients with either p53–wild type (wt) or p53-mutant (mut) tumors. Data for individual human plasma samples (D, G, and J) are expressed as means ± SE; all other data are expressed as means ± SD. Scale bars, 4 μm.

References

    1. Giljohann D. A., Mirkin C. A., Drivers of biodiagnostic development. Nature 462, 461–464 (2009). - PMC - PubMed
    1. Barletta J. M., Edelman D. C., Constantine N. T., Lowering the detection limits of HIV-1 viral load using real-time immuno-PCR for HIV-1 p24 antigen. Am. J. Clin. Pathol. 122, 20–27 (2004). - PubMed
    1. Srinivas P. R., Kramer B. S., Srivastava S., Trends in biomarker research for cancer detection. Lancet Oncol. 2, 698–704 (2001). - PubMed
    1. Rissin D. M., Kan C. W., Campbell T. G., Howes S. C., Fournier D. R., Song L., Piech T., Patel P. P., Chang L., Rivnak A. J., Ferrell E. P., Randall J. D., Provuncher G. K., Walt D. R., Duffy D. C., Single-molecule enzyme-linked immunosorbent assay detects serum proteins at subfemtomolar concentrations. Nat. Biotechnol. 28, 595–599 (2010). - PMC - PubMed
    1. Nam J.-M., Thaxton C. S., Mirkin C. A., Nanoparticle-based bio-bar codes for the ultrasensitive detection of proteins. Science 301, 1884–1886 (2003). - PubMed

Publication types