. 2021 Nov;70(11):2545-2553.
doi: 10.2337/db21-0459. Epub 2021 Aug 11.

GIP Receptor Agonism Attenuates GLP-1 Receptor Agonist-Induced Nausea and Emesis in Preclinical Models

Affiliations

GIP Receptor Agonism Attenuates GLP-1 Receptor Agonist-Induced Nausea and Emesis in Preclinical Models

Tito Borner et al. Diabetes. 2021 Nov.

Abstract

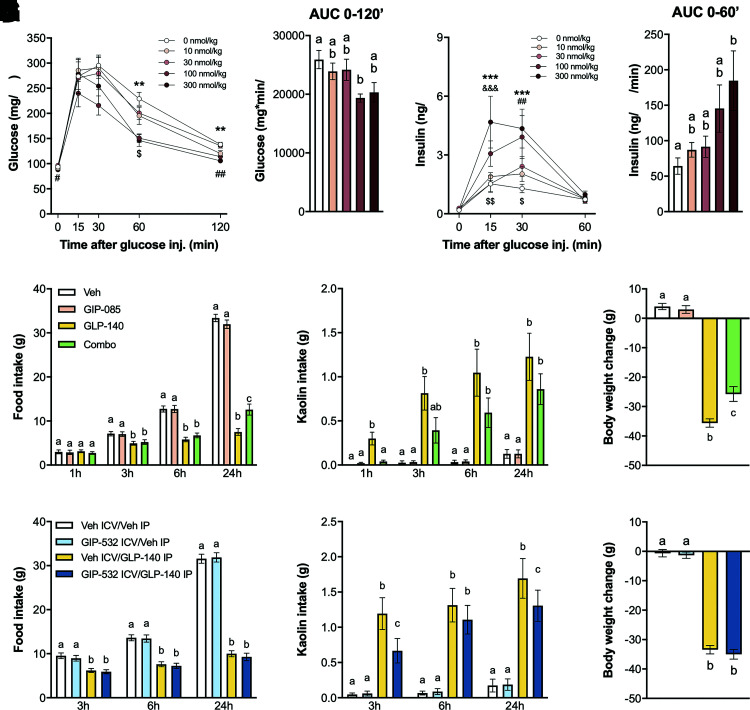
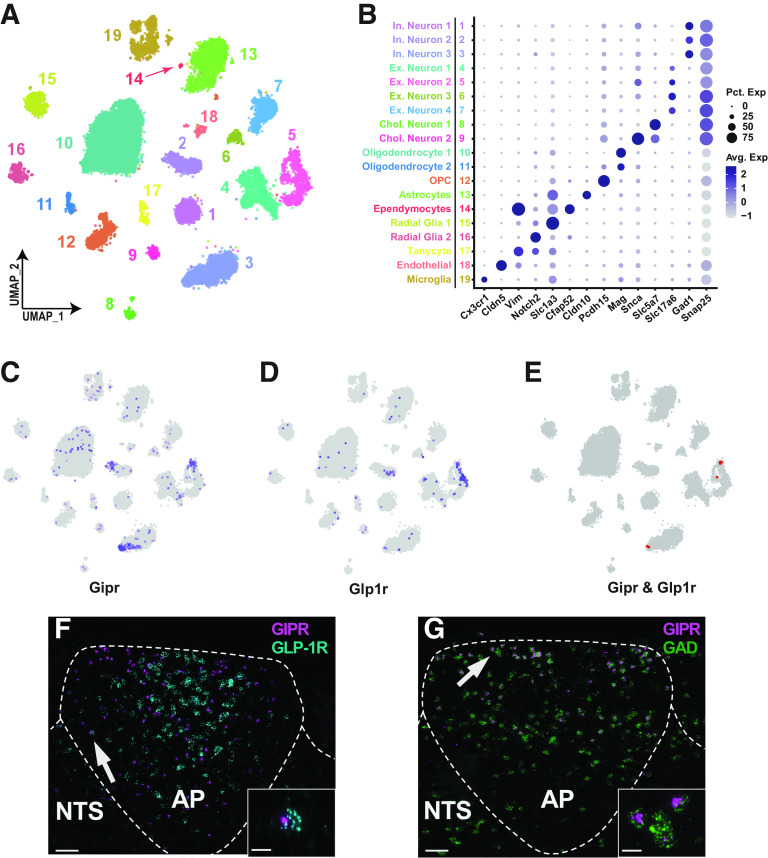
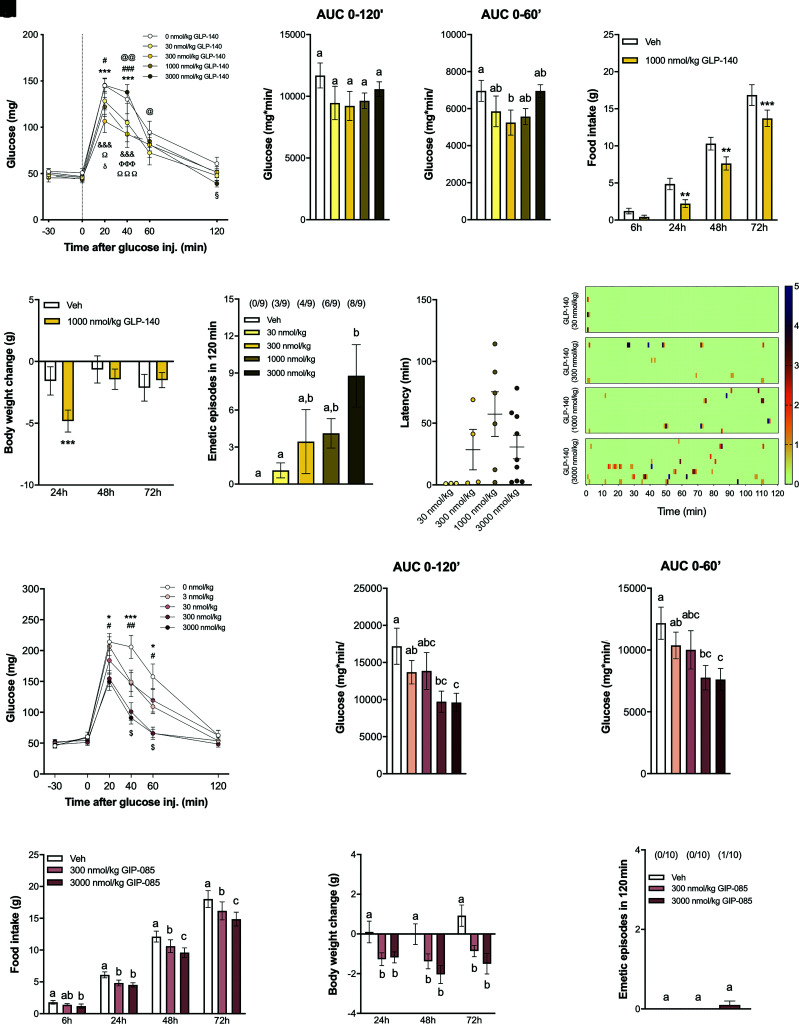
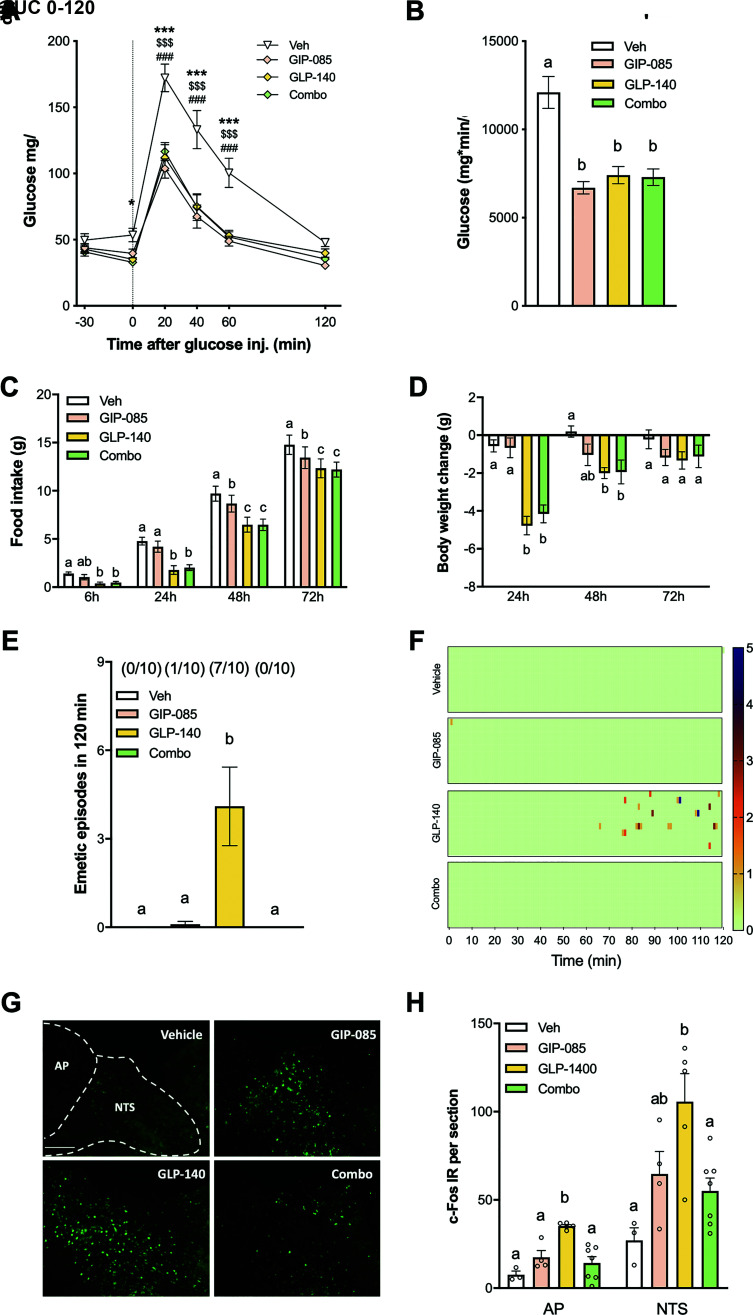
Glucagon-like peptide 1 receptor (GLP-1R) agonists decrease body weight and improve glycemic control in obesity and diabetes. Patient compliance and maximal efficacy of GLP-1 therapeutics are limited by adverse side effects, including nausea and emesis. In three different species (i.e., mice, rats, and musk shrews), we show that glucose-dependent insulinotropic polypeptide receptor (GIPR) signaling blocks emesis and attenuates illness behaviors elicited by GLP-1R activation, while maintaining reduced food intake, body weight loss, and improved glucose tolerance. The area postrema and nucleus tractus solitarius (AP/NTS) of the hindbrain are required for food intake and body weight suppression by GLP-1R ligands and processing of emetic stimuli. Using single-nuclei RNA sequencing, we identified the cellular phenotypes of AP/NTS cells expressing GIPR and GLP-1R on distinct populations of inhibitory and excitatory neurons, with the greatest expression of GIPR in γ-aminobutyric acid-ergic neurons. This work suggests that combinatorial pharmaceutical targeting of GLP-1R and GIPR will increase efficacy in treating obesity and diabetes by reducing nausea and vomiting.


Figures

Figure 1
Figure 1
GIP agonism enhances glucoregulation and attenuates GLP-1–induced illness behaviors in rats. A: GIP-085 (10, 30, 100, and 300 nmol/kg, SC) dose-dependently suppresses BG levels following an IPGTT (2 g/kg, IP) in lean rats (n = 6). Vehicle (Veh) vs. 300 nmol/kg: **P < 0.01; Veh vs. 100 nmol/kg: $P < 0.05; 30 nmol/kg vs. 300 nmol/kg: #P < 0.05, ##P < 0.01. B: Glucose AUC from 0 (i.e., postglucose bolus) to 120 min after treatment (n = 6 per group). C: GIP-085 (10, 30, 100, and 300 nmol/kg, SC) dose-dependently stimulates insulin secretion (n = 6 per group). Veh vs. 300 nmol/kg: ***P < 0.001; Veh vs. 100 nmol/kg: ##P < 0.01; 300 nmol/kg vs. 30 nmol/kg: &&& P < 0.001; 300 nmol/kg vs. 10 nmol/kg: $P < 0.05, $$P < 0.01. D: Insulin AUC from 0 (i.e., postglucose bolus) to 60 min after treatment (n = 6 per group). E: The anorectic effect of the long-acting GLP-1R agonist GLP-140 is reduced by GIP-085 combination (combo) treatment (GIP-085: 300 nmol/kg; GLP-140: 1,000 nmol/kg, IP; n = 18 per group). Indeed, GIP-085/GLP-140 treatment led to significantly (87 ± 20%) higher 24-h food consumption compared with GLP-140 alone. F: GIP-085 cotreatment attenuates kaolin intake (a validated proxy for nausea/emesis in rats) induced by GLP-140 (n = 18 per group). G: Body weight change following GLP-140, GIP-085, and combo treatments (n = 18 per group). H: Intracerebroventricular (ICV) infusion in the fourth ventricle (4th ICV) of the potent GIPR agonist GIP-532 (0.3 nmol, 1 μL) does not affect GLP-140–induced anorexia (GLP-140: 1,000 nmol/kg, IP). I: GIP-532 4th ICV attenuates kaolin intake induced by systemically delivered GLP-140 (GLP-140: 1,000 nmol/kg, IP; GIP-532: 0.3 nmol; n = 15 per group). J: Body weight change following GLP-140, GIP-532, and combo treatments (n = 15 per group). All data are expressed as mean ± SEM. Data in A, C, E, F, H, and I were analyzed with repeated-measures two-way ANOVA, followed by the Tukey post hoc test. Data in G and J were analyzed with repeated-measures one-way ANOVA, followed by the Tukey post hoc test. Data in B and D were analyzed with one-way ANOVA, followed by the Tukey post hoc test. Means with different letters are significantly different from each other (P < 0.05).
Figure 2
Figure 2
Transcriptomic identification of rat AP and NTS cell types by snRNAseq and FISH. A: A total of 19 transcriptomically distinct cell types were identified. B: Neuronal and nonneuronal cell types were identified by known transcriptional markers. Avg. Exp., average expression; Pct. Exp., percentage expression. Highlighted Uniform Manifold Approximation and Projections (UMAPs) identifying Gipr+ (C) and Glp1r+ (D) cell types. Most of the neurons positive for either receptor are limited to a small number of cell types. E: A highlighted UMAP showing that the Gipr+ and Glp1r+ neurons are largely independent. F and G: Representative FISH images showing Gipr+, Glp1r+, and Gad+ cells in AP and in the adjacent portion of the NTS (∼250-μm rostral to the obex). Scale bar, 50 μm.
Figure 3
Figure 3
GLP-140 and GIP-085 dose responses on BG levels, food intake, body weight, and emesis in shrews. A: GLP-140 (30, 300, 1,000, 3,000 nmol/kg, IP) dose-dependently suppressed BG levels following glucose administration (2 g/kg, IP). Vehicle (Veh) vs. 30 nmol/kg: @@P < 0.01, @@@P < 0.001; Veh vs. 300 nmol/kg: ***P < 0.001; Veh vs. 1,000 nmol/kg: #P < 0.05, ###P < 0.001; Veh vs. 3,000 nmol/kg: §P < 0.05; 30 vs. 3,000 nmol/kg: ΦΦΦP < 0.001; 300 vs. 3,000 nmol/kg: &&&P < 0.001; 1,000 vs. 3,000 nmol/kg: ΩP < 0.05, ΩΩΩP < 0.001 (n = 9 per group). B: AUC from 0 (i.e., postglucose bolus) to 120 min (n = 9 per group). C: AUC from 0 to 60 min (n = 9 per group). D: GLP-140 (1,000 nmol/kg, IP) induces profound anorexia in shrews (n = 7). E: GLP-140–induced anorexia is accompanied by body weight loss (n = 7). F: GLP-140 causes profound emesis during 120 min after injection in a dose-related fashion in shrews (n = 9). The number of animals exhibiting emesis, expressed as a fraction of the total number of animals tested, is indicated above each treatment group. G: Latency to the first emetic episodes of shrews that exhibited emesis following GLP-140 treatment. H: Heat maps showing latency, number, intensity, and frequency of emesis following different doses of GLP-140 for each individual animal across time (n = 9). I: GIP-085 (3, 30, 300, 3,000 nmol/kg, IP) dose-dependently suppressed BG levels following glucose administration (2 g/kg, IP). Veh vs. 3,000 nmol/kg: *P < 0.05, ***P < 0.001; Veh vs. 300 nmol/kg: #P < 0.05; 3,000 nmol/kg vs. 30 nmol/kg: $P < 0.05 (n = 10 per group). J: AUC from 0 (i.e., postglucose bolus) to 120 min (n = 10 per group). K: AUC from 0 to 60 min (n = 10 per group). L: GIP-085 (300, 3,000 nmol/kg, IP) induces anorexia in a dose-dependent fashion in shrews (n = 10 per group). M: GIP-085 treatment dose-dependently leads to body weight loss (n = 10 per group). N: No significant emesis occurred following GIP-085 (300, 3,000 nmol/kg, IP) treatment during 120 min after injection (n = 10 per group). The number of animals exhibiting emesis, expressed as a fraction of the total number of animal tested, is indicated above each treatment group. All data are expressed as mean ± SEM. Data in A, D, E, I, L, and M were analyzed with repeated-measurements two-way ANOVA, followed by the Tukey post hoc test. Data in B, C, F, J, K, and N were analyzed with repeated-measurements one-way ANOVA, followed by the Tukey post hoc test. Means with different letters are significantly different from each other (P < 0.05).
Figure 4
Figure 4
GIP-085 cotreatment retains GLP-140 metabolic and feedings effects and feeding but completely prevents GLP-140–induced emesis in shrews. A: In an IPGTT, GIP-085 (300 nmol/kg), GLP-140 (1,000 nmol/kg), and combination (combo) treatment showed similar potency in suppressing BG levels after glucose administration (2 g/kg, IP) compared with saline. Vehicle (Veh) vs. combo: *P < 0.05, ***P < 0.001; Veh vs. GIP-085: ###P < 0.001; Veh vs. GLP-140: $$$P < 0.001 (n = 15 per group). B: AUC analysis from 0 (i.e., postglucose bolus) to 120 min. All treatments similarly reduced AUCs compared with vehicle (n = 15). C: GIP-085 (300 nmol/kg), GLP-140 (1,000 nmol/kg), and combo treatment reduced food intake compared with vehicle (n = 10 per group). D: GLP-140 and combo treatments induce body weight loss in shrews (n = 10 per group). E: The profound emesis induced by GLP-140 treatment (1,000 nmol/kg) is completely blocked by GIP-085 (300 nmol/kg) cotreatment (n = 10 per group). The number of animals exhibiting emesis, expressed as a fraction of the total number of animal tested, is indicated above each treatment group. F: Heat maps showing latency, number, intensity, and frequency of emesis following treatments for each individual animal across time (n = 10 per group). G: Representative immunofluorescent images showing c-Fos+ cells in the NTS and AP (∼250-μm rostral to the obex) 3 h after GIP-085 (300 nmol/kg IP), GLP-140 (1,000 nmol/kg IP), or combo treatment. H: Quantification of c-Fos+ neurons in the medial NTS and in the AP (n = 3–7 per group). IR, immunoreactive. All are data expressed as mean ± SEM. Data in A, C, D, and H were analyzed with repeated-measurements two-way ANOVA, followed by the Tukey post hoc test. Data in B and E were analyzed with repeated-measurements one-way ANOVA, followed by the Tukey post hoc test. Data in H were analyzed with one-way ANOVA, followed by the Tukey post hoc test. Means with different letters are significantly different from each other (P < 0.05).

References

    1. Kanoski SE, Hayes MR, Skibicka KP. Glp-1 and weight loss: unraveling the diverse neural circuitry. Am J Physiol Regul Integr Comp Physiol 2016;310:R885–R895 - PMC - PubMed
    1. Baggio LL, Drucker DJ. Glucagon-like peptide-1 receptor co-agonists for treating metabolic disease. Mol Metab 2021;46:101090. - PMC - PubMed
    1. Müller TD, Finan B, Bloom SR, et al. Glucagon-like peptide 1 (GLP-1). Mol Metab 2019;30:72–130 - PMC - PubMed
    1. Sikirica MV, Martin AA, Wood R, Leith A, Piercy J, Higgins V. Reasons for discontinuation of GLP1 receptor agonists: data from a real-world cross-sectional survey of physicians and their patients with type 2 diabetes. Diabetes Metab Syndr Obes 2017;10:403–412 - PMC - PubMed
    1. Baggio LL, Drucker DJ. Biology of incretins: GLP-1 and GIP. Gastroenterology 2007;132:2131–2157 - PubMed

Publication types

Substances