. 2021 Sep 29;41(39):8181-8196.
doi: 10.1523/JNEUROSCI.0410-21.2021. Epub 2021 Aug 11.

Hypothalamic Glutamate/GABA Cotransmission Modulates Hippocampal Circuits and Supports Long-Term Potentiation

Affiliations

Hypothalamic Glutamate/GABA Cotransmission Modulates Hippocampal Circuits and Supports Long-Term Potentiation

Musa Iyiola Ajibola et al. J Neurosci. .

Abstract

Subcortical input engages in cortico-hippocampal information processing. Neurons of the hypothalamic supramammillary nucleus (SuM) innervate the dentate gyrus (DG) by coreleasing two contrasting fast neurotransmitters, glutamate and GABA, and thereby support spatial navigation and contextual memory. However, the synaptic mechanisms by which SuM neurons regulate the DG activity and synaptic plasticity are not well understood. The DG comprises excitatory granule cells (GCs) as well as inhibitory interneurons (INs). Combining optogenetic, electrophysiological, and pharmacological approaches, we demonstrate that the SuM input differentially regulates the activities of different DG neurons in mice of either sex via distinct synaptic mechanisms. Although SuM activation results in synaptic excitation and inhibition in all postsynaptic cells, the ratio of these two components is variable and cell type-dependent. Specifically, dendrite-targeting INs receive predominantly synaptic excitation, whereas soma-targeting INs and GCs receive primarily synaptic inhibition. Although SuM excitation alone is insufficient to excite GCs, it enhances the GC spiking precision and reduces the latencies in response to excitatory drives. Furthermore, SuM excitation enhances the GC spiking in response to the cortical input, thereby promoting induction of long-term potentiation at cortical-GC synapses. Collectively, these findings provide physiological significance of the cotransmission of glutamate/GABA by SuM neurons in the DG network.SIGNIFICANCE STATEMENT The cortical-hippocampal pathways transfer mnemonic information during memory acquisition and retrieval, whereas subcortical input engages in modulation of communication between the cortex and hippocampus. The supramammillary nucleus (SuM) neurons of the hypothalamus innervate the dentate gyrus (DG) by coreleasing glutamate and GABA onto granule cells (GCs) and interneurons and support memories. However, how the SuM input regulates the activity of various DG cell types and thereby contributes to synaptic plasticity remains unexplored. Combining optogenetic and electrophysiological approaches, we demonstrate that the SuM input differentially regulates DG cell dynamics and consequently enhances GC excitability as well as synaptic plasticity at cortical input-GC synapses. Our findings highlight a significant role of glutamate/GABA cotransmission in regulating the input-output dynamics of DG circuits.

Keywords: GABA; cotransmission; glutamate; hypothalamus; long-term potentiation; supramammillary nucleus.


Figures

Figure 1.
Figure 1.
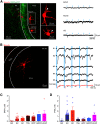
Anatomical and physiological characterization of DG-projecting SuM neurons. A, Left, Schematic showing the location of retrogradely labeled cells in the SuM after bilateral red retrobead injections into the DG. Middle, Representative images of injection sites along the AP axis of the DG. Right top, High-magnification image of injection sites in the DG. Right bottom, Retrogradely labeled DG-projecting SuM neurons in the SuM area. B, Schematic of unilateral red retrobead injection into the DG. C, Retrogradely labeled DG-projecting SuM neurons were mainly located in the right SuML ipsilateral to the injection site. D, Quantification of retrogradely labeled DG-projecting SuM neurons in the right and left SuML. Right SuML, 63 ± 4.2 cells; left SuML, 17 ± 3.5 cells; 12 slices from 3 mice; p < 0.0001, U = 2.0; Mann–Whitney test. E, IR-DIC image showing whole-cell recording from bead-positive neuron in the SuM. F, Representative firing pattern of a DG-projecting SuM neuron in response to 1 s current injection steps. G, Morphologic reconstruction of a DG-projecting SuM neuron. Black represents soma and dendrites. Red represents axons. Black dotted lines indicate boundary of the SuM area. H, Top, schematic of injection of AAV5-CaMKIIα-hChR2-eYFP into the SuM. Bottom, Representative confocal image stacks of coronal section depicting ChR2-eYFP expression in the DG and CA2. I, Left, Biocytin-filled recording from a ChR2-expressing SuM neuron. Right, Traces of light-evoked spikes recorded from the same cell in the presence of Kyn (2 mm), in current clamp at −70 mV (top) and ChR2-mediated photocurrent recorded at ∼−70 mV in voltage clamp (bottom). Blue bars represent the light pulses (5 ms, 470 nm, 5 Hz light pulse). J, Confocal image stacks of coronal section through the DG showing the projection pattern of SuM terminals in the DG. DAPI (left), ChR2-expressing SuM terminals (middle), and merged image (right). K, Confocal image stacks of SuM axon terminals expressing ChR2-eYFP, VGluT2, and VGAT immunofluorescence and the merge image showing their colocalization on the labeled SuM terminals. Right, Putative boutons in the box. ****p < 0.0001.
Figure 2.
Figure 2.
SuM input preferentially excites dendrite-targeting INs in the DG. A, Top, Experimental configuration of LFP recordings and photostimulation. A transverse section across the DG showing ChR2-eYFP-expressing SuM fibers (green) in the GCL and light-evoked LFPs recorded along the somatodendritic axis of GCs in the DG. Bottom, Schematic of local network of the DG depicting GC (gray), S-IN (orange), and D-IN (violet). B-D, Top, Representative morphologic reconstruction of a GC, S-IN, and D-IN (soma and dendrites, black; axon, red) in the DG. Middle, Sample traces of cell-attached responses (six overlaid sweeps) to 5 Hz photostimulation of the SuM input and firing pattern of a representative GC, S-IN, and D-IN. Bottom, Plot of spike probabilities of all recorded cells. E, Summary of identified D-IN subtypes recruited by the SuM input. Filled circles represent soma locations. Thick lines indicate dendrites. Hatched boxes represent axon distribution. F, Top, Morphologic reconstructions of representative TML, HIPP, MOPP, and HICAP in the DG. Bottom, Plot of spike probabilities of recorded cells in response to 5 Hz photostimulation of the SuM input. Error bars indicate mean ± SEM.
Figure 3.
Figure 3.
Differential glutamate/GABA cotransmission is target cell-specific. A, Top, Schematic of virus injection into SuM of VGluT2-Cre or WT mouse. Bottom, Schematic of local DG network, including the SuM input (green), GC, S-IN, and D-IN. B-D, Top, Confocal image stacks of transverse sections of the DG depicting selective expression of ChR2-eYFP in the GCL and a biocytin-filled GC, S-IN, and D-IN (red). Middle, Firing pattern of the GC, S-IN, and D-IN. Bottom, Sample traces showing the responses of a GC, S-IN, and D-IN to the 5 Hz photostimulation of the SuM input. Black traces represent average inward currents recorded in ACSF, in the presence of GABAA receptor blocker, SR95531 (1 μm, SR) and GABAB receptor blocker, CGP55845 (1 μm, CGP), and in the presence of SR, CGP, and 2 mm Kyn. The Kyn-sensitive component (glutamatergic, red), and SR & CGP-sensitive component (GABAergic, blue) obtained by digital subtraction from the above traces. E, Plot of synaptic latencies of EPSC1 and IPSC1 induced by the first light pulse in GCs, S-INs, and D-INs (GCs, EPSC1, 2.60 ± 0.10 ms; IPSC1, 2.56 ± 0.10 ms; n = 30; p = 0.875, U = 439.0; S-INs, EPSC1, 2.78 ± 0.20 ms; IPSC1, 3.07 ± 0.23 ms; n = 6; p = 0.571, U = 14.0; D-IN, EPSC1, 2.67 ± 0.09; IPSC1, 2.73 ± 0.10; n = 22; p = 0.663, U = 223.0; Mann–Whitney test). Circles connected by lines represent data collected from the same cell. Filled circles represent data obtained from VGluT2-Cre line. Open circles represent data from WT mice. F, Plot of excitatory and inhibitory conductances, EPSG1 and IPSG1 in GCs, S-INs, and D-INs (GCs, EPSG1, 0.30 ± 0.03; IPSG1, 0.91 ± 0.08; n = 30; p < 0.0001; U = 67.0; S-INs, EPSG1, 0.58 ± 0.08 nS; IPSG1, 2.14 ± 0.67 nS; n = 6; p < 0.05; U = 4.0; D-INs, EPSG1, 0.99 ± 0.08 nS; IPSG1, 0.48 ± 0.08 nS; n = 22; p < 0.0001; U = 63; Mann–Whitney test). G, Scatter plot of EPSG1 versus IPSG1 from GCs (gray circles), S-INs (orange circles), and D-INs (violet circles). Dashed line indicates equality diagonal. Gray, orange, and violet lines indicate the linear regression lines for GCs, S-INs, and D-INs, respectively (slope = 0.34, R2 = 0.20 for GCs; slope = 0.17, R2 = 0.68 for S-INs; and slope = 1.24, R2 = 0.68 for D-INs). Error bars indicate mean ± SEM. *p < 0.05. ****p < 0.0001.
Figure 4.
Figure 4.
SuM input forms monosynaptic connections with GCs and D-INs. A, Schematic of virus injection into the SuM of VGluT2-Cre mice. B, Representative traces of light-evoked responses recorded from a GC in ACSF, TTX (1 μm), and TTX, 4-AP (1 mm). TTX completely block the response and recovered by 4-AP. Addition of SR (1 μm) and CGP (1 μm) largely blocked the response; Kyn (2 mm) completely abolished the remaining responses. C, Synaptic latencies before and after bath application of TTX, 4-AP at the SuM-GC synapse; ACSF, 2.24 ± 0.11 ms; TTX, 4-AP, 4.01 ± 0.28 ms; n = 9; p = 0.0039, Wilcoxon sign-rank test. D, Plot of EPSG1 and IPSG1 of GCs. EPSG1, 0.53 ± 0.10 nS; IPSG1, 1.95 ± 0.51 nS; n = 9; p = 0.0012; U = 6.0; Mann–Whitney test. E, Representative traces of light-evoked responses recorded from a D-IN in ACSF, TTX (1 μm), and TTX (1 μm) & 4-AP (1 mm). TTX completely block the response and recovered by 4-AP. SR (1 μm) and CGP (1 μm) slightly block the response, and finally, Kyn (2 mm) completely abolished the remaining responses. F, Plot of synaptic latencies before and after bath application of TTX, 4-AP at the SuM-D-IN synapses; ACSF, 2.67 ± 0.21 ms; TTX & 4-AP, 3.66 ± 0.17 ms; n = 6, p = 0.0313, Wilcoxon sign-rank test. G, Plot of EPSG1 and IPSG1 of D-INs. EPSG1, 2.16 ± 0.51 nS; IPSG1, 0.95 ± 0.06 nS; n = 6; p = 0.0411; U = 5.0; Mann–Whitney test. H, Scatter plot of EPSG versus IPSG from GCs (gray circles) and D-INs (violet circles) during 5 Hz photostimulation of SuM input. Dashed line indicates equality diagonal. Gray and violet lines indicate the linear regression lines for GCs and D-INs, respectively (slope = 0.14, R2 = 0.40 for GCs; and slope = 1.40, R2 = 0.78 for D-INs). Error bars indicate mean ± SEM. I, Schematic of virus injection into the SuM of VGAT-Cre (open circle) and Gad2-Cre (closed circle) mice. J, Sample traces showing the responses of a GC to the 5 Hz photostimulation of the SuM input. Black trace represents average inward currents recorded in ACSF, in the presence of GABAA receptor blocker, SR95531 (1 μm, SR) and GABAB receptor blocker, CGP55845 (1 μm, CGP), and in the presence of SR, CGP, and 2 mm Kyn. The Kyn-sensitive component (glutamatergic, red), and SR & CGP-sensitive component (GABAergic, blue) obtained by digital subtraction from the above traces. K, Plot of synaptic latencies of EPSC1 and IPSC1 of GCs. EPSC1, 2.91 ± 0.14 nS; IPSC1, 2.86 ± 0.14 nS; n = 8; p = 0.5604; U = 26.0; Mann–Whitney test. L, Plot of conductances EPSG1 and IPSG1 of GCs. EPSG1, 0.20 ± 0.03 nS; IPSG1, 0.48 ± 0.06 nS; n = 8; p = 0.0006; U = 2.0; Mann–Whitney test. *p < 0.05. **p < 0.01. ***p < 0.001.
Figure 5.
Figure 5.
MCs receive weak synaptic input from the SuM. A, Left, Confocal image stacks of transverse sections through the DG depicting selective expression of ChR2-eYFP in VGluT2+ SuM fibers (green) in the GCL and sequentially recorded biocytin-filled MC #1, MC #2 (arrowheads, thorny excrescences), and a GC. Right, Representative traces obtained from MC #1, MC #2, and a GC in response to the photostimulation of the SuM input. B, Left, Morphology of a biocytin-filled responsive MC #3. Right, Black traces represent individual traces of responses of the MC #3 to 5 Hz photostimulation of SuM input. Red trace represents the average trace. Arrows indicate disynaptic responses. C, D, Summary of the EPSG1 and IPSG1, respectively, recorded from different cell types in the DG. Circles represent individual cells. Error bars indicate mean ± SEM.
Figure 6.
Figure 6.
Synaptic responses from simultaneously recorded GCs and D-INs. A, Schematic of virus injection into the SuM. B, Left, Simultaneous whole-cell recording from a GC and a D-IN. Middle, The firing pattern of the recorded GC and D-IN. Right, The morphologic reconstruction of GC (gray) and D-IN (violet). C, Traces of light-evoked postsynaptic responses recorded in GC and D-IN in baseline, SR & CGP, SR, GCP & Kyn, glutamatergic component (red), and GABAergic component (blue). D, Plot of the total composite current amplitude in the GCs and D-INs simultaneously recorded. GC, 43.94 ± 9.24 pA; D-IN, 89.78 ± 21.13 pA; n = 6; p = 0.0931; U = 7.0; Mann–Whitney test. Circles connected by dashed lines represent data collected from cells recorded simultaneously from the same slice. E, Plot of conductances of EPSG and IPSG at the SuM-GC and SuM-D-IN synapses. SuM-GC, EPSG1, 0.22 ± 0.05 nS; IPSG1, 0.52 ± 0.10 nS; n = 5; p < 0.05; U = 2.0; SuM-D-IN, EPSG1, 1.24 ± 0.26 nS; IPSG1, 0.40 ± 0.09 nS; n = 5; p < 0.01; U = 0.0; Mann–Whitney test. *p < 0.05. **p < 0.01.
Figure 7.
Figure 7.
SuM input shortens spike latency and enhances spike-timing precision. A, Top, Representative traces of responses of GCs to sinusoidal current steps before (left) and after (right) photostimulation of SuM input. Middle, Baseline to peak current amplitude of 100 pA sinusoidal protocol (red traces). Bottom, EPSP evoked by photostimulation of SuM input. Gray bars represent light off. Blue bars represent time of photostimulation at 5 Hz. B, Plot of spike number versus baseline to peak current in GCs. C, Top, Representative traces of responses of D-INs to sinusoidal current steps before (left) and after (right) photostimulation of SuM input. Middle, Baseline to peak current amplitude of 110 pA sinusoidal protocol (red traces). Bottom, EPSP evoked by photostimulation of SuM input. Blue bars represent time of photostimulation at 5 Hz. D, Plot of spike number versus baseline to peak current in D-INs. E, Representative traces of responses of GCs (20 overlaid sweeps) to constant suprathreshold sinusoidal current injection without (top traces) and with (bottom traces) photostimulation of SuM input. Left, Enlarged traces of action potentials induced by first stimulus without (top traces) and with photostimulation of SuM input (bottom traces). Red dotted lines and the red arrow lines indicate a shift in the mean spike latencies between onset of sinusoid current injection and the mean time point of peak in each action potential. Pink bars represent spike jitters. F, Summary plot of spike phase. n = 12; F(4,44) = 20.43; p < 0.0001; two-way ANOVA with Bonferroni post hoc test. Error bars indicate mean ± SEM. G, Summary plot of spike jitter. n = 12; F(4,44) = 22.17; p < 0.0001; two-way ANOVA with Bonferroni post hoc test. H, Representative traces of responses of D-INs (20 overlaid sweeps) to constant suprathreshold sinusoidal current injection without (top traces) and with (bottom traces) photostimulation of the SuM input. Left, Enlarged traces of action potentials induced by first stimulus without (top traces) and with photostimulation (bottom traces). Red dotted lines and the red arrow lines indicate a shift in the mean spike latencies between onset of sinusoid current injection and the mean time point of peak in each action potential. Pink bars represent spike jitters. I, Summary plot of spike phase. n = 10; F(4,36) = 115.4; p < 0.0001; two-way ANOVA with Bonferroni post hoc test. Error bars indicate mean ± SEM. J, Summary plot of spike jitter. n = 10; F(4,36) = 5.0; p = 0.0027; two-way ANOVA with Bonferroni post hoc test. *p < 0.05. **p < 0.01.
Figure 8.
Figure 8.
SuM input promotes GC responses to cortical input, thereby enhancing LTP at the PP-GC synapses. A, Experimental schematic showing a stimulation electrode (stim.) placed in the subiculum to electrically activate the PP fibers, a field-recording electrode in the GCL to monitor LFP and pSpike, and a blue light for photostimulation of the SuM axon terminals in the GCL. B, Representative traces of SuM-mediated fEPSP (black trace) after photostimulation, PP-mediated pSpike (filled area in gray) on electrical stimulation, and a pSpike (filled area in light blue) after the coactivation (Δt = 0 ms) of the SuM and PP. Red represents the arithmetic sum of fEPSP and pSpike. The traces of pSpikes were superimposed and aligned with fEPSP. C, Left bar graph, Summary plots of the pSpike areas evoked by SuM+PP coactivation (light blue) and arithmetic sum of SuM-evoked fEPSP and PP-evoked pSpike (light red). Areas were normalized to pSpike area evoked by the PP alone. SuM+PP coactivation, 1.43 ± 0.16; SuM+PP arithmetic sum, 1.17 ± 0.05; n = 6; p = 0.0313. Right bar graph, Summary plots of relative fEPSP slope, SuM+PP coactivation, 1.01 ± 0.02; SuM+PP arithmetic sum, 0.97 ± 0.01; n = 6; Wilcoxon signed-rank test. D, Top, Representative traces of pSpike responses to PP stimulation alone (black traces) and SuM+PP (blue traces) during a 5 Hz train. Bottom left, Summary of the effect of SuM activation on PP-evoked pSpikes versus stimulus number. PP, n = 6; PP + SuM, n = 6; p < 0.05; two-way ANOVA with Bonferroni post hoc test. Right, fEPSP slope before and after photostimulation of the SuM input. PP, n = 6; SuM+PP, n = 6; two-way ANOVA with Bonferroni post hoc test. E, Left, Representative traces of baseline pSpikes in response to stimulation of PP alone. Middle, LTP induction protocol consisting of four trains of 20 Hz electrical stimulation of the PP alone at 15 s intertrain interval (top) or coactivation of the PP and 20 Hz, 4 trains, 10 ms photostimulation of the SuM input (bottom). Right, Sample traces of pSpikes after LTP induction. F, Time course of the normalized pSpike area recorded from the GCL in response to 20 Hz, 4 trains stimulation of PP inputs alone (black circles), or coactivation of the PP input stimulation and 20 Hz photostimulation of the SuM input (blue circles). PP alone, 104.8 ± 8.59%; n = 6; SuM+PP, 167.6 ± 5.30%; n = 6; p = 0.0009; paired t test. G, Time course of the normalized fEPSP slope of pSpikes recorded from the GCL in response to 20 Hz, 4 train stimulation of PP inputs alone (black circles), or coactivation of PP input stimulation with 20 Hz photostimulation of the SuM input (blue circles). PP alone, 110.6 ± 2.20%; n = 6; SuM+PP, 128.5 ± 5.19%; n = 6; p = 0.0598; paired t test. Error bars indicate mean ± SEM. *p < 0.05.
Figure 9.
Figure 9.
A proposed modulatory role of SuM input in the DG network. A, Schematic of the DG network model showing the synapses between the SuM input (green) and the GC (gray), the D-IN (violet square), and S-IN (orange oval). The SuM input forms monosynaptic excitatory and inhibitory connections with the GC, D-IN, and S-IN. At SuM-GC and SuM-S-IN, E < I; while at SuM-D-IN, E > I. Activation of SuM input (green action potential) results in spike generation in D-IN (violet action potential), but only subthreshold depolarization in the GCs and S-INs. The synaptic summation in this model leads to a small subthreshold depolarization in the GCs. B, Coactivation of the SuM input (green) and PP input (red). The spike generation in the D-IN (violet action potential) is reinforced by PP stimulation. S-IN is recruited into the network by the PP input (orange action potential). The summation of the synapses results in enhanced EPSP (E)-spike (S) coupling (gray E-S coupling) in the GC. C, Coactivation of SuM and PP inputs during LTP induction; 20 Hz simultaneous activation of SuM (green spikes) and PP (red spikes). During this LTP induction protocol, spike generation in D-IN is strongly reinforced through the entire phase of the stimulation trains, whereas S-IN generates spikes only at the early phase (orange spikes); this could result in a late somatic disinhibition of GC. The synaptic summation during this induction protocol leads to net increase in spike generation in GC (gray spikes). D, Synaptic output by PP activation alone after LTP induction. Both PP-GC synapse and E-S coupling are enhanced.

References

    1. Acsády L, Katona I, Martinez-Guijarro FJ, Buzsáki G, Freund TF (2000) Unusual target selectivity of perisomatic inhibitory cells in the hilar region of the rat hippocampus. J Neurosci 20:6907–6919. 10.1523/JNEUROSCI.20-18-06907.2000 - DOI - PMC - PubMed
    1. Amaral DG, Scharfman HE, Lavenex P (2007) The dentate gyrus: fundamental neuroanatomical organization (dentate gyrus for dummies). Prog Brain Res 163:3–22. 10.1016/S0079-6123(07)63001-5 - DOI - PMC - PubMed
    1. Aranda L, Begega A, Sánchez-López J, Aguirre JA, Arias JL, Santín LJ (2008) Temporary inactivation of the supramammillary area impairs spatial working memory and spatial reference memory retrieval. Physiol Behav 94:322–330. 10.1016/j.physbeh.2008.01.024 - DOI - PubMed
    1. Armstrong C, Szabadics J, Tamás G, Soltesz I (2011) Neurogliaform cells in the molecular layer of the dentate gyrus as feed-forward γ-aminobutyric acidergic modulators of entorhinal-hippocampal interplay. J Comp Neurol 519:1476–1491. 10.1002/cne.22577 - DOI - PMC - PubMed
    1. Bacci A, Huguenard JR (2006) Enhancement of spike-timing precision by autaptic transmission in neocortical inhibitory interneurons. Neuron 49:119–130. 10.1016/j.neuron.2005.12.014 - DOI - PubMed

Publication types

LinkOut - more resources