. 2021 Aug 11;13(606):eabd1616.
doi: 10.1126/scitranslmed.abd1616.

Overcoming microenvironmental resistance to PD-1 blockade in genetically engineered lung cancer models

Affiliations

Overcoming microenvironmental resistance to PD-1 blockade in genetically engineered lung cancer models

Amaia Martinez-Usatorre et al. Sci Transl Med. .

Abstract

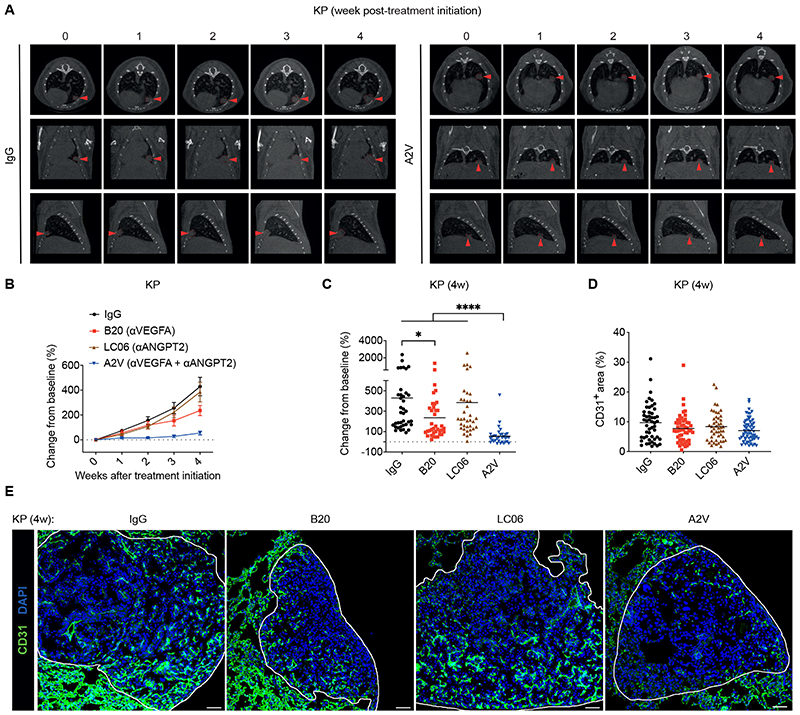
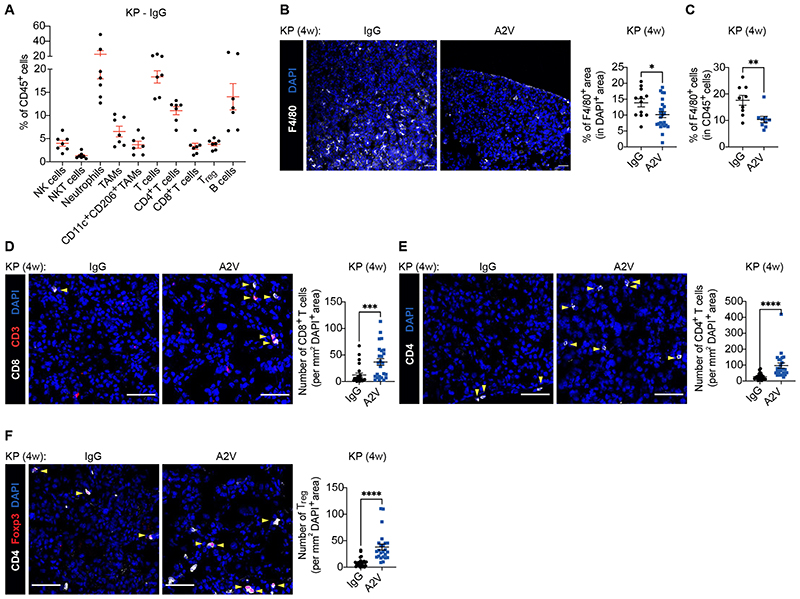
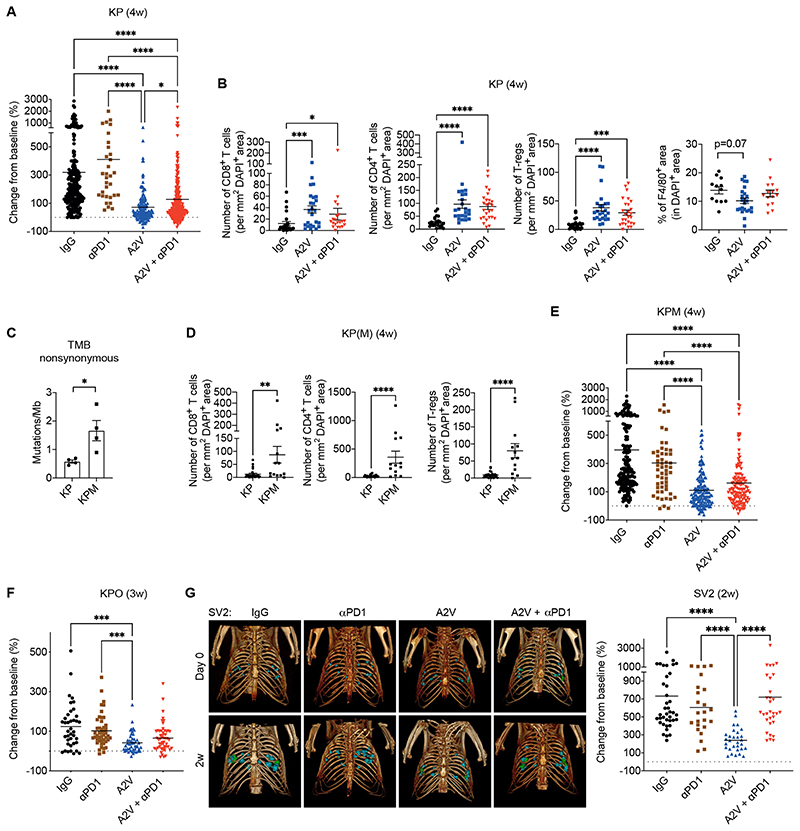
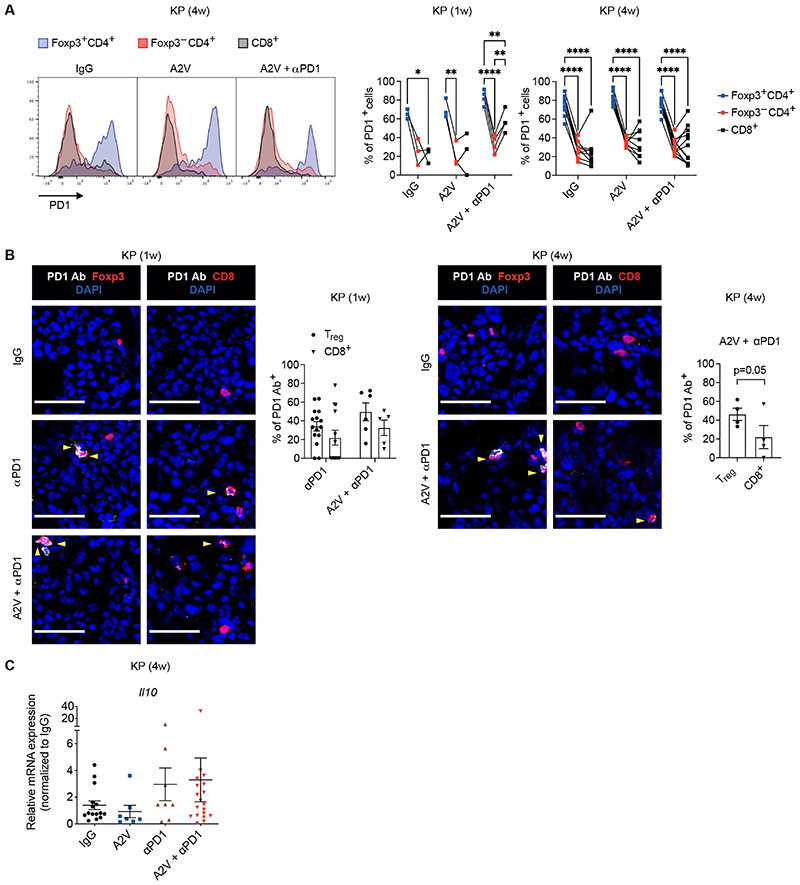
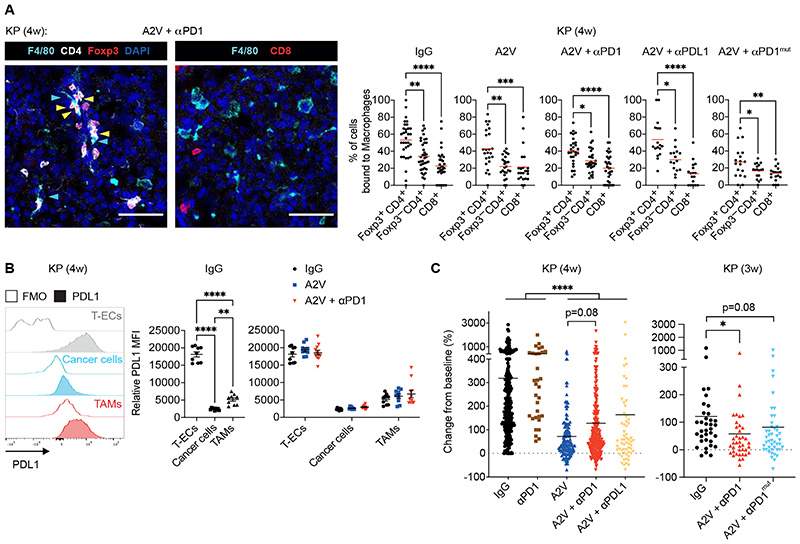
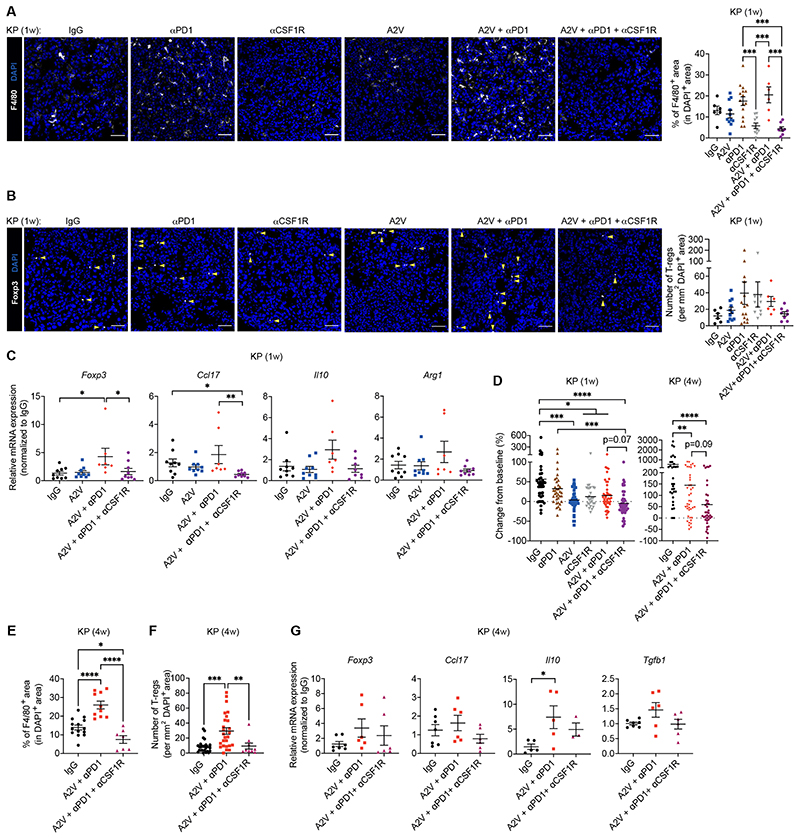
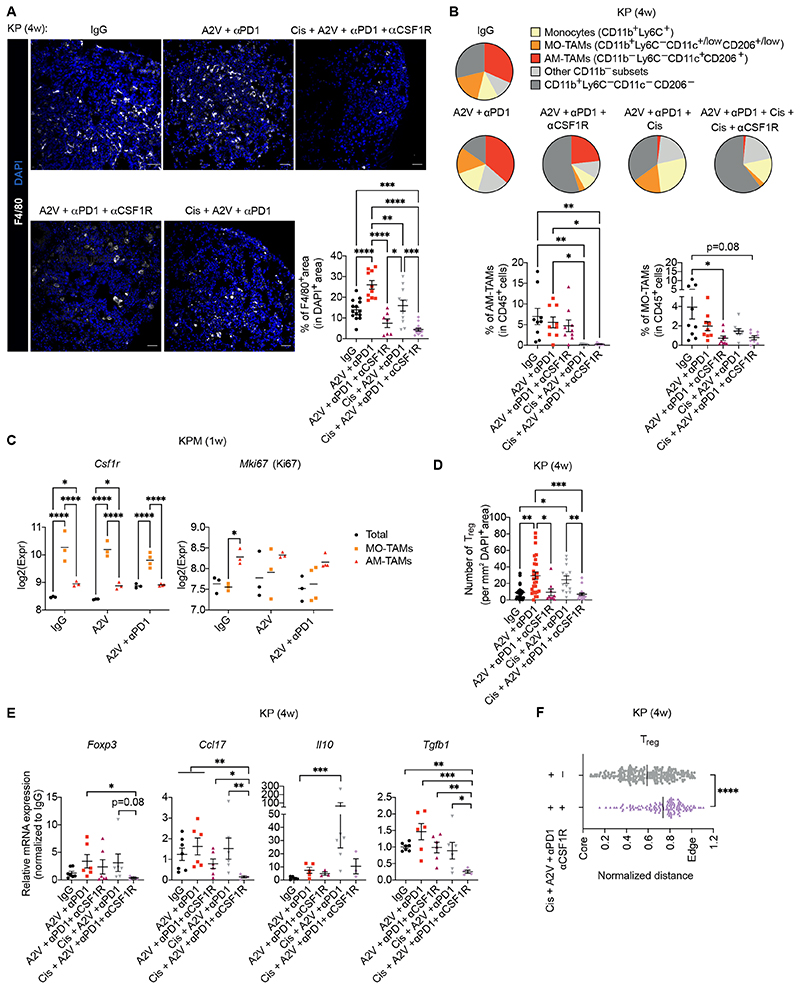
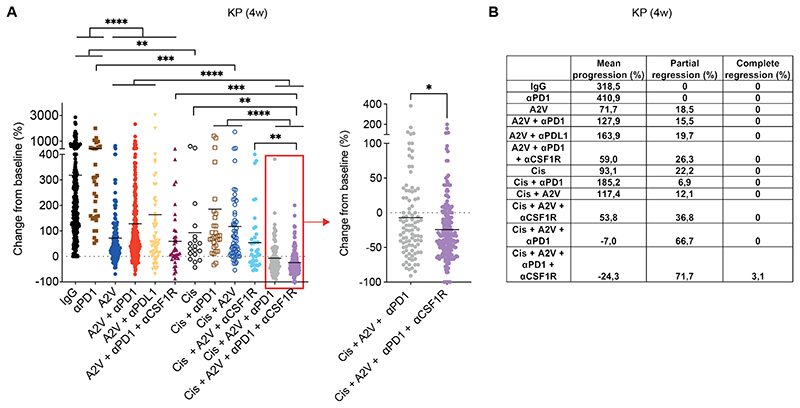
Immune checkpoint blockade (ICB) with PD-1 or PD-L1 antibodies has been approved for the treatment of non-small cell lung cancer (NSCLC). However, only a minority of patients respond, and sustained remissions are rare. Both chemotherapy and antiangiogenic drugs may improve the efficacy of ICB in mouse tumor models and patients with cancer. Here, we used genetically engineered mouse models of Kras G12D/+;p53 -/- NSCLC, including a mismatch repair-deficient variant (Kras G12D/+;p53 -/-;Msh2 -/-) with higher mutational burden, and longitudinal imaging to study tumor response and resistance to combinations of ICB, antiangiogenic therapy, and chemotherapy. Antiangiogenic blockade of vascular endothelial growth factor A and angiopoietin-2 markedly slowed progression of autochthonous lung tumors, but contrary to findings in other cancer types, addition of a PD-1 or PD-L1 antibody was not beneficial and even accelerated progression of a fraction of the tumors. We found that antiangiogenic treatment facilitated tumor infiltration by PD-1+ regulatory T cells (Tregs), which were more efficiently targeted by the PD-1 antibody than CD8+ T cells. Both tumor-associated macrophages (TAMs) of monocyte origin, which are colony-stimulating factor 1 receptor (CSF1R) dependent, and TAMs of alveolar origin, which are sensitive to cisplatin, contributed to establish a transforming growth factor-β-rich tumor microenvironment that supported PD-1+ Tregs Dual TAM targeting with a combination of a CSF1R inhibitor and cisplatin abated Tregs, redirected the PD-1 antibody to CD8+ T cells, and improved the efficacy of antiangiogenic immunotherapy, achieving regression of most tumors.


Conflict of interest statement

Competing interests: M.S. is a current Roche employee and C.H.R. is a former Roche employee. M.D.P. received sponsored research grants from EVIR Therapeutics, Hoffmann La-Roche, Deciphera Pharmaceuticals and MedImmune; reports honoraria from Merck and Sanofi/Regeneron Pharmaceuticals; and serves on the Scientific Advisory Boards of EVIR Therapeutics, Deciphera Pharmaceuticals, Montis Biosciences, Light Chain Bioscience/Novimmune, Macomics, and Genenta. The other authors report no competing interests.

Figures

Figure 1
Figure 1. Combined ANGPT2 and VEGFA blockade by A2V limits murine KP tumor growth
(A) Representative micro-CT images of lungs of representative IgG and A2V-treated KP mice, imaged over 4 weeks. Red arrowheads point to an individual tumor over time. (B-C) Progression of KP tumors treated as indicated. The data in (B) indicate the mean weekly change in mean tumor volume (± SEM) relative to the volume at the beginning of the treatment. The data in (C) indicate the change in tumor volume from week 0 to 4 after treatment initiation; dots represent individual tumors, whereas bars indicate mean values. Statistical analysis in (C) by Kruskal-Wallis test followed by Dunn’s multiple comparison test. (D) Percentage of CD31+ vascular area in the total tumor area of mice treated as indicated. Dots represent individual tumors, whereas bars indicate mean values. Statistical analysis by Kruskal-Wallis test followed by Dunn’s multiple comparison test; no significant differences. (E) Representative images of CD31 immunostaining (green), indicating blood vessels, and DAPI nuclear staining (blue) of representative KP tumors treated as indicated, quantified in (D). Scale bar, 50 μm. P values are coded as *: P < 0.05; **: P < 0.01; ***: P < 0.001; and ****: P < 0.0001. Exact P values and the number of mice, tumors or samples analyzed, are reported in table S1. Numerical values are reported in table S2.
Figure 2
Figure 2. A2V modulates the immune cell composition of murine KP tumors
(A) Percentage of the indicated immune cell types in the CD45+ hematopoietic cell compartment of KP tumors treated as indicated and analyzed by flow cytometry. Dots represent individual tumors, whereas red bars indicate mean values ± SEM. (B) Left: representative images of F4/80 (white) immunostaining and DAPI nuclear staining (blue) of KP tumors treated as indicated. Scale bar, 50 μm. Right: quantification of the data. Dots represent individual tumors, whereas bars indicate mean values ± SEM. Statistical analysis by unpaired t-test. (C) Percentage of Ly6GLy6CF4/80+ TAMs in CD45+ cells of KP tumors treated as indicated and analyzed by flow cytometry. Dots represent individual tumors, whereas bars indicate mean values ± SEM. Statistical analysis by Mann Whitney test. (D) Left: representative images of CD8 (white) and CD3 (red) immunostaining, and DAPI nuclear staining (blue), of KP tumors treated as indicated. Yellow arrowheads indicate CD8+ T cells. Scale bar, 50 μm. Right: quantification of the data. Dots represent individual tumors, whereas bars indicate mean values ± SEM. Statistical analysis by Mann Whitney test. (E) Left: representative images of CD4 (white) immunostaining and DAPI nuclear staining (blue) of KP tumors treated as indicated. Yellow arrowheads indicate CD4+ T cells. Scale bar, 50 μm. Right: quantification of the data. Dots represent individual tumors, whereas bars indicate mean values ± SEM. Statistical analysis by Mann Whitney test. (F) Left: representative images of CD4 (white) and Foxp3 (red) immunostaining, and DAPI nuclear staining (blue), of KP tumors treated as indicated. Yellow arrowheads indicate Foxp3+ Tregs. Scale bar, 50 μm. Right: quantification of the data. Dots represent individual tumors, whereas bars indicate mean values ± SEM. Statistical analysis by Mann Whitney test. P values are coded as *: P < 0.05; **: P < 0.01; ***: P < 0.001; and ****: P < 0.0001. Exact P values and the number of mice, tumors or samples analyzed, are reported in table S1. Numerical values are reported in table S2.
Figure 3
Figure 3. PD-1 blockade does not improve murine KP tumor response to A2V
(A) Progression of KP tumors in mice treated as indicated. The data indicate the change in tumor volume from week 0 to 4 after treatment initiation; data show 7 independent experiments combined. Dots represent individual tumors, whereas bars indicate mean values. Statistical analysis by Kruskal-Wallis test followed by Dunn’s multiple comparison test. (B) Number of CD8+, CD4+ or CD4+Foxp3+ Treg cells per mm2 of DAPI+ tumor area, quantified by immunostaining. Dots represent individual tumors, whereas bars indicate mean values ± SEM. Statistical analysis by Kruskal-Wallis test followed by Dunn’s multiple comparison test. Rightmost panel: Percentage of F4/80+ area in DAPI+ KP tumor area quantified by immunostaining. Dots represent individual tumors, whereas bars indicate mean values ± SEM. Statistical analysis by one-way ANOVA followed by Tukey’s multiple comparison test. (C) Number of nonsynonymous mutations (SNV and INDELS) per megabase of DNA in untreated KP and KPM tumors. Dots represent individual tumors, whereas bars indicate mean values ± SEM. Statistical analysis by unpaired t-test. (D) Number of CD8+, CD4+ and CD4+ Foxp3+ (Tregs) cells per mm2 of DAPI+ tumor area quantified by immunostaining. Dots represent individual tumors, whereas bars indicate mean values ± SEM. Statistical analysis by Mann Whitney test. (E-F) Progression of KPM and KPO tumors in mice treated as indicated. The data indicate the change in tumor volume from week 0 to 4 (KPM) or 0 to 3 (KPO) after treatment initiation. Dots represent individual tumors, whereas bars indicate mean values. Statistical analysis by Kruskal-Wallis test followed by Dunn’s multiple comparison test. (G) Left: 3D rendering of SV2 tumors imaged at 0 and 2 weeks in representative mice treated as indicated. Right: Progression of orthotopic SV2 tumors treated as indicated. The data indicate the change in tumor volume from week 0 to 2 after treatment initiation. Statistical analysis by Kruskal-Wallis test followed by Dunn’s multiple comparison test. P values are coded as *: P < 0.05; **: P < 0.01; ***: P < 0.001; and ****: P < 0.0001. Exact P values and the number of mice, tumors or samples analyzed, are reported in table S1. Numerical values are reported in table S2.
Figure 4
Figure 4. The PD-1 antibody targets PD-1+ Tregs in murine KP tumors
(A) Representative flow cytometry histogram plots (left) and quantification (right) of PD-1+ cells within Foxp3+CD4+ Tregs, Foxp3CD4+ T cells and CD8+ T cells of KP tumors treated as indicated, analyzed 1 or 4-weeks after treatment initiation. Dots indicate individual tumors. Statistical analysis by two-way RM ANOVA followed by Tukey’s multiple comparison test. (B) Left panels: representative images of PD-1 antibody (Ab; white) and Foxp3 (red) or CD8 (red) immunostaining, and DAPI nuclear staining (blue), of KP tumors treated as indicated, analyzed 1 or 4 weeks after treatment initiation. Yellow arrowheads indicate cells decorated with the PD-1 Ab. Scale bar, 50 μm. Right panels: quantification of the data. Dots represent individual tumors, whereas bars indicate mean values ± SEM. Statistical analysis by twoway ANOVA followed by Sidak’s multiple comparison test (KP, 1 week) or paired t-test (KP, 4 weeks). (C) qPCR analysis of Il10 in KP tumors treated as indicated, normalized to the expression in IgG-treated mice. Gapdh, Hprt and B2m were used as housekeeping genes. Dots represent individual tumors, whereas bars indicate mean values ± SEM. Statistical analysis on non-normalized ΔCt values by one-way ANOVA followed by Tukey’s multiple comparison test. P values are coded as *: P < 0.05; **: P < 0.01; ***: P < 0.001; and ****: P < 0.0001. Exact P values and the number of mice, tumors or samples analyzed, are reported in table S1. Numerical values are reported in table S2.
Figure 5
Figure 5. TAMs interact with Tregs in murine KP tumors
(A) Left: representative images of CD4 (white), Foxp3 (red), CD8 (red), or F4/80 (cyan) immunostaining, and DAPI nuclear staining (blue), of KP tumors treated as indicated. Yellow and cyan arrowheads indicate Tregs and macrophages, respectively. Scale bar, 50 μm. Right: percentage of cells in contact with F4/80+ macrophages among total CD4+Foxp3+ Tregs, CD4+Foxp3 T cells and CD8+ T cells in KP tumors treated as indicated, analyzed at week 4 after treatment initiation. Dots indicate individual tumors, whereas red bars represent mean values. Statistical analysis by Kruskal-Wallis test followed by Dunn’s multiple comparison test, except for A2V + αPD1mut treated mice (one-way ANOVA followed by Tukey’s multiple comparison test). (B) Representative flow cytometry histogram plots (left panel) and quantification (middle and right panels) of PD-L1 mean fluorescence intensity (MFI) in CD31+CD45 tumor endothelial cells (T-ECs), EpCam+CD45 tumor epithelial cells, and CD45+Ly6GLy6CF4/80+ TAMs, normalized to the MFI of the corresponding fluorescence minus one (FMO) control sample, in KP tumors treated as indicated. Dots represent individual tumors, whereas bars indicate mean values ± SEM. Statistical analysis by one-way ANOVA followed by Tukey’s multiple comparison test (middle panel) and two-way ANOVA followed by Tukey’s multiple comparison test (right panel). (C) Progression of KP tumors in mice treated as indicated. The data indicate the change in tumor volume from week 0 to 4 (left) or 0 to 3 (right) after treatment initiation. Dots represent individual tumors, whereas bars indicate mean values. Statistical analysis by Kruskal-Wallis test followed by Dunn’s multiple comparison test. P values are coded as *: P < 0.05; **: P < 0.01; ***: P < 0.001; and ****: P < 0.0001. Exact P values and the number of mice, tumors or samples analyzed, are reported in table S1. Numerical values are reported in table S2.
Figure 6
Figure 6. CSF1R-dependent macrophages sustain Tregs in murine KP tumors
(A-B) Left: Representative images of F4/80 (white) or Foxp3 (white) immunostaining, and DAPI nuclear staining (blue), of KP tumors treated as indicated. Yellow arrowheads indicate Foxp3+ Tregs. Scale bar, 50 μm. Right: quantification of the data. Dots represent individual tumors, whereas bars indicate mean values ± SEM. Statistical analysis by one-way ANOVA followed by Tukey’s multiple comparison test (A) or Kruskal-Wallis test followed by Dunn’s multiple comparison test (B). (C) qPCR analysis of Foxp3, Ccl17, Il10 and Arg1 mRNA expression in KP tumors treated as indicated, normalized to the expression in IgG-treated mice. Gapdh and Hprt were used as housekeeping genes. Dots represent individual tumors, whereas bars indicate mean values ± SEM. Statistical analysis on non-normalized ΔCt values by one-way ANOVA followed by Tukey’s multiple comparison test (Foxp3, Il10, Arg1) or Kruskal-Wallis test followed by Dunn’s multiple comparison test (Ccl17). (D) Progression of KP tumors in mice treated as indicated. The data indicate the change in tumor volume from week 0 to 1 (left) and 0 to 4 (right) after treatment initiation. Dots represent individual tumors, whereas bars indicate mean values. Statistical analysis by Kruskal-Wallis test followed by Dunn’s multiple comparison test. (E) Percentage of F4/80+ area in DAPI+ tumor area quantified by immunostaining. Dots represent individual tumors, whereas bars indicate mean values ± SEM. Statistical analysis by one-way ANOVA followed by Tukey’s multiple comparison test. (F) Number of CD4+Foxp3+ Tregs per mm2 of DAPI+ tumor area quantified by immunostaining. Dots represent individual tumors, whereas bars indicate mean values ± SEM. Statistical analysis by Kruskal-Wallis test followed by Dunn’s multiple comparison test. (G) qPCR analysis of Foxp3, Ccl17, Il10 and Tgfb1 mRNA expression in KP tumors treated as indicated, normalized to the expression in IgG-treated mice. Gapdh and Hprt were used as housekeeping genes. Dots represent individual tumors, whereas bars indicate mean values ± SEM. Statistical analysis on non-normalized ΔCt values by one-way ANOVA followed by Tukey’s multiple comparison test. P values are coded as *: P < 0.05; **: P < 0.01; ***: P < 0.001; and ****: P < 0.0001. Exact P values and the number of mice, tumors or samples analyzed, are reported in table S1. Numerical values are reported in table S2.
Figure 7
Figure 7. CSF1R inhibition and cisplatin target distinct macrophage populations in murine KP tumors
(A) Left: representative images of F4/80 (white) immunostaining and DAPI nuclear staining (blue) of KP tumors treated as indicated. Scale bar, 50 μm. Bottom right: quantification of the data. Dots represent individual tumors, whereas bars indicate mean values ± SEM. Statistical analysis by one-way ANOVA followed by Tukey’s multiple comparison test. (B) Left: pie chart representation of the mean frequency of macrophage/monocyte subsets in total Ly6GF4/80+ cells. Right: frequencies of MO-TAMs and AM-TAMs within CD45+ cells in KP tumors 4 weeks after treatment initiation. Dots represent individual tumors, whereas bars indicate mean values ± SEM. Statistical analysis by one-way ANOVA followed by Tukey’s multiple comparison test (AM-TAMs) or Kruskal-Wallis test followed by Dunn’s multiple comparison test (MO-TAMs). (C) Expression of Csf1r and Mki67 mRNA by RNAseq in enriched MO-TAMs (Ly6GLy6CF4/80+CD11b+CD11c+/lowCD206+/low), AM-TAMs (Ly6GLy6CF4/80+CD11b- CD11c+CD206+) and live tumor-derived cells (Total) from KPM tumors, analyzed 1 week after treatment initiation. Dots represent individual mice, whereas bars indicate mean values; several tumors were pooled from each mouse. Statistical analysis by two-way ANOVA followed by Tukey’s multiple comparison test. (D) Number of CD4+Foxp3+ Tregs per mm2 of DAPI+ KP tumor area quantified by immunostaining. Dots represent individual tumors, whereas bars indicate mean values ± SEM. Statistical analysis by Kruskal-Wallis test followed by Dunn’s multiple comparison test. (E) qPCR analysis of Foxp3, Ccl17, Il10 and Tgfb1 mRNA expression in KP tumors treated as indicated, normalized to the expression in IgG-treated mice. Gapdh and Hprt were used as housekeeping genes. Dots represent individual tumors, whereas bars indicate mean values ± SEM. Statistical analysis on non-normalized ΔCt values by one-way ANOVA followed by Tukey’s multiple comparison test. (F) Distance of individual Tregs from the tumor center (core) normalized to the tumor area. A normalized distance equal to 1 is the mean distance between the core and edge of the tumor. Dots represent individual cells, whereas bars indicate mean values. Statistical analysis by Mann Whitney test. P values are coded as *: P < 0.05; **: P < 0.01; ***: P < 0.001; and ****: P < 0.0001. Exact P values and the number of mice, tumors or samples analyzed, are reported in table S1. Numerical values are reported in table S2.
Figure 8
Figure 8. Combinatorial targeting of MO-TAMs and AM-TAMs improves the efficacy of anti-angiogenic immunotherapy in murine KP tumors
(A) Progression of KP tumors in mice treated as indicated. The data indicate the change in tumor volume from week 0 to 4 after treatment initiation; data show 10 independent experiments combined. Dots represent individual tumors, whereas bars indicate mean values. Statistical analysis by Kruskal-Wallis test followed by Dunn’s multiple comparison test (left panel) and Mann Whitney test (right panel). (B) Progression and regression rates of KP tumors in mice from the data shown in (A). P values are coded as *: P < 0.05; **: P < 0.01; ***: P < 0.001; and ****: P < 0.0001. Exact P values and the number of mice, tumors or samples analyzed, are reported in table S1. Numerical values are reported in table S2.

References

    1. Herbst RS, Morgensztern D, Boshoff C. The biology and management of non-small cell lung cancer. Nature. 2018;553:446–454. - PubMed
    1. Baggstrom MQ, Stinchcombe TE, Fried DB, Poole C, Hensing TA, Socinski MA. Third-Generation Chemotherapy Agents in the Treatment of Advanced Non-small Cell Lung Cancer: A Meta-Analysis. J Thorac Oncol. 2007;2:845–853. - PubMed
    1. Soria J-C, Wu Y-L, Nakagawa K, Kim S-W, Yang J-J, Ahn M-J, Wang J, Yang JC-H, Lu Y, Atagi S, Ponce S, et al. Gefitinib plus chemotherapy versus placebo plus chemotherapy in EGFR-mutation-positive non-small-cell lung cancer after progression on first-line gefitinib (IMPRESS): a phase 3 randomised trial. Lancet Oncol. 2015;16:990–998. - PubMed
    1. Soria J-C, Marabelle A, Brahmer JR, Gettinger S. Immune Checkpoint Modulation for Non–Small Cell Lung Cancer. Clin Cancer Res. 2015;21:2256–2262. - PubMed
    1. Spira A, Ettinger DS. Multidisciplinary management of lung cancer. N Engl J Med. 2004;350:379–392. - PubMed

Publication types

Substances