

Zoogeographical barriers causing discontinuous osteometrical variations in the northern treeshrew skulls
- PMID: 34380913
- PMCID: PMC8569870
- DOI: 10.1292/jvms.21-0322
Zoogeographical barriers causing discontinuous osteometrical variations in the northern treeshrew skulls
Abstract
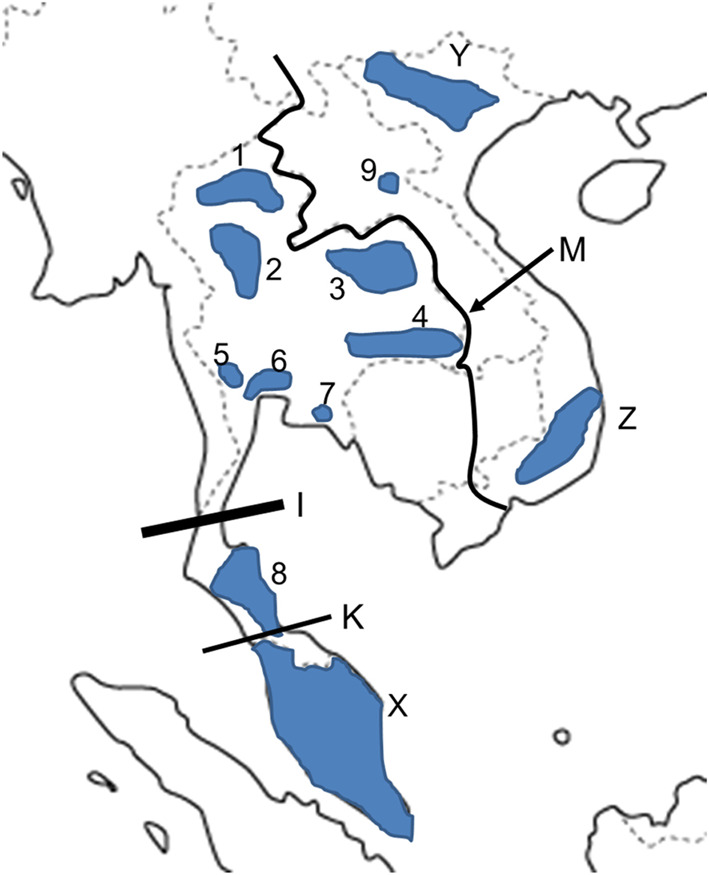
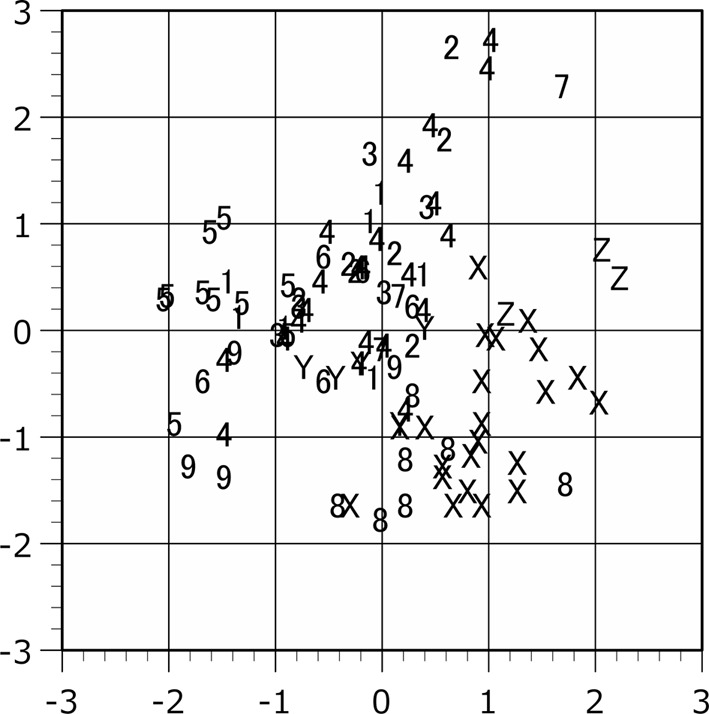
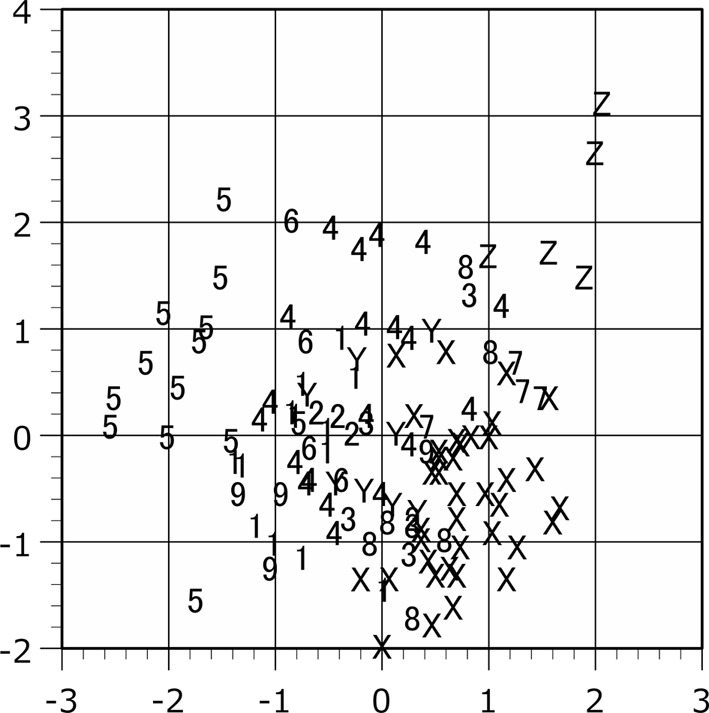
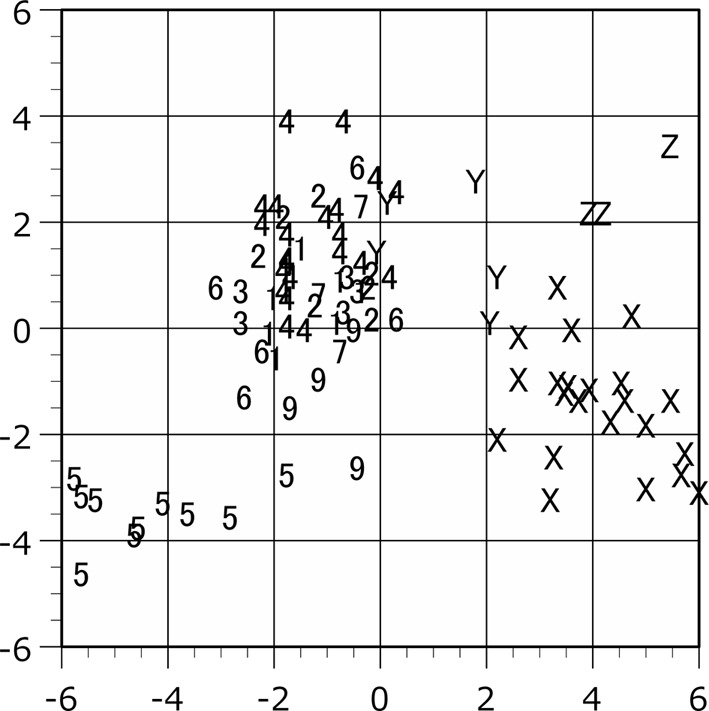
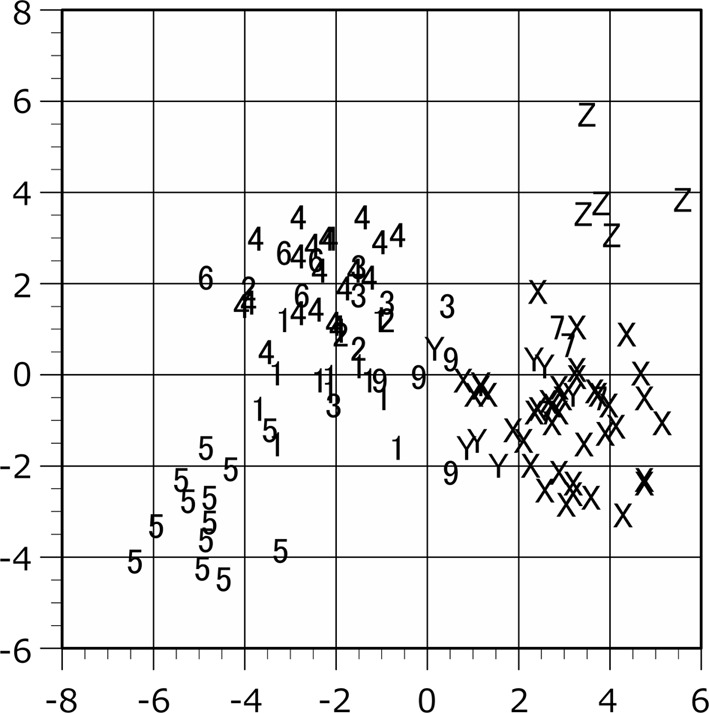
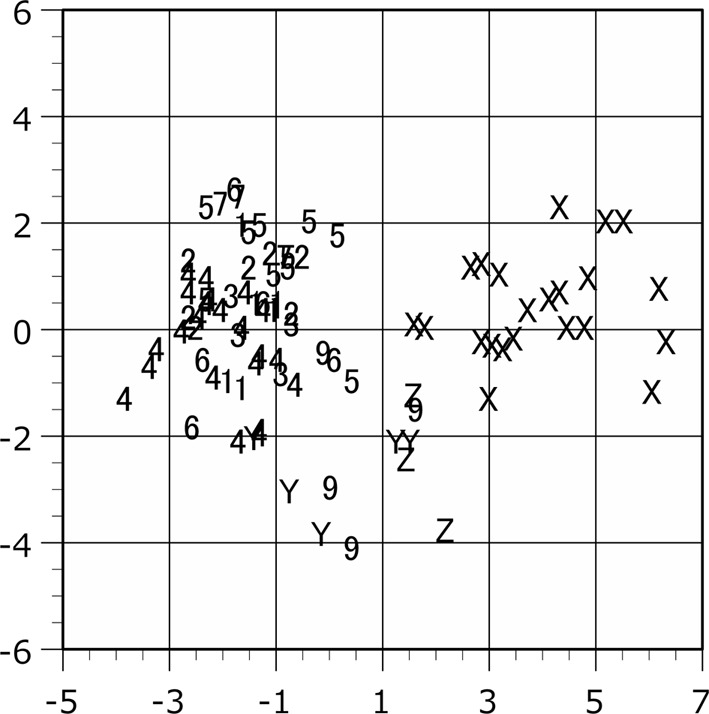
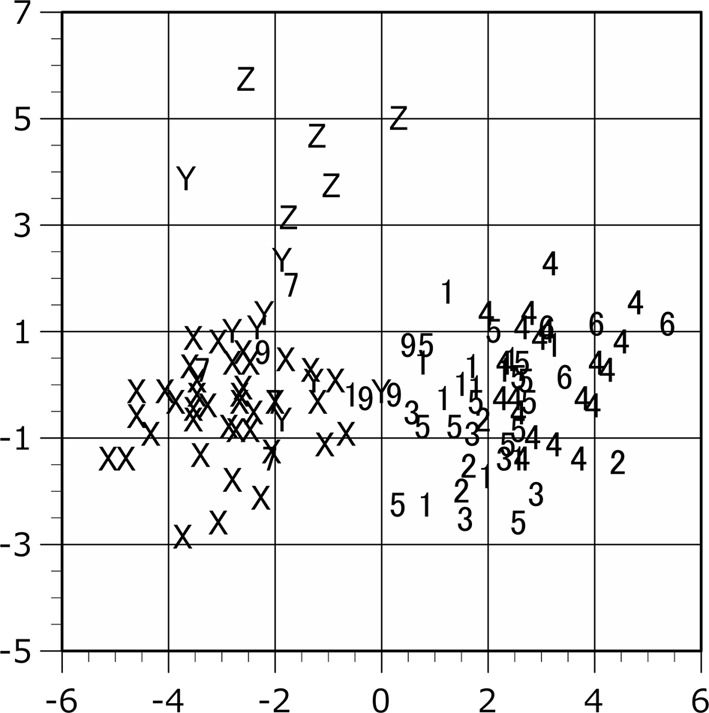
Morphological variation of the skull was examined in the northern treeshrew (Tupaia belangeri) from various localities across Southeast Asia. Through a multivariate analysis, the treeshrews from South Vietnam exhibited distinct morphological characteristics compared to other populations from Thailand and Laos, and Malaysia. The plots of the specimens of North Vietnam are not randomly mixed with Thailand plots segregation in the scatteregrams of canonical discriminant analysis. Since the skulls of the population from North Vietnam were morphologically similar to those form central Laos and northern and northeastern Thailand, the zoogeographical barrier effect of Mekong River was not clearly confirmed. The population of the Kanchanaburi in western Thailand is clearly smaller in size compared to the other populations. The southern border of the distribution of this species is determined by the Isthmus of Kra or Kangar-Pattani Line. In the northern treeshrew, which is distributed from southern China to Bangladesh and southern Thailand, we have detected osteometrical geographical variation driven by geography. These results indicate that the skull morphology in the Tupaia glis-belangeri complex distinctively differs in South Vietnam, western Thailand, and southern Thailand. The zoogeographical barrier and factor separating these districts are expected to clarify in the future.
Keywords: Isthmus of Kra; Mekong River; geographical variation; northern treeshrew; skull.
Conflict of interest statement
The authors have nothing to disclose.
Figures
References
-
- Averyanov L. V., Loc P. K., Hiep N. T., Harder D. K.2003. Phytogeographic review of Vietnam and adjacent areas of eastern Indochina. Komarovia 3: 1–83.
-
- Bain R. H., Hurley M. M.2011. A biogeographic synthesis of the amphibians and reptiles of Indochina. Bull. Am. Mus. Nat. Hist. 360: 1–138. doi: 10.1206/360.1 - DOI
-
- Baltzer J. L., Davies S. J., Noor N. S. M., Kassim A. R., Lafrankie J. V.2007. Geographical distributions in tropical trees: can geographical range predict performance and habitat association in co-occurring tree species? J. Biogeogr. 34: 1916–1926. doi: 10.1111/j.1365-2699.2007.01739.x - DOI
-
- Boontop Y., Kumaran N., Schutze M. K., Clarke A. R., Cameron S. L., Krosch M. N.2017. Population structure in Zeugodacus cucurbitae (Diptera: Tephritidae) across Thailand and the Thai–Malay peninsula: natural barriers to a great disperser. Biol. J. Linn. Soc. Lond. 121: 540–555. doi: 10.1093/biolinnean/blx009 - DOI