. 2022 Jan 1;32(1):1-9.
doi: 10.1097/FPC.0000000000000445.

Genetic association of primary nonresponse to anti-TNFα therapy in patients with inflammatory bowel disease

Affiliations

Genetic association of primary nonresponse to anti-TNFα therapy in patients with inflammatory bowel disease

Tanima De et al. Pharmacogenet Genomics. .

Abstract

Objectives: Primary nonresponse (PNR) to antitumor necrosis factor-α (TNFα) biologics is a serious concern in patients with inflammatory bowel disease (IBD). We aimed to identify the genetic variants associated with PNR.

Patients and methods: Patients were recruited from outpatient GI clinics and PNR was determined using both clinical and endoscopic findings. A case-control genome-wide association study was performed in 589 IBD patients and associations were replicated in an independent cohort of 293 patients. Effect of the associated variant on gene expression and TNFα secretion was assessed by cell-based assays. Pleiotropic effects were investigated by Phenome-wide association study (PheWAS).

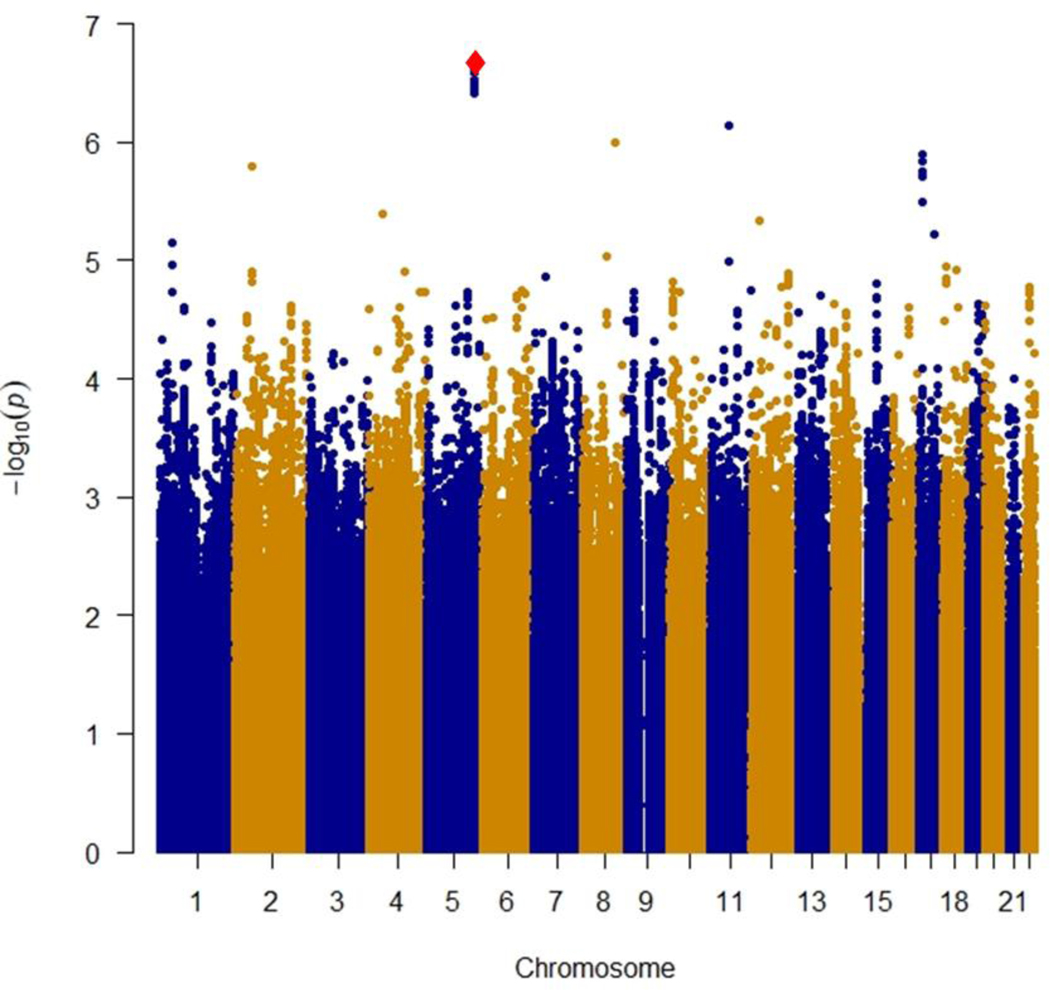
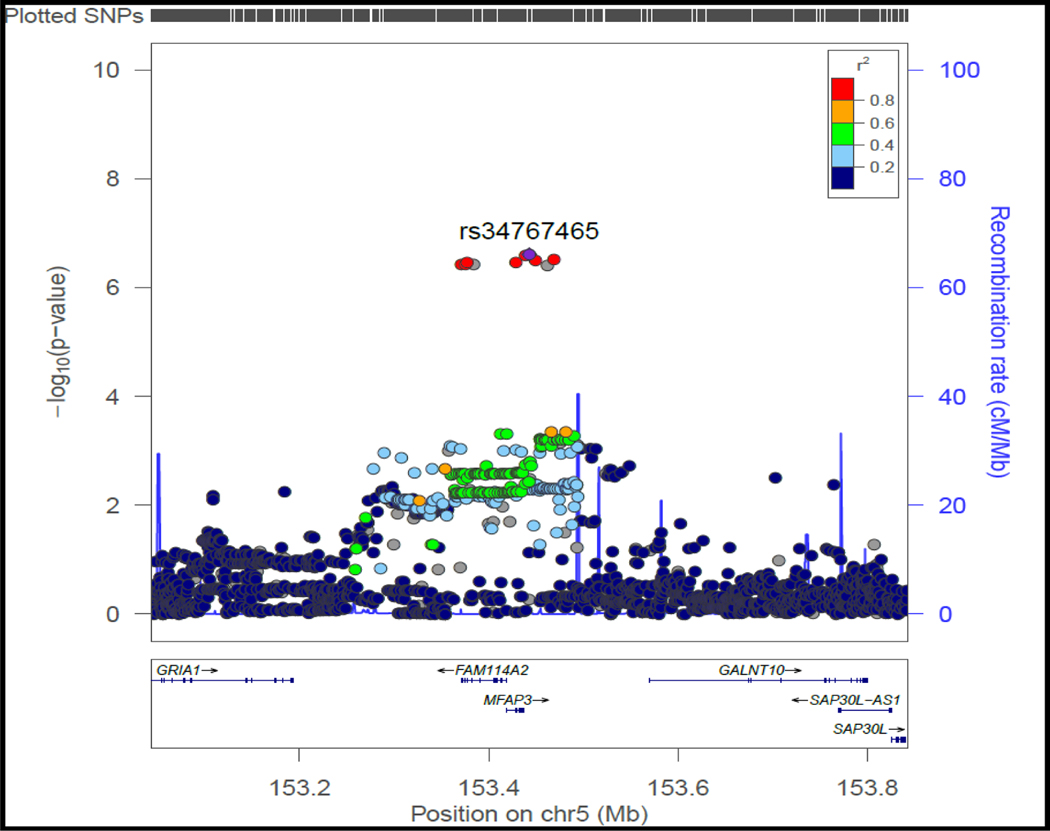
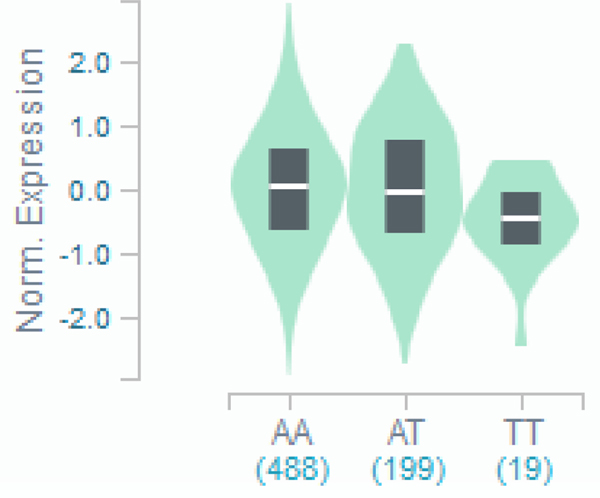
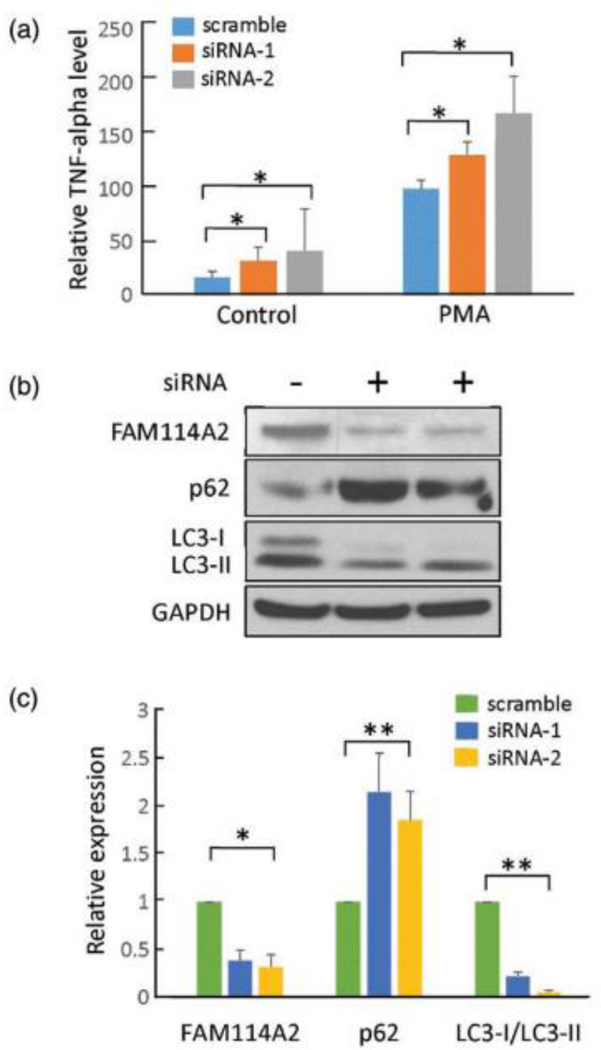
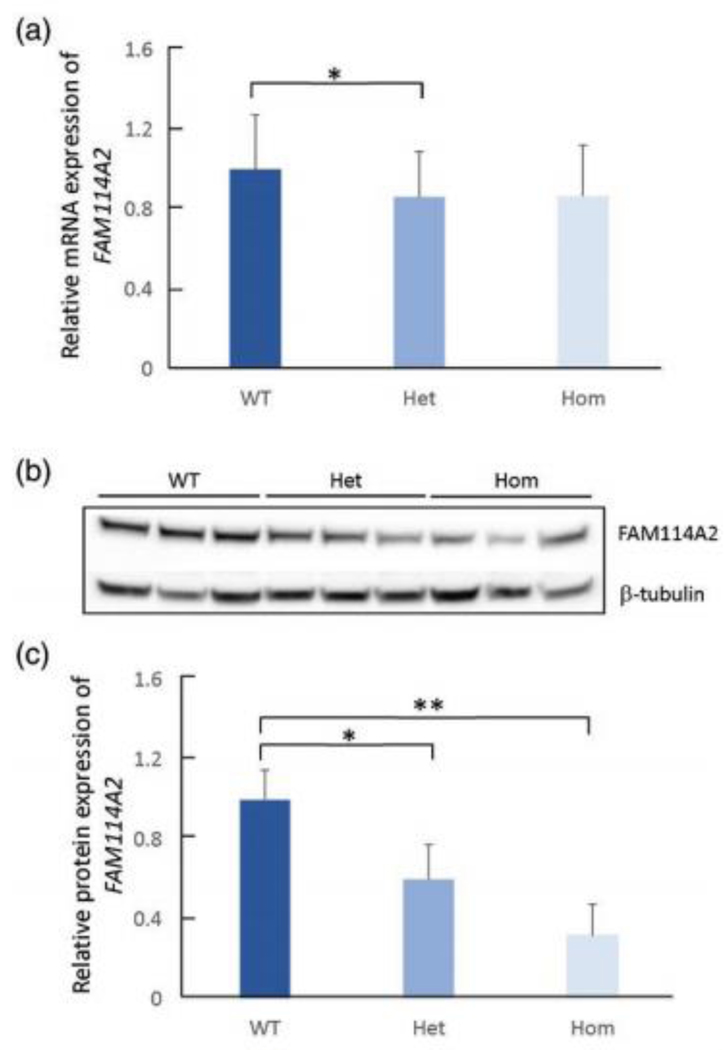
Results: We identified rs34767465 as associated with PNR to anti-TNFα therapy (odds ratio: 2.07, 95% CI, 1.46-2.94, P = 2.43 × 10⁻⁷, [replication odds ratio: 1.8, 95% CI, 1.04-3.16, P = 0.03]). rs34767465 is a multiple-tissue expression quantitative trait loci for FAM114A2. Using RNA-sequencing and protein quantification from HapMap lymphoblastoid cell lines (LCLs), we found a significant decrease in FAM114A2 mRNA and protein expression in both heterozygous and homozygous genotypes when compared to wild type LCLs. TNFα secretion was significantly higher in THP-1 cells [differentiated into macrophages] with FAM114A2 knockdown versus controls. Immunoblotting experiments showed that depletion of FAM114A2 impaired autophagy-related pathway genes suggesting autophagy-mediated TNFα secretion as a potential mechanism. PheWAS showed rs34767465 was associated with comorbid conditions found in IBD patients (derangement of joints [P = 3.7 × 10⁻⁴], pigmentary iris degeneration [P = 5.9 × 10⁻⁴], diverticulum of esophagus [P = 7 × 10⁻⁴]).

Conclusions: We identified a variant rs34767465 associated with PNR to anti-TNFα biologics, which increases TNFα secretion through mechanism related to autophagy. rs34767465 may also explain the comorbidities associated with IBD.


Conflict of interest statement

Conflict of Interest: None declared

Figures

Figure 1
Figure 1
A): Manhattan plot of near-significant loci associated with primary non-response to anti-TNFα biologics in the discovery cohort Single-nucleotide polymorphisms (SNPs) are plotted on the x-axis according to their positions on each chromosome against association with primary non-response to anti-TNFα biologics on the y-axis (−log10P value). Near-significant associations were observed in chromosome 5 [Genome-wide significant threshold: P = 5.0 × 10⁻⁸]. The diamond identifies our most significant SNP association (rs34767465). B): Locus-specific plot of rs34767465 on chromosome 5 The x-axis represents the genomic position in chromosome 5 and the left y-axis represents the –log10P of association with primary non-response to anti TNF∝ biologics in the discovery cohort. The colors of the circles denote linkage disequilibrium (r2) between rs34767465 and nearby SNPs (based on pairwise r2 values from the 1000 Genomes Project European population). The right y-axis show the estimated recombination rate (obtained from HapMap). Genes at this locus are indicated in the lower panel of the plot. Chromosomal positions are based on hg19 genome build. C): Violin plot of FAM114A2 expression for cis eQTL rs34767465 in Genotype-Tissue Expression (GTEx, release v7) The allelic effect of rs34767465 on normalized FAM114A2 gene expression levels are shown by boxplots within violin plots. [Normalized effect size = −0.15, p = 0.0000027]. A and T alleles indicate the major and minor allele types, respectively with the number of subjects shown under each genotype. The plots indicate the density distribution of the samples in each genotype. The white line in the box plot (black) shows the median value of the gene expression at each genotype.
Figure 1
Figure 1
A): Manhattan plot of near-significant loci associated with primary non-response to anti-TNFα biologics in the discovery cohort Single-nucleotide polymorphisms (SNPs) are plotted on the x-axis according to their positions on each chromosome against association with primary non-response to anti-TNFα biologics on the y-axis (−log10P value). Near-significant associations were observed in chromosome 5 [Genome-wide significant threshold: P = 5.0 × 10⁻⁸]. The diamond identifies our most significant SNP association (rs34767465). B): Locus-specific plot of rs34767465 on chromosome 5 The x-axis represents the genomic position in chromosome 5 and the left y-axis represents the –log10P of association with primary non-response to anti TNF∝ biologics in the discovery cohort. The colors of the circles denote linkage disequilibrium (r2) between rs34767465 and nearby SNPs (based on pairwise r2 values from the 1000 Genomes Project European population). The right y-axis show the estimated recombination rate (obtained from HapMap). Genes at this locus are indicated in the lower panel of the plot. Chromosomal positions are based on hg19 genome build. C): Violin plot of FAM114A2 expression for cis eQTL rs34767465 in Genotype-Tissue Expression (GTEx, release v7) The allelic effect of rs34767465 on normalized FAM114A2 gene expression levels are shown by boxplots within violin plots. [Normalized effect size = −0.15, p = 0.0000027]. A and T alleles indicate the major and minor allele types, respectively with the number of subjects shown under each genotype. The plots indicate the density distribution of the samples in each genotype. The white line in the box plot (black) shows the median value of the gene expression at each genotype.
Figure 2:
Figure 2:. The effect of rs34767465 on FAM114A2 gene and protein expression in LCLs
A) Relative gene expression of FAM114A2 by rs34767465 genotypes in LCLs (number of subjects per genotype group - WT = 62, Het = 24, Hom = 3). B) Immunoblot gel image showing decreased FAM114A2 protein expression by rs34767465 genotypes. Three different LCL lines with known genotypes were used. C) Quantitative analysis of immunoblotting results using Image J. Protein values are normalized by β-tubulin expression and are shown relative to WT expression. Wild type-WT, Heterozygous-Het, Homozygous-Hom, LCL-Lymphoblastoid Cell lines. * p<0.05 ** p<0.01.
Fig. 3
Fig. 3. Functional analysis of FAM114A2 in THP-1 cells.
A) FAM114A2 siRNAs and scramble were transfected into THP-1 cells and untreated control, following which THP-1 cells were treated with PMA (150mM) for 24 hours to transform the cells to macrophages. Cell culture supernatant was collected for TNFα ELISA analysis. All TNFα level values are shown as relative to PMA treated scramble control. All experiments were conducted in triplicate. B) Immunoblot analysis showing FAM114A2 gene knockdown increased the autophagy related protein, P62, and decreased the LC3 protein level - Representative Immunoblotting image shown. C) Quantitative analysis of Immunoblotting results using Image J. All protein expression values were normalized to GAPDH and are shown relative to scramble control in each group. All experiments were conducted in triplicate. phorbol 12-myristate 13-acetate – PMA, * p<0.05 ** p<0.01.

References

    1. Papamichael K, Gils A, Rutgeerts P, Levesque BG, Vermeire S, Sandborn WJ, et al. Role for therapeutic drug monitoring during induction therapy with TNF antagonists in IBD: evolution in the definition and management of primary nonresponse. Inflamm Bowel Dis. 2015;21(1):182–97. - PubMed
    1. Barber GE, Yajnik V, Khalili H, Giallourakis C, Garber J, Xavier R, et al. Genetic Markers Predict Primary Non-Response and Durable Response To Anti-TNF Biologic Therapies in Crohn’s Disease. Am J Gastroenterol. 2016;111(12):1816–22. - PMC - PubMed
    1. Iijima H, Kobayashi T, Nagasaka M, Shinzaki S, Kitamura K, Suzuki Y, et al. Management of Primary Nonresponders and Partial Responders to Tumor Necrosis Factor-alpha Inhibitor Induction Therapy among Patients with Crohn’s Disease. Inflamm Intest Dis. 2020;5(2):78–83. - PMC - PubMed
    1. Park SC, Jeen YT. Current and emerging biologics for ulcerative colitis. Gut Liver. 2015;9(1):18–27. - PMC - PubMed
    1. Su C, Salzberg BA, Lewis JD, Deren JJ, Kornbluth A, Katzka DA, et al. Efficacy of anti-tumor necrosis factor therapy in patients with ulcerative colitis. Am J Gastroenterol. 2002;97(10):2577–84. - PubMed

Publication types

MeSH terms

Substances