. 2021 Aug 11;12(1):4860.
doi: 10.1038/s41467-021-24859-2.

GOT1 inhibition promotes pancreatic cancer cell death by ferroptosis

Affiliations

GOT1 inhibition promotes pancreatic cancer cell death by ferroptosis

Daniel M Kremer et al. Nat Commun. .

Abstract

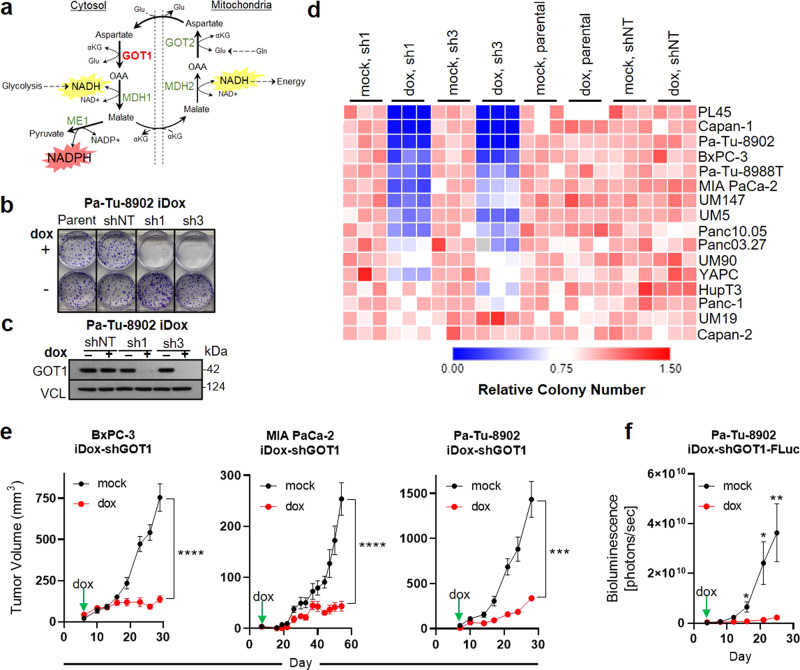
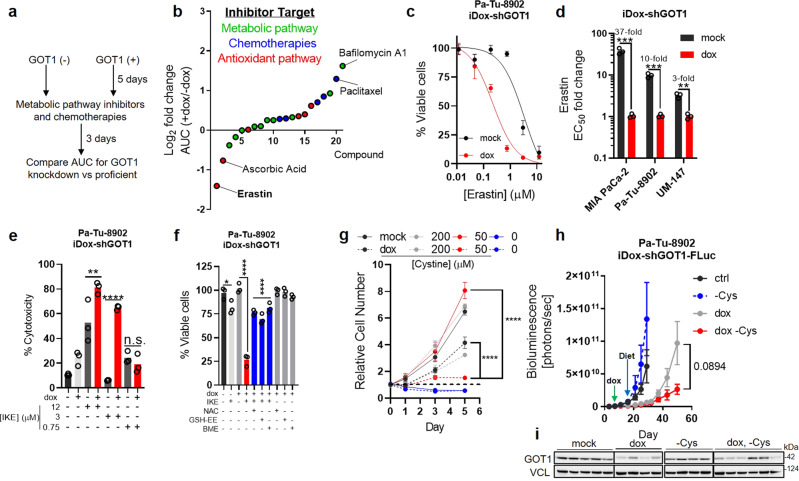
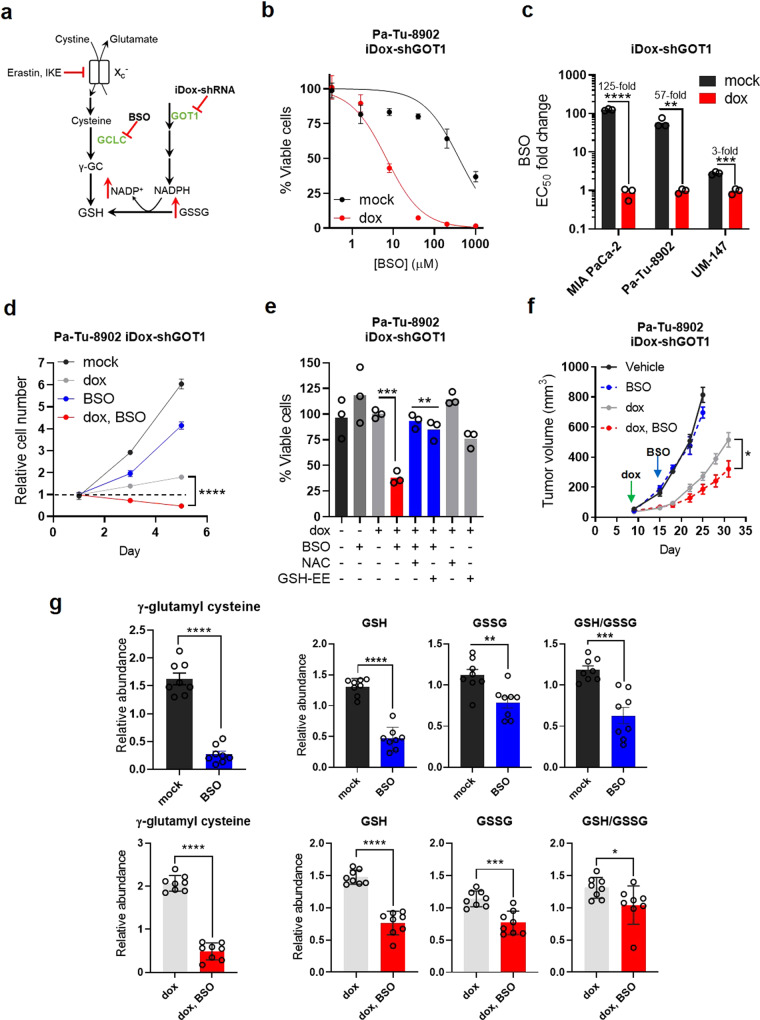
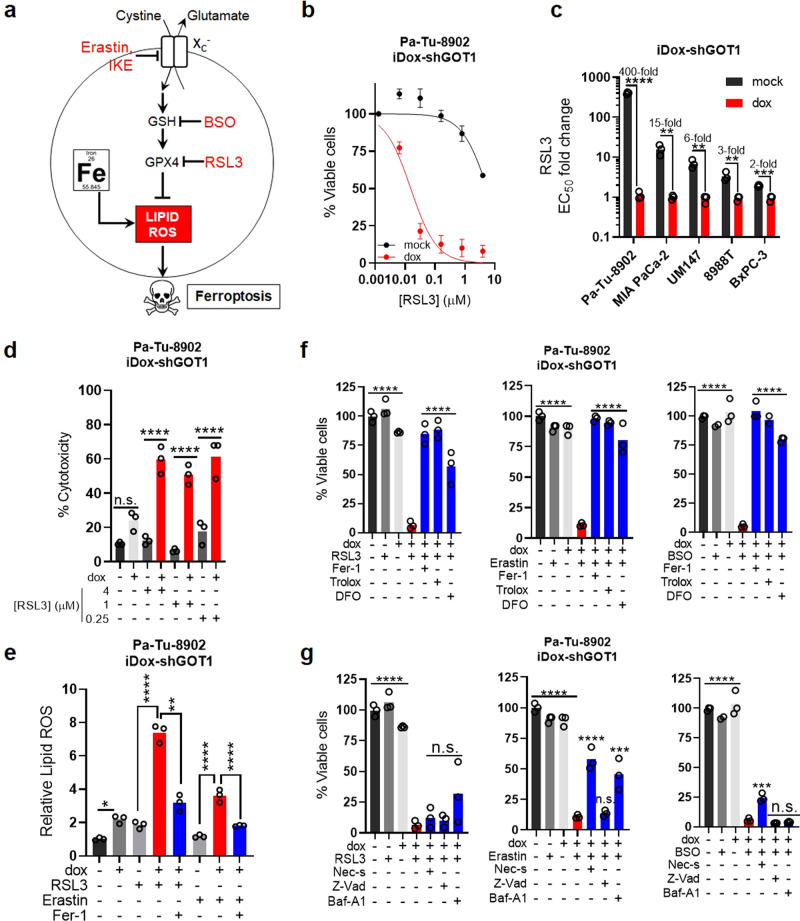
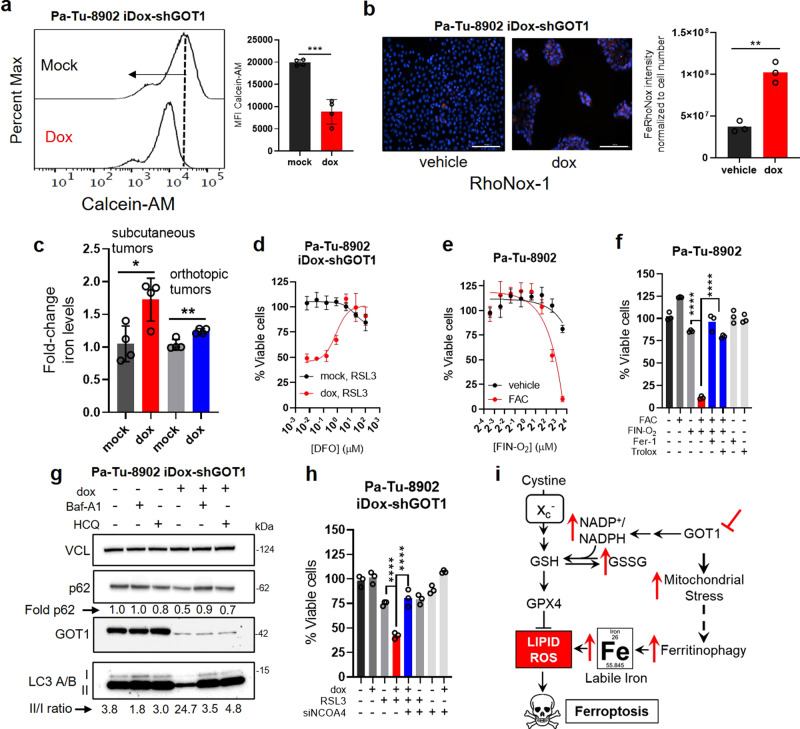
Cancer metabolism is rewired to support cell survival in response to intrinsic and environmental stressors. Identification of strategies to target these adaptions is an area of active research. We previously described a cytosolic aspartate aminotransaminase (GOT1)-driven pathway in pancreatic cancer used to maintain redox balance. Here, we sought to identify metabolic dependencies following GOT1 inhibition to exploit this feature of pancreatic cancer and to provide additional insight into regulation of redox metabolism. Using pharmacological methods, we identify cysteine, glutathione, and lipid antioxidant function as metabolic vulnerabilities following GOT1 withdrawal. We demonstrate that targeting any of these pathways triggers ferroptosis, an oxidative, iron-dependent form of cell death, in GOT1 knockdown cells. Mechanistically, we reveal that GOT1 inhibition represses mitochondrial metabolism and promotes a catabolic state. Consequently, we find that this enhances labile iron availability through autophagy, which potentiates the activity of ferroptotic stimuli. Overall, our study identifies a biochemical connection between GOT1, iron regulation, and ferroptosis.


Conflict of interest statement

C.A.L. has received consulting fees from Astellas Pharmaceuticals and is an inventor on patents pertaining to Kras regulated metabolic pathways, redox control pathways in pancreatic cancer, and targeting the GOT1-pathway as a therapeutic approach: (1) US Patent No: 20190136238, 05/09/2019; International Patent No: WO2013177426-A2, 04/23/2015 “Targeting the glutamine to pyruvate pathway for treatment of oncogenic Kras-associated cancer”, and (2) US Patent No: 2015126580-A1, 05/07/2015 “Methods for diagnosing and treating oncogenic Kras-associated cancer”. The other authors declare no competing interests.

Figures

Fig. 1
Fig. 1. PDA requires GOT1 for cellular proliferation and tumor growth.
a Malate-aspartate shuttle model. b, c Colony formation and immunoblot analysis of Pa-Tu-8902 cells stably expressing iDox-shRNA constructs following 10 days GOT1 knockdown. shRNAs target the coding region of GOT1 (sh1), or the 3′UTR region of GOT1 (sh3). Parental (parent) and scramble (shNT) conditions are also displayed. Vinculin (VCL) was used as a loading control. Immunoblot shown in (c) is representative of three independent experiments. d Relative colony number across a panel of PDA cell lines, n = 3 biological replicates. e Subcutaneous xenograft tumors from three PDA cell lines. Treatment with dox (red) or vehicle (black) (BxPC-3 mock-treated n = 8 mice; dox n = 6 mice; ****P = < 0.0001, MIA PaCa-2 n = 6 mice each group; ****P < 0.0001, Pa-Tu-8902 n = 6 mice each group; ***P = 0.0008). f Orthotopic xenograft tumor growth from Pa-Tu-8902 iDox-shGOT1 stable cells expressing firefly luciferase (FLuc) n = 5 and n = 6 mice were used for vehicle and dox cohorts, respectively; *P = 0.0138, *P = 0.0165, **P = 0.0102. Data shown represent biological replicates examined over one experiment and reproduced in two independent experiments. Error bars represent mean ± SD. Source data are provided as a Source Data file. Gln glutamine, αKG alpha-ketoglutarate, Glu glutamate, OAA oxaloacetate, NADH nicotinamide adenine dinucleotide, NADPH nicotinamide adenine dinucleotide phosphate, GOT glutamic oxaloacetic transaminase, MDH malate dehydrogenase, ME malic enzyme.
Fig. 2
Fig. 2. PDA requires cystine for viability and growth following GOT1 inhibition.
a Screening strategy to identify metabolic dependencies following GOT1 suppression. b Log2 fold change in area under the curve (AUC) from cell viability dose response curves corresponding to each point, n = 3 biological replicates. c Cell viability dose response to erastin comparing mock (black) and GOT1 knockdown (red). d GOT1 sensitization represented as the fold change in the erastin EC50, n = 3 biological replicates, ***P = 0.000526, ***P = 0.000206, **P = 0.001204. e % Cytotoxicity following GOT1 knockdown and IKE (Imidazole ketone erastin) treatment for 24 h. Cytotoxicity was measured by LDH (Lactate dehydrogenase) release and normalized to a cell lysis control, n = 3 biological replicates, **P = 0.0044, ****P < 0.0001, n.s. P = 0.9838. f Cell viability of Pa-Tu-8902 iDox-shGOT1 after 5 days of GOT1 knockdown then 24 h of 750 nM IKE combined with the indicated conditions. 250 μM of N-acetyl-cysteine (NAC), 250 μM GSH-ethyl ester (GSH-EE), and 50 μM of beta-mercaptoethanol (BME) were used (n = 3 biological replicates), *P = 0.0254, ****P < 0.0001, ****P < 0.0001. g Proliferation following GOT1 knockdown and the indicated media conditions (n = 3 biological replicates), ****P < 0.0001, ****P < 0.0001. h, i Orthotopic xenograft tumor growth from Pa-Tu-8902 iDox-shGOT1 stable cell lines co-expressing firefly luciferase (FLuc) treated with vehicle (black, n = 6 mice), dox-containing food (gray, n = 6 mice), cysteine-free diet (-Cys) (blue, n = 5 mice), or dox-containing, cysteine-free food (red, n = 6 mice), n.s. P = 0.0894. GOT1 immunoblot (i) taken from endpoint tumors. Immunoblot in (i) is representative of two independent experiments. Error bars represent mean ± SD in bg or mean ± SEM in (h). Two-tailed unpaired T-test or one-way ANOVA. Source data are provided as a Source Data file.
Fig. 3
Fig. 3. PDA require GSH synthesis for growth upon GOT1 suppression.
a Scheme depicting GSH synthesis and metabolic changes following GOT1 inhibition. b Cell viability dose response, n = 3 biological replicates. c EC50 fold change across multiple PDA cell lines (****P = 0.000008, **P = 0.003905, ***P = 0.000359) following 5 days of GOT1 knockdown and BSO treatment, n = 3 biological replicates. d Proliferation (****P = < 0.0001) following 5 days of GOT1 knockdown and BSO treatment, n = 3 biological replicates. e Cell viability following 72 h of 40 μM BSO or co-treatment with 0.5 mM N-acetyl cysteine (NAC) or 0.5 mM GSH-Ethyl Ester (GSH-EE) following 5 days of GOT1 knockdown (n = 3 biological replicates), ***P = 0.0006, **P = 0.002, **P = 0.0087. f Subcutaneous xenograft growth of Pa-Tu-8902 iDox-shGOT1 cells treated with vehicle (black), 20 mg/kg BSO via drinking water (blue), doxycycline administered in the food (gray), or the combination (red), *P = 0.0193. g Relative abundance of gamma-glutamyl cysteine (γGC) (****P ≤ 0.0001 mock/BSO and ****P < 0.0001 dox/dox, BSO), GSH (****P ≤ 0.0001, ****P < 0.0001) GSSG (**P = 0.0041, ***P = 0.0003) and the GSH/GSSG ratio (***P = 0.0002, *P = 0.0469) from tumors in (f) (n = 8). Error bars represent mean ± SD or ± SEM (f, g). Two-tailed unpaired T-test or one-way ANOVA. Source data are provided as a Source Data file. xc- system xc, γGC gamma-glutamyl cysteine, BSO buthionine sulfoximine, GSH, reduced glutathione, GSSG oxidized glutathione.
Fig. 4
Fig. 4. GOT1 inhibition potentiates ferroptosis.
a Scheme of the GPX4 arm of ferroptosis. b Cell viability dose response curve at 24 h, n = 3 biological replicates. c EC50 fold changes in dose response following GOT1 knockdown and RSL3 treatment, n = 3 biological replicates, ****P ≤ 0.0001, **P = 0.005128, **P = 0.003314, **P = 0.008921, ***P = 0.000691. d % Cytotoxicity following GOT1 knockdown and RSL3 treatment at 24 h. Cytotoxicity was measured by LDH (Lactate dehydrogenase) release and normalized to a cell lysis control, n = 3 biological replicates, n.s. P = 0.1763, ****P = < 0.0001, ****P < 0.0001, ****P < 0.0001. e Relative lipid ROS in Pa-Tu-8902 iDox-shGOT1 treated with 32 nM RSL3 or 750 nM Erastin −/+ 1 μM Ferrostatin-1(Fer-1) for 6 h (n = 3 biological replicates), **P = 0.0057, ****P < 0.0001,****P < 0.0001,****P < 0.0001. f Cell viability of Pa-Tu-8902 iDox-shGOT1 cultured in vehicle (0.1% DMSO) −/+ dox (black and light gray), drug (32 nM RSL3, 750 nM Erastin, 40 μM BSO) −/+ dox (gray and red), or drug and dox (blue) in the presence of lipophilic antioxidants 1 μM Fer-1 and 100 μM Trolox, or an iron chelator 10 μM DFO (deferoxamine), ****P ≤ 0.0001 dox and dox/RSL3, Erastin, BSO; ****P < 0.0001 dox/RSL3 and dox/RSL3, Erastin, BSO/Fer-1, Trolox, DFO. Viability was assessed after 24 h of treatment for RSL3 and Erastin conditions and 72 h for BSO treatment conditions. GOT1 was knocked down for 5 days prior to treatment. Data are normalized to the –dox and vehicle-treated control (n = 3 biological replicates). g Cell viability following the procedure in (f) but in the presence of 10 μM Necrostatin-1 (Nec-s, necroptosis inhibitor), 50 μM ZVAD-FMK (Z-Vad, apoptosis inhibitor), or 1 nM bafilomycin A1 (BA-1, lysosomal acidification inhibitor), n = 3 biological replicates, ****P ≤ 0.0001 dox and dox/RSL3, Erastin, BSO; dox/Erastin, dox/Erastin/Nec-s, ****P  ≤ 0.0001; dox/Erastin, dox/Erastin/Baf-A1, ***P = 0.0002. dox/BSO, dox/BSO/Nec-s, ***P = 0.0021. Error bars represent mean ± SD. Two-tailed unpaired T-test or one-way ANOVA: Non-significant P > 0.05 (n.s., as noted). Source data are provided as a Source Data file. GPX4 glutathione peroxidase 4.
Fig. 5
Fig. 5. GOT1 inhibition promotes labile iron release.
a Calcein-AM histogram (a) and mean fluorescence intensity (MFI) (***P = 0.0002) upon 5 days of GOT1 knockdown, n = 3 biological replicates. b Visualization and quantification of GOT1 knockdown cells treated with the iron probe RhoNox-1, n = 3 biological replicates. **P = 0.0013. Scale bars represent 200 μm. Image is representative of two independent experiments. c ICP-MS (Inductively coupled plasma mass spectrometry) measurements of iron in subcutaneous and orthotopic tumors following GOT1 knockdown, n = 4 tumors, *P = 0.0191 and **P = 0.0036. d Cell viability normalized to vehicle of cells co-treated with 32 nM RSL3 and increasing doses of DFO, n = 2 biological replicates. e Cell viability dose response to FINO2 with or without 200 µM ferric ammonium citrate (FAC), n = 3 biological replicates. Cell viability of FINO2 with 200 µM FAC (ferric ammonium citrate) (f) or the indicated rescue conditions n = 3 biological replicates, ****P = < 0.0001. g Western of autophagy markers following GOT1 knockdown representative of two independent experiments. h Cell viability in cells co-treated with RSL3 and siNCOA4 following GOT1 knockdown, n = 3 biological replicates, ****P ≤ 0.0001. i Model describing the GOT1-mediated potentiation of ferroptosis through ferritinophagic iron release. Error bars represent mean ± SD. Two-tailed unpaired T-test or one-way ANOVA. Source data are provided as a Source Data file.

References

    1. Halbrook CJ, Lyssiotis CA. Employing metabolism to improve the diagnosis and treatment of pancreatic cancer. Cancer Cell. 2017;31:5–19. doi: 10.1016/j.ccell.2016.12.006. - DOI - PubMed
    1. Perera RM, Bardeesy N. Pancreatic cancer metabolism: breaking it down to build it back up. Cancer Discov. 2015;5:1247–1261. doi: 10.1158/2159-8290.CD-15-0671. - DOI - PMC - PubMed
    1. Son J, et al. Glutamine supports pancreatic cancer growth through a KRAS-regulated metabolic pathway. Nature. 2013;496:101–105. doi: 10.1038/nature12040. - DOI - PMC - PubMed
    1. Dixon SJ, et al. Ferroptosis: an iron-dependent form of nonapoptotic cell death. Cell. 2012;149:1060–1072. doi: 10.1016/j.cell.2012.03.042. - DOI - PMC - PubMed
    1. Stockwell BR, et al. Ferroptosis: a regulated cell death nexus linking metabolism, redox biology, and disease. Cell. 2017;171:273–285. doi: 10.1016/j.cell.2017.09.021. - DOI - PMC - PubMed

Publication types

MeSH terms

LinkOut - more resources