. 2021 Aug 11;12(1):4869.
doi: 10.1038/s41467-021-25030-7.

Temporal omics analysis in Syrian hamsters unravel cellular effector responses to moderate COVID-19

Affiliations

Temporal omics analysis in Syrian hamsters unravel cellular effector responses to moderate COVID-19

Geraldine Nouailles et al. Nat Commun. .

Abstract

In COVID-19, immune responses are key in determining disease severity. However, cellular mechanisms at the onset of inflammatory lung injury in SARS-CoV-2 infection, particularly involving endothelial cells, remain ill-defined. Using Syrian hamsters as a model for moderate COVID-19, we conduct a detailed longitudinal analysis of systemic and pulmonary cellular responses, and corroborate it with datasets from COVID-19 patients. Monocyte-derived macrophages in lungs exert the earliest and strongest transcriptional response to infection, including induction of pro-inflammatory genes, while epithelial cells show weak alterations. Without evidence for productive infection, endothelial cells react, depending on cell subtypes, by strong and early expression of anti-viral, pro-inflammatory, and T cell recruiting genes. Recruitment of cytotoxic T cells as well as emergence of IgM antibodies precede viral clearance at day 5 post infection. Investigating SARS-CoV-2 infected Syrian hamsters thus identifies cell type-specific effector functions, providing detailed insights into pathomechanisms of COVID-19 and informing therapeutic strategies.


Conflict of interest statement

G.N. received funding for research from Biotest AG. E.W., P.P., D.P., D.V., J.K., F.P., K.D., M.M., V.F., B.O., S.-M.W., S.A., T.H., B.S., C.D., L.E.S., N.S., M.R., D.B., A.D.G., C.G., M.L. and J.T declare no conflict of interest. M.W. received funding for research from Actelion, Bayer Health Care, Biotest AG, Boehringer Ingelheim, Noxxon, Pantherna, Quark Pharma, Vaxxilon, and for advisory from Actelion, Aptarion, Astra Zeneca, Bayer Health Care, Berlin Chemie, Biotest, Boehringer Ingelheim, Chiesi, Glaxo Smith Kline, Novartis, Noxxon, Pantherna, Teva and Vaxxilon. The funders had no role in the design of the study, in the collection, analyses, or interpretation of data, in the writing of the manuscript, or in the decision to publish the results.

Figures

Fig. 1
Fig. 1. Single-cell dynamics in lungs and blood of SARS-CoV-2 infected Syrian hamsters.
a Uniform manifold approximation and projection (UMAP) plot of identified cell populations in Syrian hamster lungs. Colors representing individual cell types are depicted in legend. b Cell count of isolated cells per lung lobe over time (2, 3, 5, and 14 days post infection (dpi)) and control group (naive, “d0”). c Count of hematopoietic cells per lung lobe in naive hamsters and over time pi. d Changes in cellular density of lung cells in UMAP projection. Coloration indicates log2 fold change between control group and 5 dpi. e Percentage of hematopoietic cells per lung lobe in naive hamsters and over time pi. f UMAP plot of identified cell populations in blood samples. g Cell count of isolated cells per mL blood in naive hamsters and over time pi. h Percentage of identified cell populations in blood samples over time pi and naive animals. i Neutrophil–lymphocyte ratio in blood samples over time pi and naive animals. a, d and f Clusters defined by Louvain clustering, n = 3 per time point. b, c, e, g, h and i Bar plots are plotted per cell type in the order: naive, 2 dpi, 3 dpi, 5 dpi, and 14 dpi (colors fade from dark to light). Data display means ± SD. n = 3 per time point. Ordinary one-way ANOVA, Dunnett’s (b, g, i) and Šídák’s multiple comparisons (c, e, h) test versus corresponding 0 dpi (naive). p < 0.05, ∗∗p < 0.01, ∗∗∗p < 0.001, ∗∗∗∗p < 0.0001. AT1 and AT2: alveolar epithelial cell type 1 and 2, DC: dendritic cells, NK, natural killer cells. Exact p-values in order of appearance: b p = 0.0255; ∗∗p = 0.0078 c alveolar: ∗∗p = 0.0041; p = 0.0102, monocytic: p = 0.0213; p = 0.0226; ∗∗∗∗p < 0.0001; T/NK: ∗∗∗∗p < 0.0001; ∗∗∗p = 0.0002; B cells: p = 0.0106 e alveolar: ∗∗∗∗p < 0.0001; monocytic: ∗∗p = 0.0010; p = 0.0138; ∗∗∗∗p < 0.0001; T/NK: p = 0.0225; ∗∗p = 0.0099 g ∗∗p = 0.0033; p = 0.0174; ∗∗∗p = 0.0004 h classical monocytes: ∗∗∗∗p < 0.0001; neutrophils: ∗∗∗∗p < 0.0001; ∗∗p = 0.0040; p = 0.0257; T cells: ∗∗∗p = 0.0004; B cells: ∗∗∗∗p < 0.0001; ∗∗∗∗p < 0.0001 i ∗∗p = 0.0024.
Fig. 2
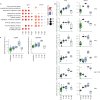
Fig. 2. Proteomics analysis recapitulates transcriptomics and human COVID-19 patient data.
a Temporal evolution of gene ontology/biological process terms connected with immune system response in lung tissue (left part) and in serum (right part), for the indicated time points compared to samples from uninfected control animals. Enriched terms were filtered for terms mentioning immune, interferon, neutrophil, T cell and B cell and attained false discovery rates (fdr) below 0.2 at least at one-day post infection (dpi) in lungs or serum. The redundancy of terms was then reduced using REVIGO. Size of dots correspond to the inverse of the false discovery rate, color corresponds to median log2(fold change (FC)) of proteins, contributing to the term. b Expression values for differentially regulated proteins in hamster serum (control versus infected at 3 dpi, p < 0.01) and lung (control vs. infected at 5 dpi, p < 0.01) that correlate with disease severity in human plasma. Controls from different days are plotted together. Lung sample group sizes: control: n = 12, 2 dpi: n = 6, 3 dpi: n = 5, 5 dpi: n = 6, 14 dpi: n = 5. Serum sample group sizes: control: n = 6, 2 dpi: n = 6, 3 dpi: n = 4, 5 dpi: n = 7, 14 dpi: n = 6. All non-missing values are shown. c Expression values for the differentially expressed (control vs. infected at 5 dpi, p < 0.01) proteins Lgals3 and Lgals3bp (only detected in lung samples). Individual data points are shown in shades of gray. Lung sample group sizes: control: n = 12, 2 dpi: n = 6, 3 dpi: n = 5, 5 dpi: n = 6, 14 dpi: n = 5. b, c Box plots, the middle line in the boxplot displays the median, the box indicates the first and third quartile, whiskers the 1.5 interquartile range (IQR). arb.u.: arbitrary units.
Fig. 3
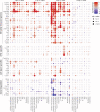
Fig. 3. Induction of inflammatory mediators are strongest and earliest in myeloid cells.
Dotplots of differentially expressed cytokines and inflammatory mediators in lungs. Shown are genes that display a significant absolute log2-transformed fold change of at least one in at least one comparison, and are grouped into four categories indicated on the left. Coloration and point size indicate log2-transformed fold changes (FC) and p-values, respectively, of genes at 2 days post infection (dpi) relative to control groups (naive). Adjusted (adj) p-values were calculated by DEseq2 using Benjamini–Hochberg corrections of two-sided Wald test p-values. Genes are ordered by unsupervised clustering, cell type as in Fig. 1.
Fig. 4
Fig. 4. Transcriptional response to SARS-CoV-2 infection is strong in myeloid and moderate in epithelial cells.
a, b Dotplot of differentially expressed genes in lungs (a) and blood (b). Shown are genes that are in at least one cell type among the top four most changing genes as ranked by adjusted p-value. Example: top 4 most changing genes in alveolar macrophages are Ybx3, Rps15, Rps10, and Uba52. Coloration and point size indicate log2-transformed fold changes (FC) and p-values, respectively, of genes at 2 days post infection (dpi) relative to control groups (naive). Adjusted (adj.) p-values were calculated by DEseq2 using Benjamini–Hochberg corrections of two-sided Wald test p-values. Cell types and genes are ordered by unsupervised clustering. c Top, fraction of monocytic macrophages expressing Cxcl10 in blood and lungs from naive animals and 2 dpi. Bottom, boxplots of Cxcl10 gene expression values of cells positive for Cxcl10 expression. Significance levels were calculated using two-sided generalized linear mixed-effects models for bar plots and a two-sided Wilcoxon rank-sum test on all cells (i.e., not only the ones expressing the gene) for boxplots. p < 0.05; ∗∗p < 0.01; ∗∗∗p < 0.0001. See “Methods” for details. d As in (c), but only in lungs, all time points and both alveolar epithelial cells type 2 (AT2) and monocytic macrophages. Displayed are values for Isg15 (left) and Cxcl10 (right). For all bar plots, data display means ± SD, n = 3 per time point. For all boxplots, cell gene expression data derived from n = 3 animals per time point. The middle line in the boxplot displays the median, the box indicates the first and third quartile, whiskers the 1.5 interquartile range (IQR). Outliers beyond are marked by single dots. AT1 and AT2: alveolar epithelial cell type 1 and 2, DC: dendritic cells, NK, natural killer cells; d0: day 0 = naive, d14: 14 dpi. Exact p-values in (c): upper panel: ∗∗p = 0.0022; ∗∗∗p < 0.0001; lower panel: ∗∗p = 0.0015; ∗∗∗p < 0.0001.
Fig. 5
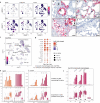
Fig. 5. Virus RNA in monocytic macrophages leads to dose-dependent activation of pro-inflammatory cytokines by TLR signaling.
a Feature plots of entry factor expression in Uniform manifold approximation and projection (UMAP) projection. Coloration indicates expression values of indicated genes. be Detection of viral RNA by in situ-hybridization. Labeled are supposed endothelium (b, hash), bronchial epithelial cells (b, arrowhead), AT1 (c, arrowhead) and AT2 (c, arrow). (d, inset), macrophages containing viral RNA and cell debris (arrowhead), and an example of high levels of viral RNA without cell debris in the inset (arrow). For be red signals viral RNA and blue hemalaun counterstain. Time points: b, c from 2 dpi, d from 3 dpi, e staining control. Bars: b, d, e = 50 µm, c = 100 µm, Inset in d = 20 µm. Micrographs representative of n = 6 per time point pi. f Cells in the UMAP projection are colored by amount of viral RNA (log10 transformed percentage of viral RNA per cell), along with overview of identified cell types in lungs. g Dotplot of cytokine expression in monocytic macrophages containing viral RNA compared to those without viral RNA. Coloration and point size indicate log2 fold change and adjusted (adj.) p-value for each time point 2, 3, and 5 dpi. Adjusted (adj.) p-values were calculated by DEseq2 using Benjamini–Hochberg corrections of two-sided Wald test p-values. h, i Bar- and boxplots of Isg15 (h) and Cxcl10 (i) gene expression in AT2 and monocytic macrophages along, comparing cells containing viral RNA to those without for 2, 3, and 5 dpi. Barplot shows percentage of cells positive for respective gene. Boxplots show gene expression levels in cells positive for respective gene, j Bar- and boxplots of Cxcl10 in monocytic macrophages and fraction of Cxcl10 positive cells for each time point pi and naive animals, with cells grouped by increasing virus levels for 2, 3, and 5 dpi. hj Barplots, data display means ± SD, n = 3 animals per time point. Significance levels calculated using two-sided generalized linear mixed-effects models. For box plots, the middle line in the boxplot displays the median, the box indicates the first and third quartile, whiskers the 1.5 interquartile range (IQR), cell gene expression data derived from n = 3 animals per time point two-sided Wilcoxon rank-sum test on all cells (i.e., not only the ones expressing the gene) for boxplots. p < 0.05; ∗∗p < 0.01; ∗∗∗p < 0.0001. See “Methods” for details. AT1 and AT2: alveolar epithelial cell type 1 and 2, DC: dendritic cells, NK, natural killer cells; d0: day 0 = naive, d14: 14 dpi. Exact p-values in order of appearance in (h) upper panel: p = 0.0338; lower panel: ∗∗p = 0.0093; p = 0.014; ∗∗∗p < 0.0001; ∗∗∗p < 0.0001; ∗∗∗p < 0.0001; i upper panel: p = 0.0270; ∗∗∗p < 0.0001; ∗∗∗p < 0.0001; ∗∗∗p < 0.0001; lower panel: ∗∗∗p < 0.0001; ∗∗∗p < 0.0001; ∗∗∗p < 0.0001; j upper panel: ∗∗∗p < 0.0001; ∗∗p = 0.0004; ∗∗p = 0.0022; p = 0.0131; ∗∗∗p < 0.0001; ∗∗∗p < 0.0001; ∗∗p = 0.0003; ∗∗p = 0.0033; ∗∗∗p < 0.0001; lower panel: ∗∗∗p < 0.0001; ∗∗p = 0.0015; ∗∗p = 0.0064; ∗∗p = 0.0034; ∗∗∗p < 0.0001; ∗∗∗p < 0.0001; ∗∗∗p < 0.0001.
Fig. 6
Fig. 6. Endothelial cells show subtype and time specific activation of cytokines.
a Uniform manifold approximation and projection (UMAP) plot of lung endothelial cell subpopulations. Clusters defined by Louvain clustering, n = 3 per time point. Colors representing individual cell types are depicted in legend. b Dotplot of differentially expressed genes in lung endothelial cell subpopulations over time. Shown are genes that are in at least one cell type among the top 10 most changing genes as ranked by adjusted (adj.) p-value. Adjusted (adj.) p-values were calculated by DEseq2 using Benjamini–Hochberg corrections of two-sided Wald test p-values. c Dotplot of differentially expressed genes from two sets (upper set: cytokine/inflammatory mediators; lower set: endothelial/stress/mitosis/apoptosis factors) as indicated in lung endothelial cell subpopulations over time pi. For both b, c coloration and point size indicate log2-transformed fold changes and p-values, respectively, of genes at 2 days post infection (dpi) relative to control groups (naive). Adjusted (adj.) p-values were calculated by DEseq2 using Benjamini–Hochberg corrections of two-sided Wald test p-values.
Fig. 7
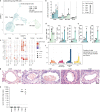
Fig. 7. Syrian hamsters exhibit a strong cytotoxic T/NK cell response at day 5 post infection.
a Uniform manifold approximation and projection (UMAP) plot of lung T/NK cell subclustering indicating cell subpopulations. Clusters defined by Louvain clustering, n = 3 per time point. Colors representing individual cell types are depicted in legend. b Count of lung T cell subpopulations and NK cells per lung lobe. c Dotplot of master regulators of T cell differentiation and effector genes. Coloration and point size indicate log2 fold change and adjusted (adj.) p-value, respectively. Adjusted (adj.) p-values were calculated by DEseq2 using Benjamini–Hochberg corrections of two-sided Wald test p-values. Data from n = 3 animals per time point. d Fraction of Ifng+ cells in CD4+ T, CD8+ T and NK cells at 2, 3, 5, and 14 days post infection (dpi) and naive. e Fraction of Gzma+ cells in CD8+ T cells at 2, 3, 5, and 14 dpi and naive. f Fraction of AT2 cells, monocytic macrophages, endothelial cells, and AT1 cells containing both at least one cell type marker gene (AT2: Sftpa1, Sftpc—monocytic macrophages: Fcn1, Saa3—endothelial cells: Cldn5, Plvap—AT1: Ager, Aqp5) together with Gzma. Data display means ± SD, n = 3 animals per time point. g Histopathology of blood vessels at different time points, scale bar for all time points: 50 µm. Micrographs represent n = 6 animals per time point pi. h Serum neutralization titers of SARS-CoV-2 infected hamsters at 5 and 14 dpi. Serum titers of naive, 2 and 3 dpi did not neutralize up to detection limit 1:4 (dotted line). Data display n = 3 animals with mean per time point. b, d, e Bar plots are plotted per cell type in the order: naive, 2 dpi, 3 dpi, 5 dpi, and 14 dpi. (colors fade from dark to light). Data display means ± SD. n = 3 animals per time point. Ordinary one-way ANOVA, Šídák’s multiple comparisons test versus corresponding 0 dpi (naive). P-values: p < 0.05, ∗∗p < 0.01, ∗∗∗p < 0.001, ∗∗∗∗p < 0.0001. AT1 and AT2: alveolar epithelial cell type 1 and 2, NK: natural killer cells, ILC: Innate lymphoid cells. d0: day 0 = naive, d14: 14 dpi. Exact p-values in order of appearance: b CD4: ∗∗p = 0.0036; p = 0.0261; NK: **p = 0.0046 c IfnγNK: ∗∗∗∗p < 0.0001; ∗∗∗p = 0.0003; ∗∗p = 0.0024; IfnγCD4: ∗∗∗p = 0.0002; IfnγCD8: ∗∗∗∗p < 0.0001; GzmaCD4: ∗∗∗∗p < 0.0001; GzmaCD8: ∗∗∗∗p < 0.0001.

References

    1. Guan WJ, et al. Clinical characteristics of coronavirus disease 2019 in China. N. Engl. J. Med. 2020;382:1708–1720. doi: 10.1056/NEJMoa2002032. - DOI - PMC - PubMed
    1. Osterrieder, N. et al. Age-dependent progression of SARS-CoV-2 infection in Syrian hamsters. Viruses12, 779 (2020). - PMC - PubMed
    1. Imai M, et al. Syrian hamsters as a small animal model for SARS-CoV-2 infection and countermeasure development. Proc. Natl Acad. Sci. USA. 2020;117:16587–16595. doi: 10.1073/pnas.2018975117. - DOI - PMC - PubMed
    1. Bertzbach, L. D. et al. SARS-CoV-2 infection of Chinese hamsters (Cricetulus griseus) reproduces COVID-19 pneumonia in a well-established small animal model. Transbound Emerg. Dis. 68, 1075–1079 (2020). - PMC - PubMed
    1. Trimpert J, et al. The Roborovski dwarf hamster is a highly susceptible model for a rapid and fatal course of SARS-CoV-2 Infection. Cell Rep. 2020;33:108488. doi: 10.1016/j.celrep.2020.108488. - DOI - PMC - PubMed

Publication types