. 2021 Aug 11;12(1):4854.
doi: 10.1038/s41467-021-24981-1.

Downregulation of exhausted cytotoxic T cells in gene expression networks of multisystem inflammatory syndrome in children

Noam D Beckmann #  1   2 Phillip H Comella #  3   4   5 Esther Cheng #  3   5 Lauren Lepow #  6 Aviva G Beckmann  3 Scott R Tyler  3 Konstantinos Mouskas  3 Nicole W Simons  3 Gabriel E Hoffman  3 Nancy J Francoeur  3   4 Diane Marie Del Valle  7 Gurpawan Kang  8 Anh Do  3   4 Emily Moya  3 Lillian Wilkins  3 Jessica Le Berichel  7 Christie Chang  9 Robert Marvin  9 Sharlene Calorossi  9 Alona Lansky  9 Laura Walker  9 Nancy Yi  9 Alex Yu  3 Jonathan Chung  7 Matthew Hartnett  10 Melody Eaton  9 Sandra Hatem  7 Hajra Jamal  11 Alara Akyatan  12 Alexandra Tabachnikova  11 Lora E Liharska  3 Liam Cotter  3   5 Brian Fennessy  3 Akhil Vaid  3 Guillermo Barturen  13 Hardik Shah  3 Ying-Chih Wang  3 Shwetha Hara Sridhar  3 Juan Soto  3   4 Swaroop Bose  3   4 Kent Madrid  3   4 Ethan Ellis  3   4 Elyze Merzier  3   4 Konstantinos Vlachos  3   4 Nataly Fishman  3   4 Manying Tin  3   4 Melissa Smith  3   4 Hui Xie  9   11 Manishkumar Patel  9   11 Kai Nie  9   11 Kimberly Argueta  9   11 Jocelyn Harris  9   11 Neha Karekar  9   11 Craig Batchelor  9   11 Jose Lacunza  9   11 Mahlet Yishak  9   11 Kevin Tuballes  9   11 Ieisha Scott  9   11 Arvind Kumar  5 Suraj Jaladanki  3 Charuta Agashe  9   11 Ryan Thompson  3   4 Evan Clark  3 Bojan Losic  3 Lauren Peters  3 Mount Sinai COVID-19 Biobank TeamPanagiotis Roussos  3   4   6 Jun Zhu  10 Wenhui Wang  10 Andrew Kasarskis  10 Benjamin S Glicksberg  3 Girish Nadkarni  14   15   16   17 Dusan Bogunovic  3 Cordelia Elaiho  18 Sandeep Gangadharan  19 George Ofori-Amanfo  19 Kasey Alesso-Carra  19 Kenan Onel  3   19 Karen M Wilson  19 Carmen Argmann  3 Supinda Bunyavanich  3   4   19 Marta E Alarcón-Riquelme  3 Thomas U Marron  7   9 Adeeb Rahman  7   9   11   20 Seunghee Kim-Schulze  7   9   11   20 Sacha Gnjatic  7   9   11   20   21   22 Bruce D Gelb  3   19   23 Miriam Merad  7   9   11   20 Robert Sebra  3   4   24   25 Eric E Schadt  26   27   28 Alexander W Charney  29   30   31   32
Collaborators, Affiliations

Downregulation of exhausted cytotoxic T cells in gene expression networks of multisystem inflammatory syndrome in children

Noam D Beckmann et al. Nat Commun. .

Abstract

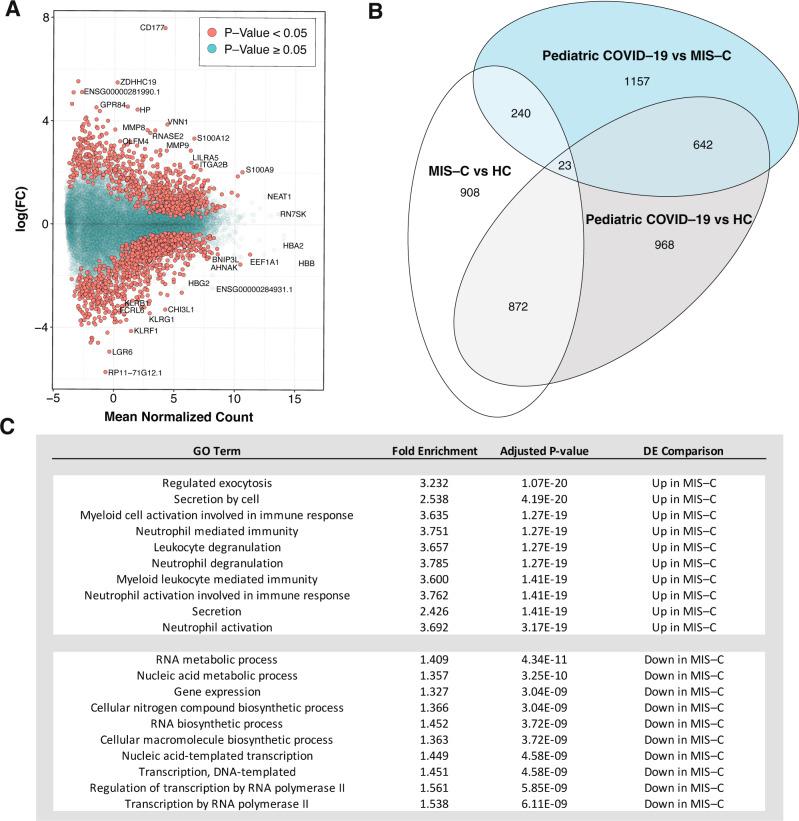
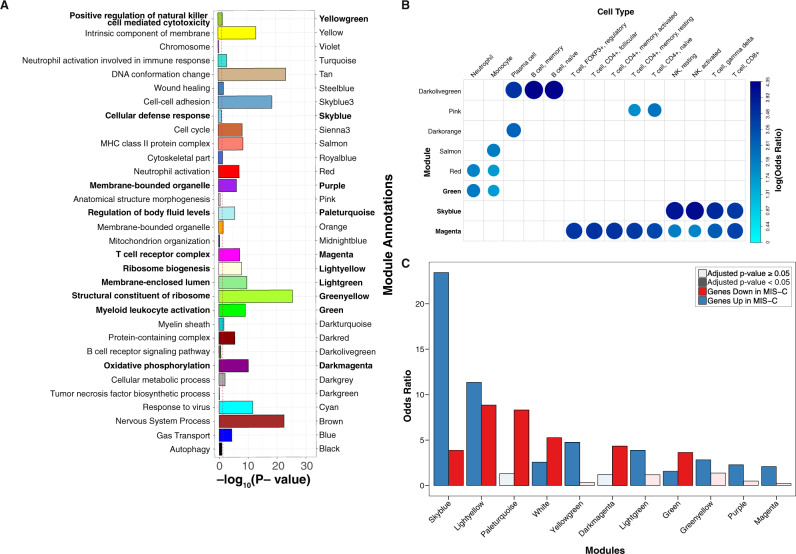
Multisystem inflammatory syndrome in children (MIS-C) presents with fever, inflammation and pathology of multiple organs in individuals under 21 years of age in the weeks following severe acute respiratory syndrome coronavirus 2 (SARS-CoV-2) infection. Although an autoimmune pathogenesis has been proposed, the genes, pathways and cell types causal to this new disease remain unknown. Here we perform RNA sequencing of blood from patients with MIS-C and controls to find disease-associated genes clustered in a co-expression module annotated to CD56dimCD57+ natural killer (NK) cells and exhausted CD8+ T cells. A similar transcriptome signature is replicated in an independent cohort of Kawasaki disease (KD), the related condition after which MIS-C was initially named. Probing a probabilistic causal network previously constructed from over 1,000 blood transcriptomes both validates the structure of this module and reveals nine key regulators, including TBX21, a central coordinator of exhausted CD8+ T cell differentiation. Together, this unbiased, transcriptome-wide survey implicates downregulation of NK cells and cytotoxic T cell exhaustion in the pathogenesis of MIS-C.


Conflict of interest statement

S.G. reports consultancy and/or advisory roles for Merck, Neon Therapeutics and OncoMed and research funding from Bristol-Myers Squibb, Genentech, Immune Design, Agenus, Janssen R&D, Pfizer, Takeda, and Regeneron. No other author claims competing interests.

Figures

Fig. 1
Fig. 1. Study overview.
Workflow of the analyses presented in the paper. A RNA-seq was generated on whole blood samples from MIS-C cases, pediatric COVID-19 cases, and healthy controls. B Deconvolution estimated the relative cell-type proportions in each transcriptome, which were compared between cases and controls to identify the immune cell types involved in the pathogenesis of MIS-C. C Expression of each gene in the transcriptome was tested for association with disease, resulting in a MIS-C signature that was queried to resolve the dysregulated molecular pathways. D Co-expression network construction organized genes into coherent units called modules. E and F Modules loaded with genes of the MIS-C signature were empirically identified (E), validated using DE signatures from a large Kawasaki disease (KD) gene-expression dataset (F), and functionally annotated to pathway, cell type, and other disease signatures (F). G The module with the strongest enrichment for MIS-C that also enriched for KD signatures was further annotated to pinpoint cell subtypes, and key regulators of the processes captured by this module were identified in a regulatory network built from whole blood gene expression in an independent cohort. This figure was created with BioRender.com.
Fig. 2
Fig. 2. Differential expression analyses identify the transcriptional signature of MIS-C.
A Differential expression (DE) analysis for MIS-C patients versus HCs. The x-axis is the mean normalized count for each gene and the y-axis is the log2(fold-change) for the differential expression. Positive and negative log2(fold change) represent genes upregulated and downregulated in MIS-C, respectively, and the significance of association between gene expression and MIS-C status is indicated by the color of the dots as defined in the legend. B Overlap of MIS-C and pediatric COVID-19 transcriptional signatures: Venn diagram of the overlap of genes across DE signatures. Each comparison is labeled on the plot. C GO terms for MIS-C signature: GO term enrichment results for the top 10 upregulated and downregulated processes in MIS-C compared to HCs. Two-sided Fisher tests were used and p-values were adjusted for multi-testing as described in the “Methods” section. Full DE results and pathway enrichments for all comparisons in B can be found in Supplementary Data 7 and 8.
Fig. 3
Fig. 3. Co-expression network analysis identifies modules of genes dysregulated in MIS-C.
A Module GO term enrichments. The y-axis is the most significant GO term associated with each module, the x-axis is the −log10(adjusted p-value) for the enrichment (performed using Fisher’s test). Bars are colored by module names, which are also specified for clarity. Only modules with an enrichment p-value < 1 are shown. The threshold for significance, −log10(0.05), is indicated by the red dashed line. In bold lettering are the modules enriched for the MIS-C signature. B Module cell type signature enrichments. The x-axis and y-axis are the names of the modules and of the cell type signatures, respectively. All signatures shown here are derived from the LM22 reference (Newman et al. Nat. Methods, 2015). The color and size of the circles represents the log2(odds ratio) of the enrichments as defined in the legend. In bold are the modules enriched for the MIS-C signature. Only enriched cell types are shown. C Modules enrichment for MIS-C signatures. The x-axis is the module names and the y-axis the odds ratio of the enrichment of the modules for the genes upregulated and downregulated in MIS-C. Only modules significantly enriched for MIS-C DEGs are shown. The color of the bars represent direction and the opacity represent the significance as defined in the legend. All p-values were adjusted for multi-testing as described in the “Methods” section. All module enrichments can be found in Supplementary Data 7, 9–12, 21.
Fig. 4
Fig. 4. Disease enrichments in MIS-C modules and cyan.
Slices are modules and each circular row represents the corresponding disease signature defined in the legend on the right. The purple outer rim of the plot represents the sum of the OR for all enrichments in that slice (performed using Fisher’s test). Each slice is divided into two components that show the OR for the enrichment of genes with ±log(fold change) in the corresponding disease signature (red and blue, respectively, as defined in legend). Numbers in the category slice map the circular rows to disease signatures. ORs are shown for disease signature enrichment adjusted p-values < 0.05. Diseases were grouped in biologically meaningful clusters as defined in the legend. Parenthesis in the legend refers to the source of the signature and the tissue or cell type assessed. References for disease signatures are defined in the “Methods” section and all enrichments can be found in Supplementary Data 15.
Fig. 5
Fig. 5. Further dissection of skyblue implicates cytotoxic lymphocyte subtypes in MIS-C.
A Defining NK cell and CD8+ T cell subtypes in skyblue (Supplementary Data 19). The x-axis represents the OR for the enrichment of skyblue for specific cytotoxic cell subtypes and the y-axis the signatures used. Cell one and cell two refer to the cell subtypes being compared to generate the DE signatures projected onto skyblue and the direction of the bar is shown towards the upregulated cell type in the comparison. The color and length of bars represent the OR of the enrichment test as defined by the x-axis and the legends. For NK cells, we used signatures from Yang et al., Nat. Commun., 2019 (labeled NK cells), and from Collins et al. Cell 2019 (labeled CD56dim NK subtypes). For CD8+ T cells, we used signatures from Wherry, et al. Immunity, 2007 (labeled CD8+ T cells), and from Beltra et al. Immunity, 2020 (labeled CD8+ Tex subtypes). Detailed descriptions of the subtypes can be found in the Methods. BE Skyblue key drivers measures. The x-axes of the panels represent the key driver genes. B Key driver analysis results (hypergeometric test).The y-axis of this panel is the −log10(Bonferroni adjusted p-value) of key driver analysis (Supplementary Data 21). The red dashed line is the significance threshold at −log10(0.05). C Related disease differential expression. In this panel, the y-axis is the disease name corresponding to Fig. 4. The color represents the direction in the comparison as defined in the legend (defined per the associated reference). D Cell-type-specific expression of key driver genes (Supplementary Data 22). The y-axis is the cell type signatures from the following references: 1 = Newman et al. Nature Methods, 2015; 2 = Park et al. Science, 2020; 3 = Wilk et al. Nature Medicine, 2020; 4 = Liao et al. Nature Medicine, 2020; and 6 = Szabo et al. Nature Communications, 2019. E CD8+ T cell and NK cell subtype-specific signatures. The y-axis is the cell-type name corresponding to A and the color represents the direction in the comparison as defined in the legend (defined per the associated reference).

Update of

  • Cytotoxic lymphocytes are dysregulated in multisystem inflammatory syndrome in children.
    Beckmann ND, Comella PH, Cheng E, Lepow L, Beckmann AG, Mouskas K, Simons NW, Hoffman GE, Francoeur NJ, Del Valle DM, Kang G, Moya E, Wilkins L, Le Berichel J, Chang C, Marvin R, Calorossi S, Lansky A, Walker L, Yi N, Yu A, Hartnett M, Eaton M, Hatem S, Jamal H, Akyatan A, Tabachnikova A, Liharska LE, Cotter L, Fennessey B, Vaid A, Barturen G, Tyler SR, Shah H, Wang YC, Sridhar SH, Soto J, Bose S, Madrid K, Ellis E, Merzier E, Vlachos K, Fishman N, Tin M, Smith M, Xie H, Patel M, Argueta K, Harris J, Karekar N, Batchelor C, Lacunza J, Yishak M, Tuballes K, Scott L, Kumar A, Jaladanki S, Thompson R, Clark E, Losic B; Mount Sinai COVID-19 Biobank Team; Zhu J, Wang W, Kasarskis A, Glicksberg BS, Nadkarni G, Bogunovic D, Elaiho C, Gangadharan S, Ofori-Amanfo G, Alesso-Carra K, Onel K, Wilson KM, Argmann C, Alarcón-Riquelme ME, Marron TU, Rahman A, Kim-Schulze S, Gnjatic S, Gelb BD, Merad M, Sebra R, Schadt EE, Charney AW. Beckmann ND, et al. medRxiv [Preprint]. 2020 Sep 2:2020.08.29.20182899. doi: 10.1101/2020.08.29.20182899. medRxiv. 2020. Update in: Nat Commun. 2021 Aug 11;12(1):4854. doi: 10.1038/s41467-021-24981-1. PMID: 32909006 Free PMC article. Updated. Preprint.

References

    1. Dufort EM, et al. Multisystem inflammatory syndrome in children in New York State. N. Engl. J. Med. 2020;383:347–358. doi: 10.1056/NEJMoa2021756. - DOI - PMC - PubMed
    1. Riphagen S, Gomez X, Gonzalez-Martinez C, Wilkinson N, Theocharis P. Hyperinflammatory shock in children during COVID-19 pandemic. Lancet. 2020;395:1607–1608. doi: 10.1016/S0140-6736(20)31094-1. - DOI - PMC - PubMed
    1. Center for Disease Control and Prevention. HAN Archive-00432|HealthAlert Network (HAN). https://emergency.cdc.gov/han/2020/han00432.asp (2020).
    1. Verdoni L, et al. An outbreak of severe Kawasaki-like disease at the Italian epicentre of the SARS-CoV-2 epidemic: an observational cohort study. Lancet. 2020;395:1771–1778. doi: 10.1016/S0140-6736(20)31103-X. - DOI - PMC - PubMed
    1. Center for Disease Control and Prevention. Kawasaki Syndromehttps://www.cdc.gov/kawasaki/index.html (2020).

Publication types

MeSH terms

Supplementary concepts