

Comparing the responses of the UK, Sweden and Denmark to COVID-19 using counterfactual modelling
- PMID: 34381102
- PMCID: PMC8358009
- DOI: 10.1038/s41598-021-95699-9
Comparing the responses of the UK, Sweden and Denmark to COVID-19 using counterfactual modelling
Abstract
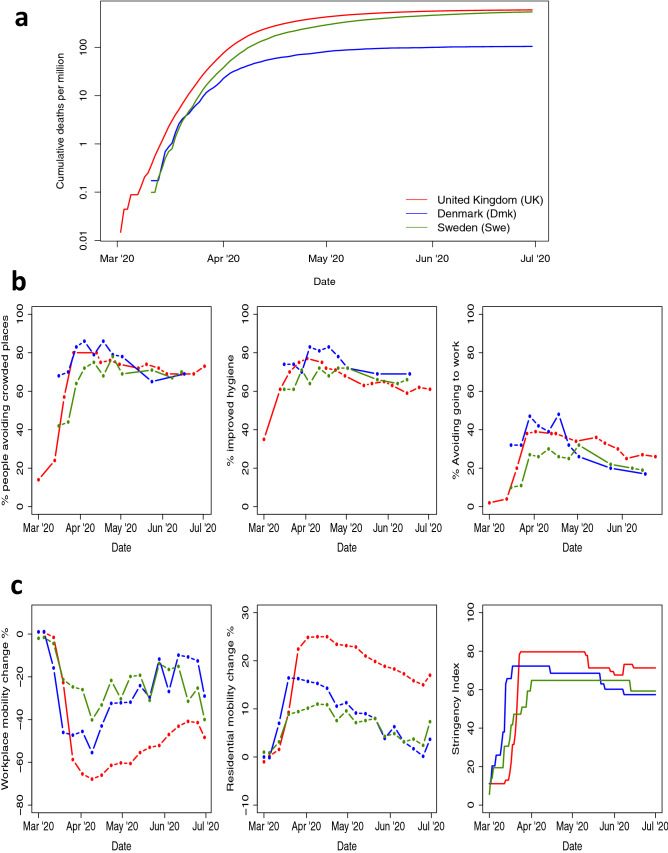
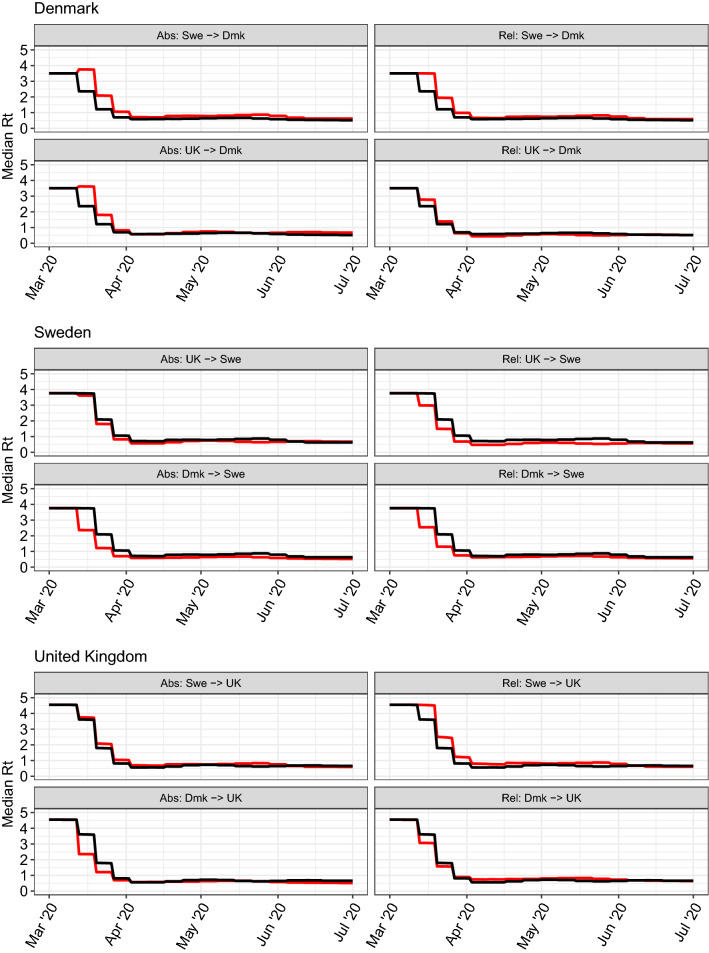
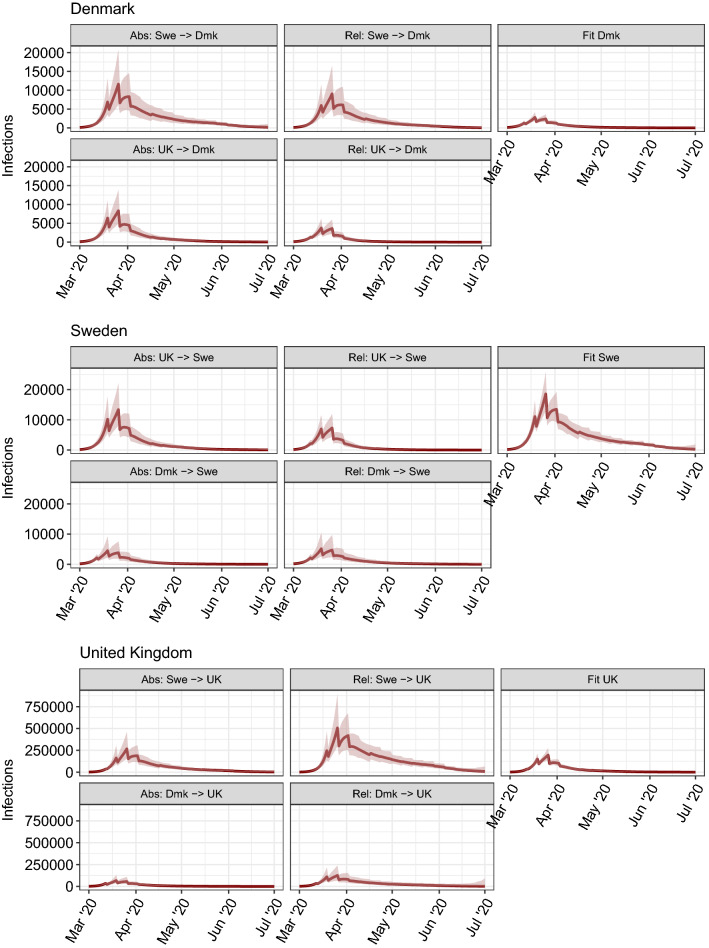
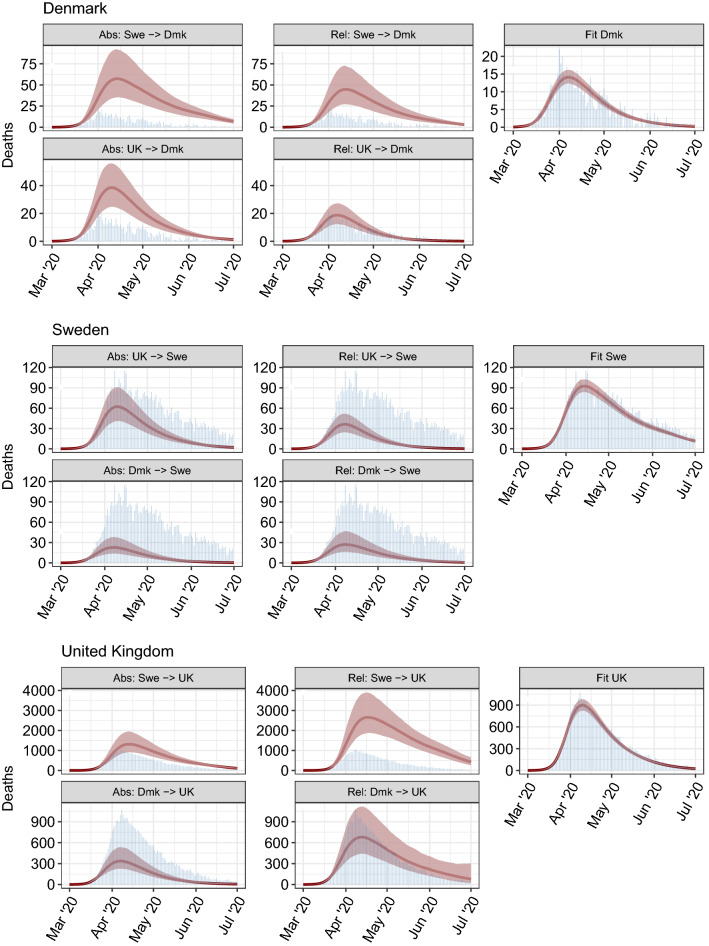
The UK and Sweden have among the worst per-capita COVID-19 mortality in Europe. Sweden stands out for its greater reliance on voluntary, rather than mandatory, control measures. We explore how the timing and effectiveness of control measures in the UK, Sweden and Denmark shaped COVID-19 mortality in each country, using a counterfactual assessment: what would the impact have been, had each country adopted the others' policies? Using a Bayesian semi-mechanistic model without prior assumptions on the mechanism or effectiveness of interventions, we estimate the time-varying reproduction number for the UK, Sweden and Denmark from daily mortality data. We use two approaches to evaluate counterfactuals which transpose the transmission profile from one country onto another, in each country's first wave from 13th March (when stringent interventions began) until 1st July 2020. UK mortality would have approximately doubled had Swedish policy been adopted, while Swedish mortality would have more than halved had Sweden adopted UK or Danish strategies. Danish policies were most effective, although differences between the UK and Denmark were significant for one counterfactual approach only. Our analysis shows that small changes in the timing or effectiveness of interventions have disproportionately large effects on total mortality within a rapidly growing epidemic.
© 2021. The Author(s).
Conflict of interest statement
The authors declare no competing interests.
Figures
References
-
- Twyman, J. Getting it right: YouGov and online survey research in britain (2008).
-
- Aktay, A. et al. Google COVID-19 community mobility reports: Anonymization process description (version 1.0). arXiv:abs/2004.0 (2020).
-
- Hale, T., Petherick, A., Phillips, T., Webster, S. & Kira, B. Oxford COVID-19 government response tracker, blavatnik school of government. Working Paper (2020). - PubMed
-
- Pybus, O., Rambaut, A., COG-UK-Consortium & Others. Preliminary analysis of SARS-CoV-2 importation & establishment of UK transmission lineages. Virological. org (2020).
Publication types
MeSH terms
Grants and funding
LinkOut - more resources
Full Text Sources
Medical
