. 2021 Dec;26(12):7610-7620.
doi: 10.1038/s41380-021-01245-4. Epub 2021 Aug 11.

Brain mapping across 16 autism mouse models reveals a spectrum of functional connectivity subtypes

Affiliations

Brain mapping across 16 autism mouse models reveals a spectrum of functional connectivity subtypes

V Zerbi et al. Mol Psychiatry. 2021 Dec.

Erratum in

Abstract

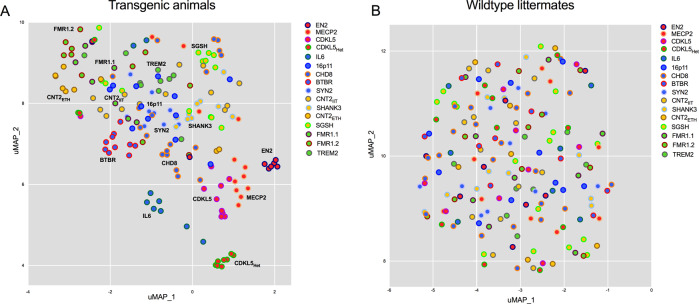
Autism Spectrum Disorder (ASD) is characterized by substantial, yet highly heterogeneous abnormalities in functional brain connectivity. However, the origin and significance of this phenomenon remain unclear. To unravel ASD connectopathy and relate it to underlying etiological heterogeneity, we carried out a bi-center cross-etiological investigation of fMRI-based connectivity in the mouse, in which specific ASD-relevant mutations can be isolated and modeled minimizing environmental contributions. By performing brain-wide connectivity mapping across 16 mouse mutants, we show that different ASD-associated etiologies cause a broad spectrum of connectional abnormalities in which diverse, often diverging, connectivity signatures are recognizable. Despite this heterogeneity, the identified connectivity alterations could be classified into four subtypes characterized by discrete signatures of network dysfunction. Our findings show that etiological variability is a key determinant of connectivity heterogeneity in ASD, hence reconciling conflicting findings in clinical populations. The identification of etiologically-relevant connectivity subtypes could improve diagnostic label accuracy in the non-syndromic ASD population and paves the way for personalized treatment approaches.


Conflict of interest statement

The authors declare no competing interests.

Figures

Fig. 1
Fig. 1. WT datasets show comparable connectome representation across recording sites.
A Schematic of the experimental pre-processing and processing pipeline. An arbitrary sparsity thresholding is taken from the averaged template connectome and then applied to each cohort’s Cohen’s D matrix. B Circos plot of the mouse brain connectome from 112 rsfMRI wildtype datasets, 4% sparsity threshold, highlights a complex network of distributed short- and long-range connections (number of edges = 545). C Quantification of similarity across all WT mice at different sparsity levels (1–50%). Maximum averaged Spearman’s rho was found at 4% sparsity. D Distributions of ranked similarity in connectome representation (Spearman’s rho) between wildtype of each cohort and the group average. E Same data as in (D) but grouped within each of the two measurement sites (ETH, IIT). Both nonparametric testing and Bayesian repeated-measures ANOVAs show that datasets from WT mice exhibit comparable connectome representation independently from recording site. Wilcoxon matched-pairs signed rank test, p = 0.2749. Bayesian factor BF-H0 (null) = 7.57.
Fig. 2
Fig. 2. ASD-related etiologies define a continuous connectivity landscape.
A Uniform manifold approximation and projection (UMAP) 2-dimensional embedding of the connectome data from 176 individual ASD-related model animals of the AMC dataset. Individual data are Z scored and normalized to the average cohort’s WT control population. B UMAP embedding using data from 174 wildtype animals did not lead to clear clusters across both groups and site/anesthesia. The color of the elements represents the model’s cohort. uMAP parameters: n_neighbours = 10 min_dist = 0.1.
Fig. 3
Fig. 3. Functional connectivity signatures can be grouped into four cross-etiological clusters.
A Functional connectivity aberrances in the 16 ASD mouse cohorts. The heatmap displays the effect size (Cohen’s D) differences in connectivity strength between the 16 different mouse models and their specific WT controls for each of the 545 different edges across the connectome. Red represents over-connectivity compared to control and blue represents under-connectivity. The dendrogram on the x axis represents the correlation between edges. B Gaussian Mixture Model revealed similarities across mouse cohorts. Clustering probability (%) is measured based on the proportion of time that two cohorts belong within the same cluster over the 1000 bootstrapped samples using the leave-20%-out criteria. C Clustering probability of the null model generated by randomly assigning knockout and wildtype labels in each cohort 1000 times. D Silhouette score measured mean intra-cluster distance and the mean nearest-cluster distance in both the real and null distributions for different cluster solutions (n = 2, 3, … 16). High silhouette score differences are found in the 2, 3 and 4 cluster solutions. E The hierarchical clustering using 4-cluster solution segregated the models into specific groups depending on their connectivity similarity.
Fig. 4
Fig. 4. Anatomical representation of connectivity deficits in the four subtypes.
A Rendering of regional connectivity deficits in the four clusters at the node level, revealing a heterogeneous set of brain areas with prominent over- and under-connectivity. Data are visualized in Allen Mouse reference space. B Number of connections (displayed as stacked frequencies) that exhibited abnormalities at the parent level. C Correlation matrix between all clusters, considering all 545 edges. D A significant negative correlation was found between Cluster 1 and Cluster 4. Spearman’s rho = −0.48, p = 1.96e−157.

References

    1. Jeste SS, Geschwind DH. Disentangling the heterogeneity of autism spectrum disorder through genetic findings. Nat Rev Neurol. 2014;10:74–81. - PMC - PubMed
    1. Hong S-J, Vogelstein JT, Gozzi A, Bernhardt BC, Yeo BTT, Milham MP. et al. Towards Neurosubtypes in Autism. Biol Psychiatry. 2020;88:111–28. - PubMed
    1. Lyall K, Croen L, Daniels J, Fallin MD, Ladd-Acosta C, Lee BK, et al. The changing epidemiology of autism spectrum disorders. Annu Rev Public Health. 2017;38:81–102. - PMC - PubMed
    1. Sandin S, Lichtenstein P, Kuja-Halkola R, Hultman C, Larsson H, Reichenberg A. The heritability of autism spectrum disorder. JAMA. 2017;318:1182–4. - PMC - PubMed
    1. Sestan N, State MW. Lost in translation: traversing the complex path from genomics to therapeutics in autism spectrum disorder. Neuron. 2018;100:406–23. - PMC - PubMed

Publication types