. 2021 Aug;596(7873):576-582.
doi: 10.1038/s41586-021-03796-6. Epub 2021 Aug 11.

Cycling cancer persister cells arise from lineages with distinct programs

Affiliations

Cycling cancer persister cells arise from lineages with distinct programs

Yaara Oren et al. Nature. 2021 Aug.

Abstract

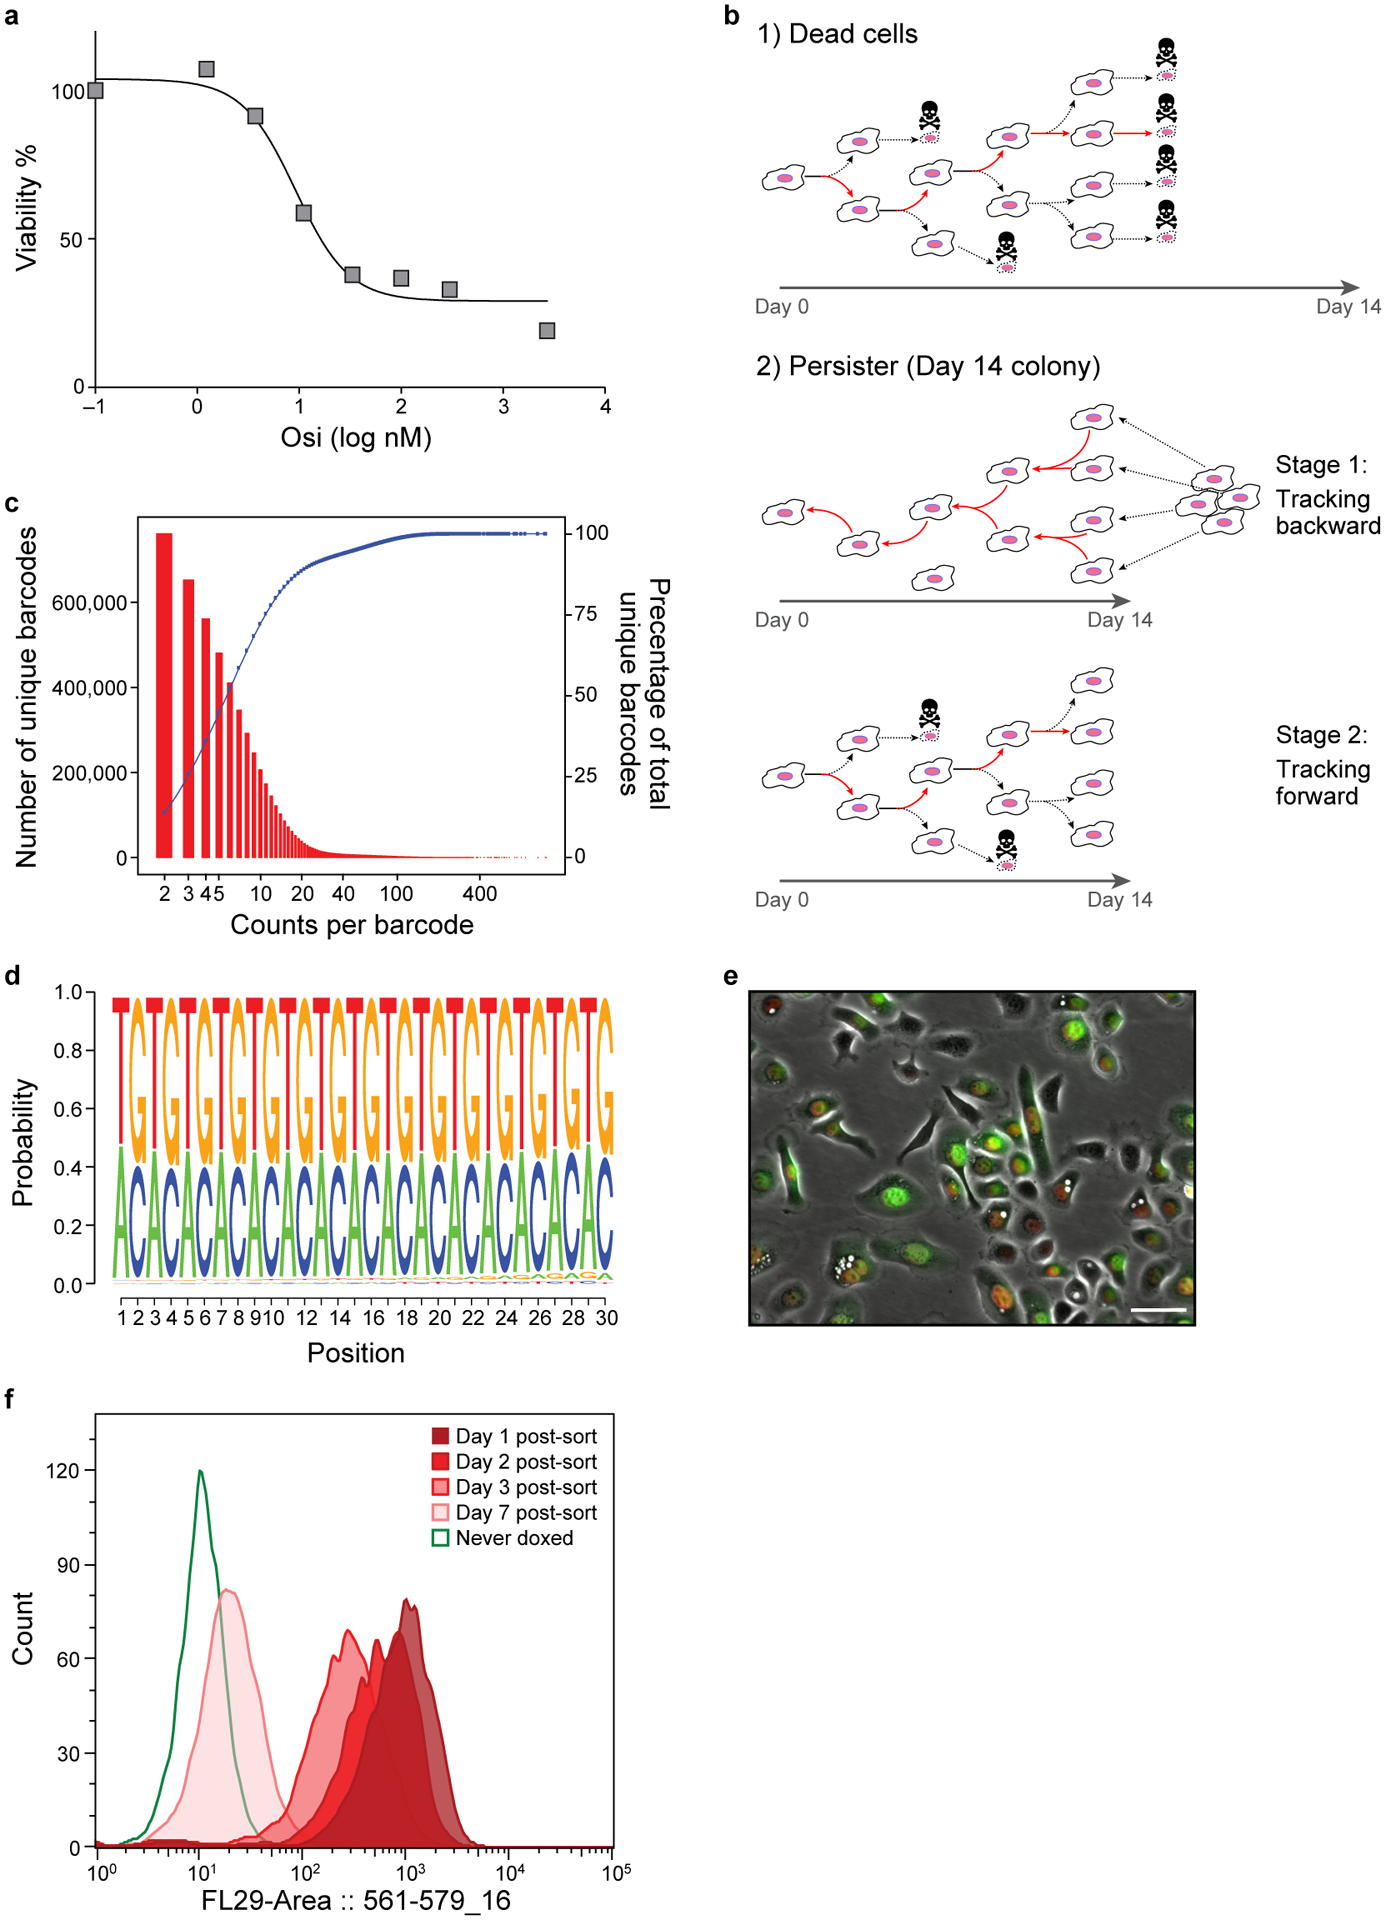
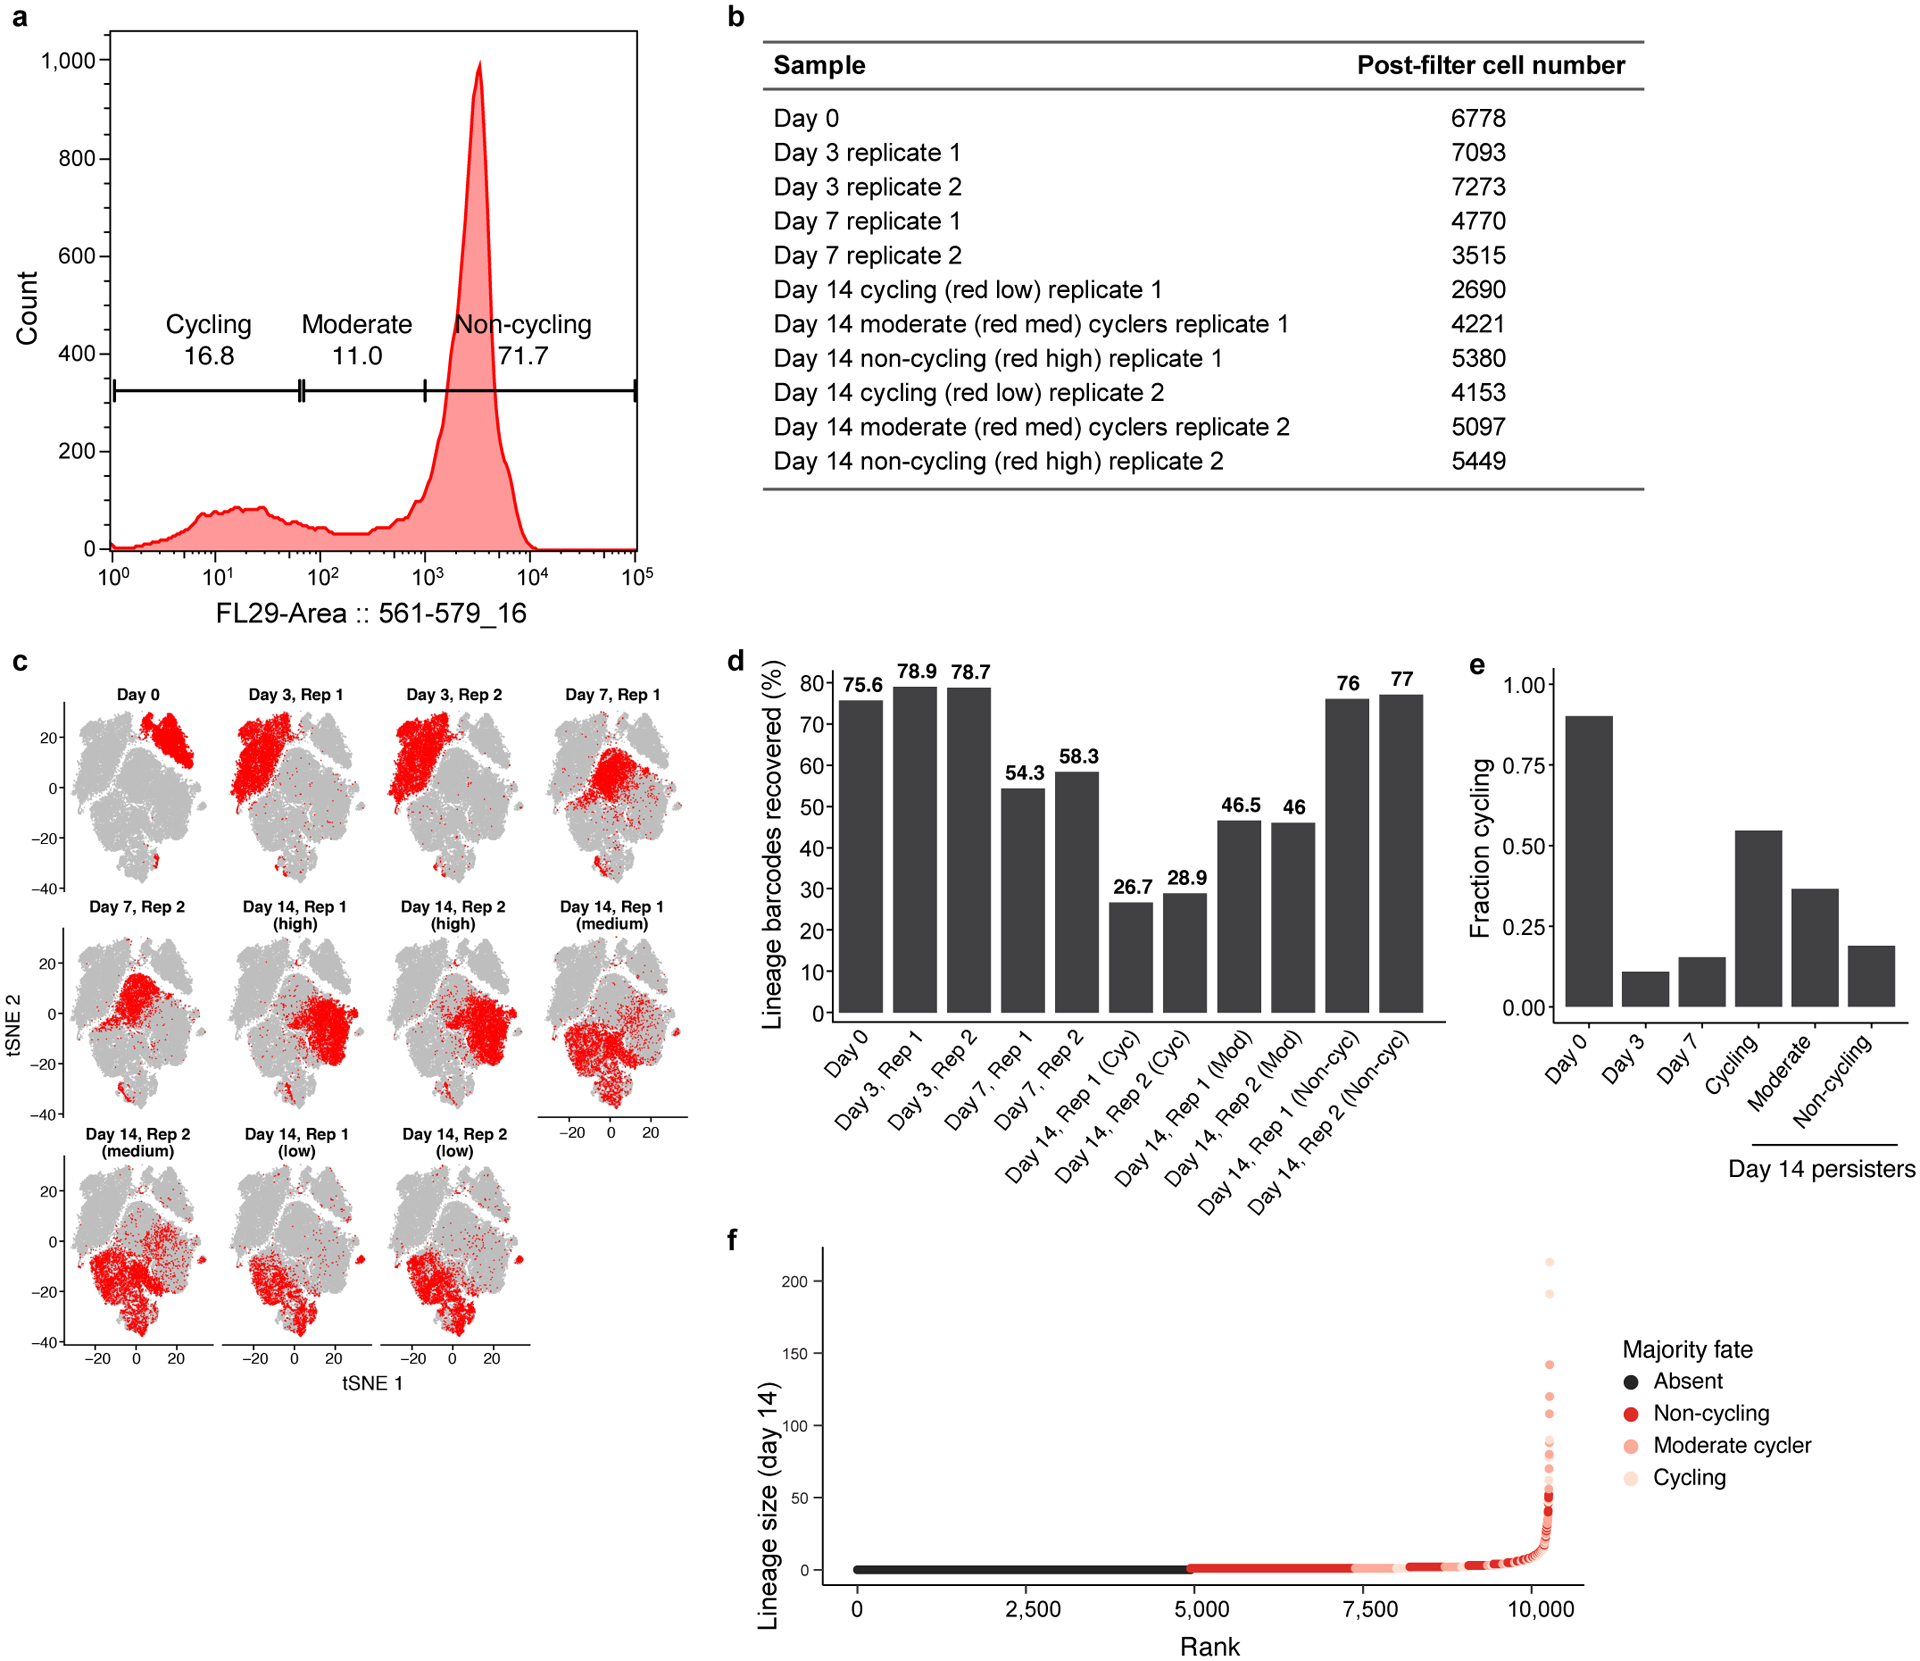
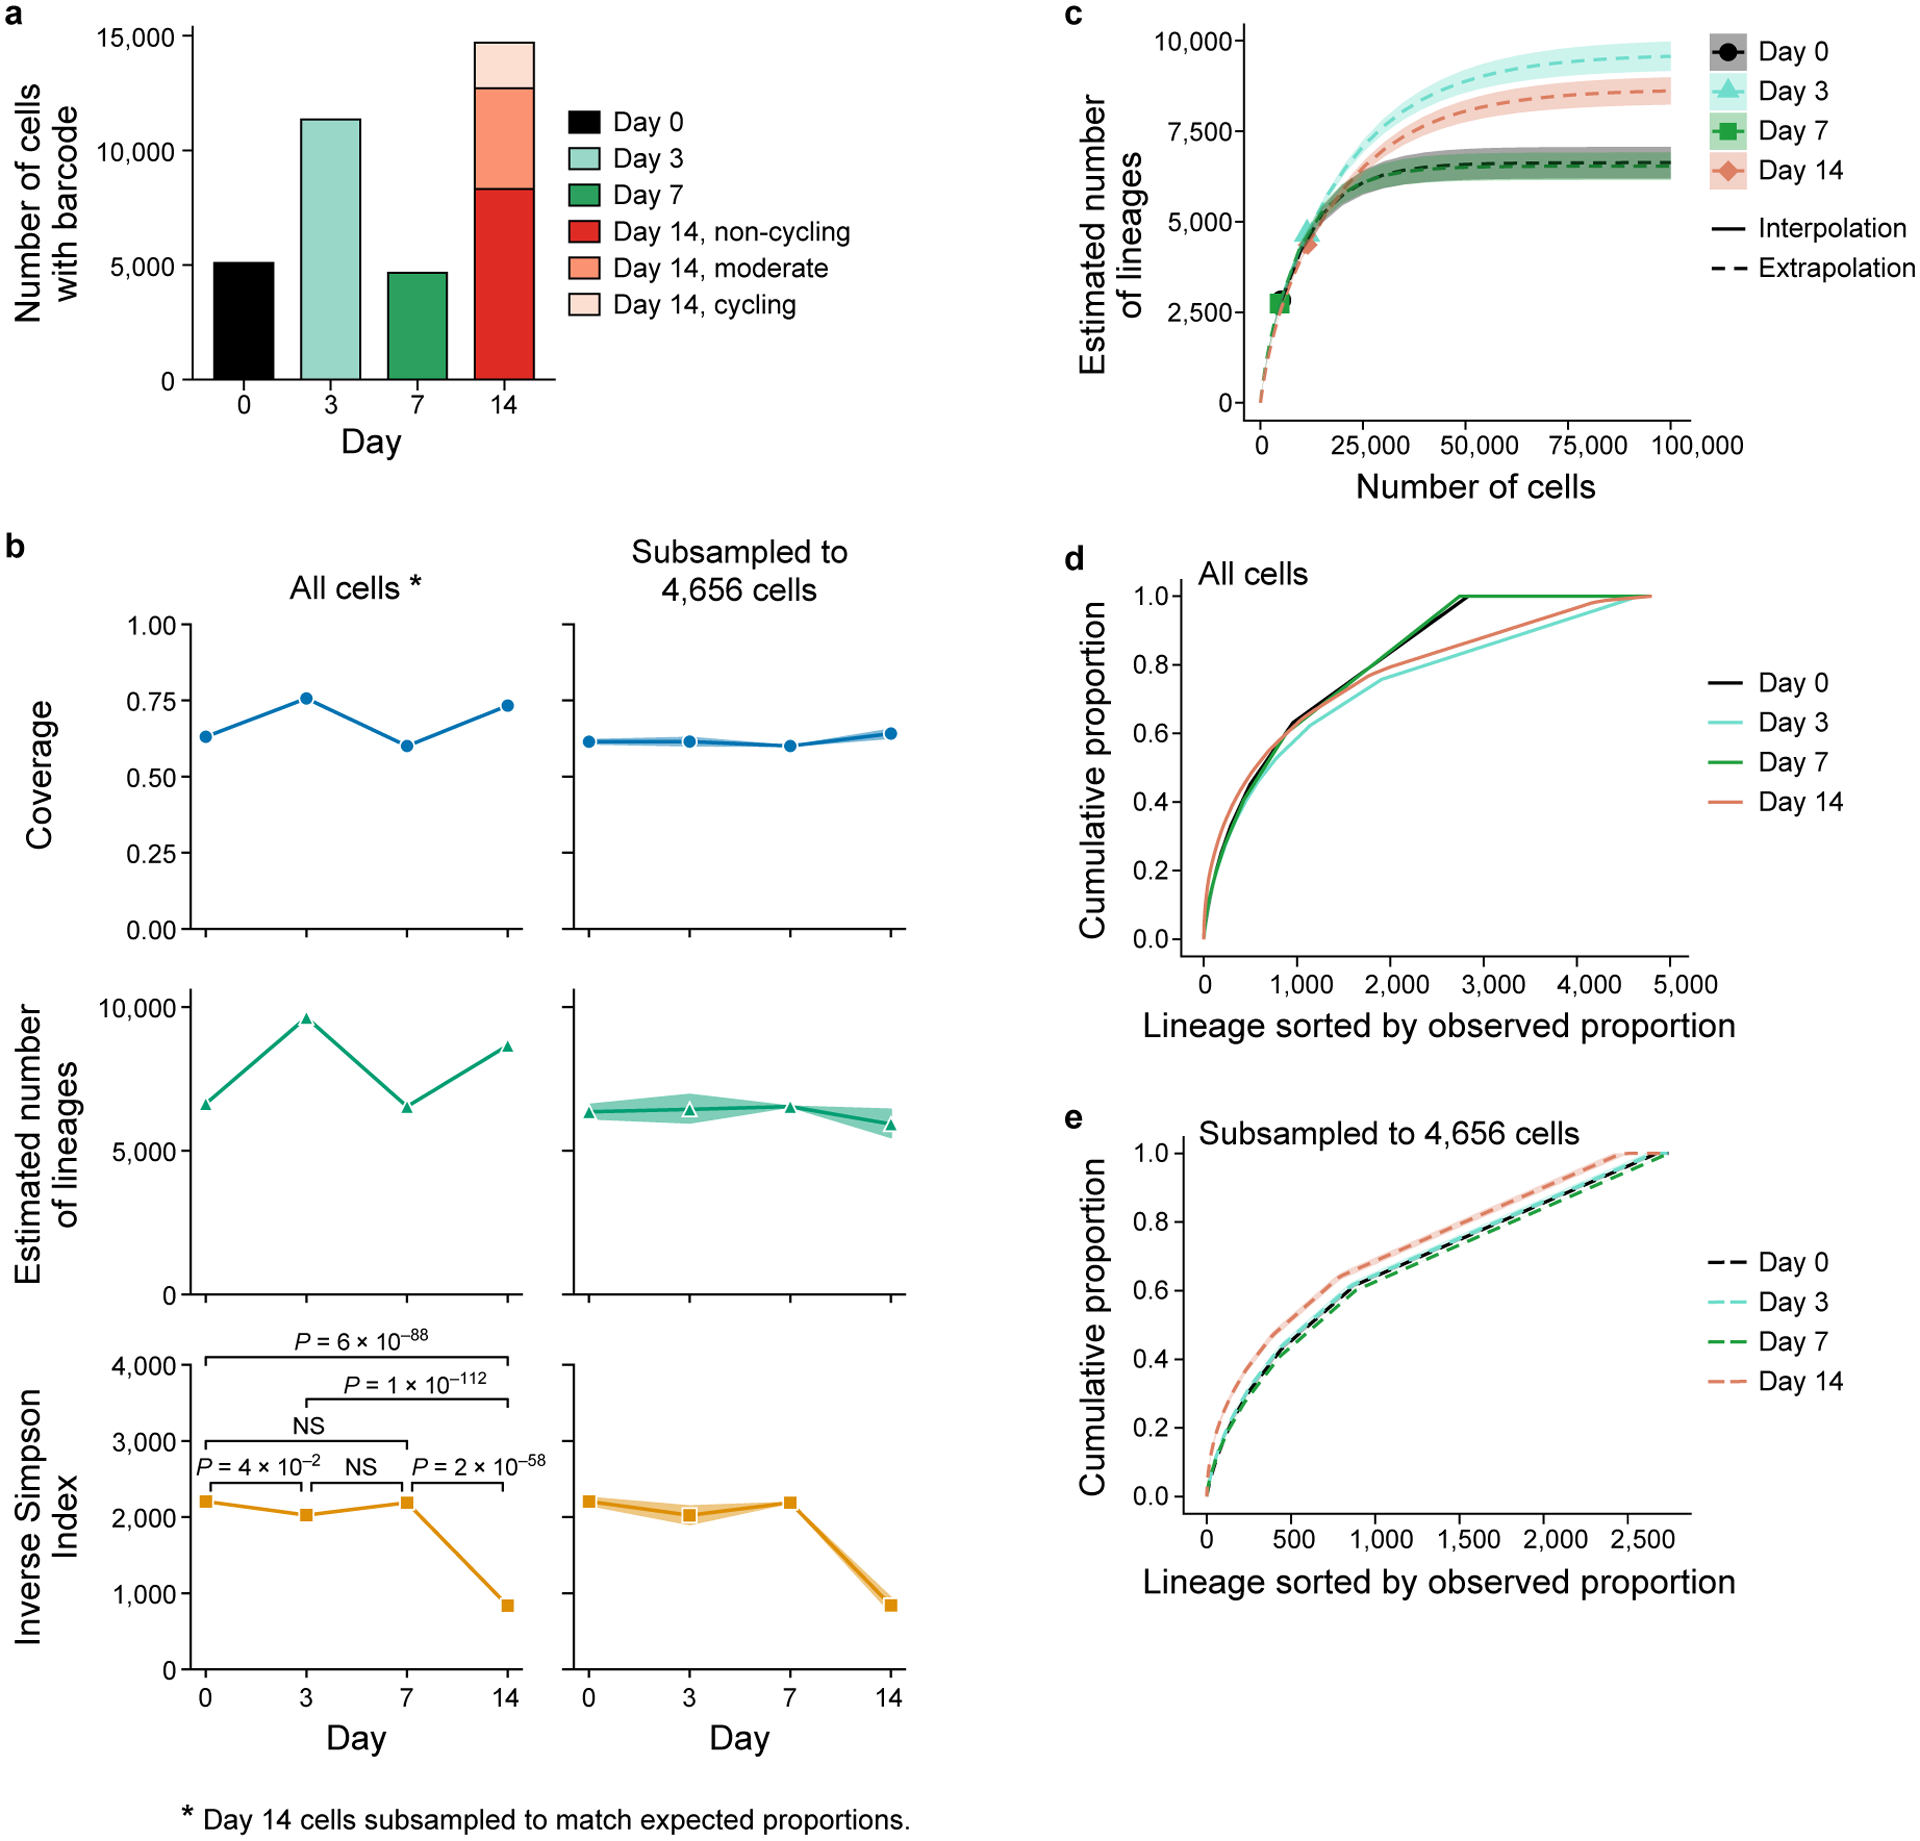
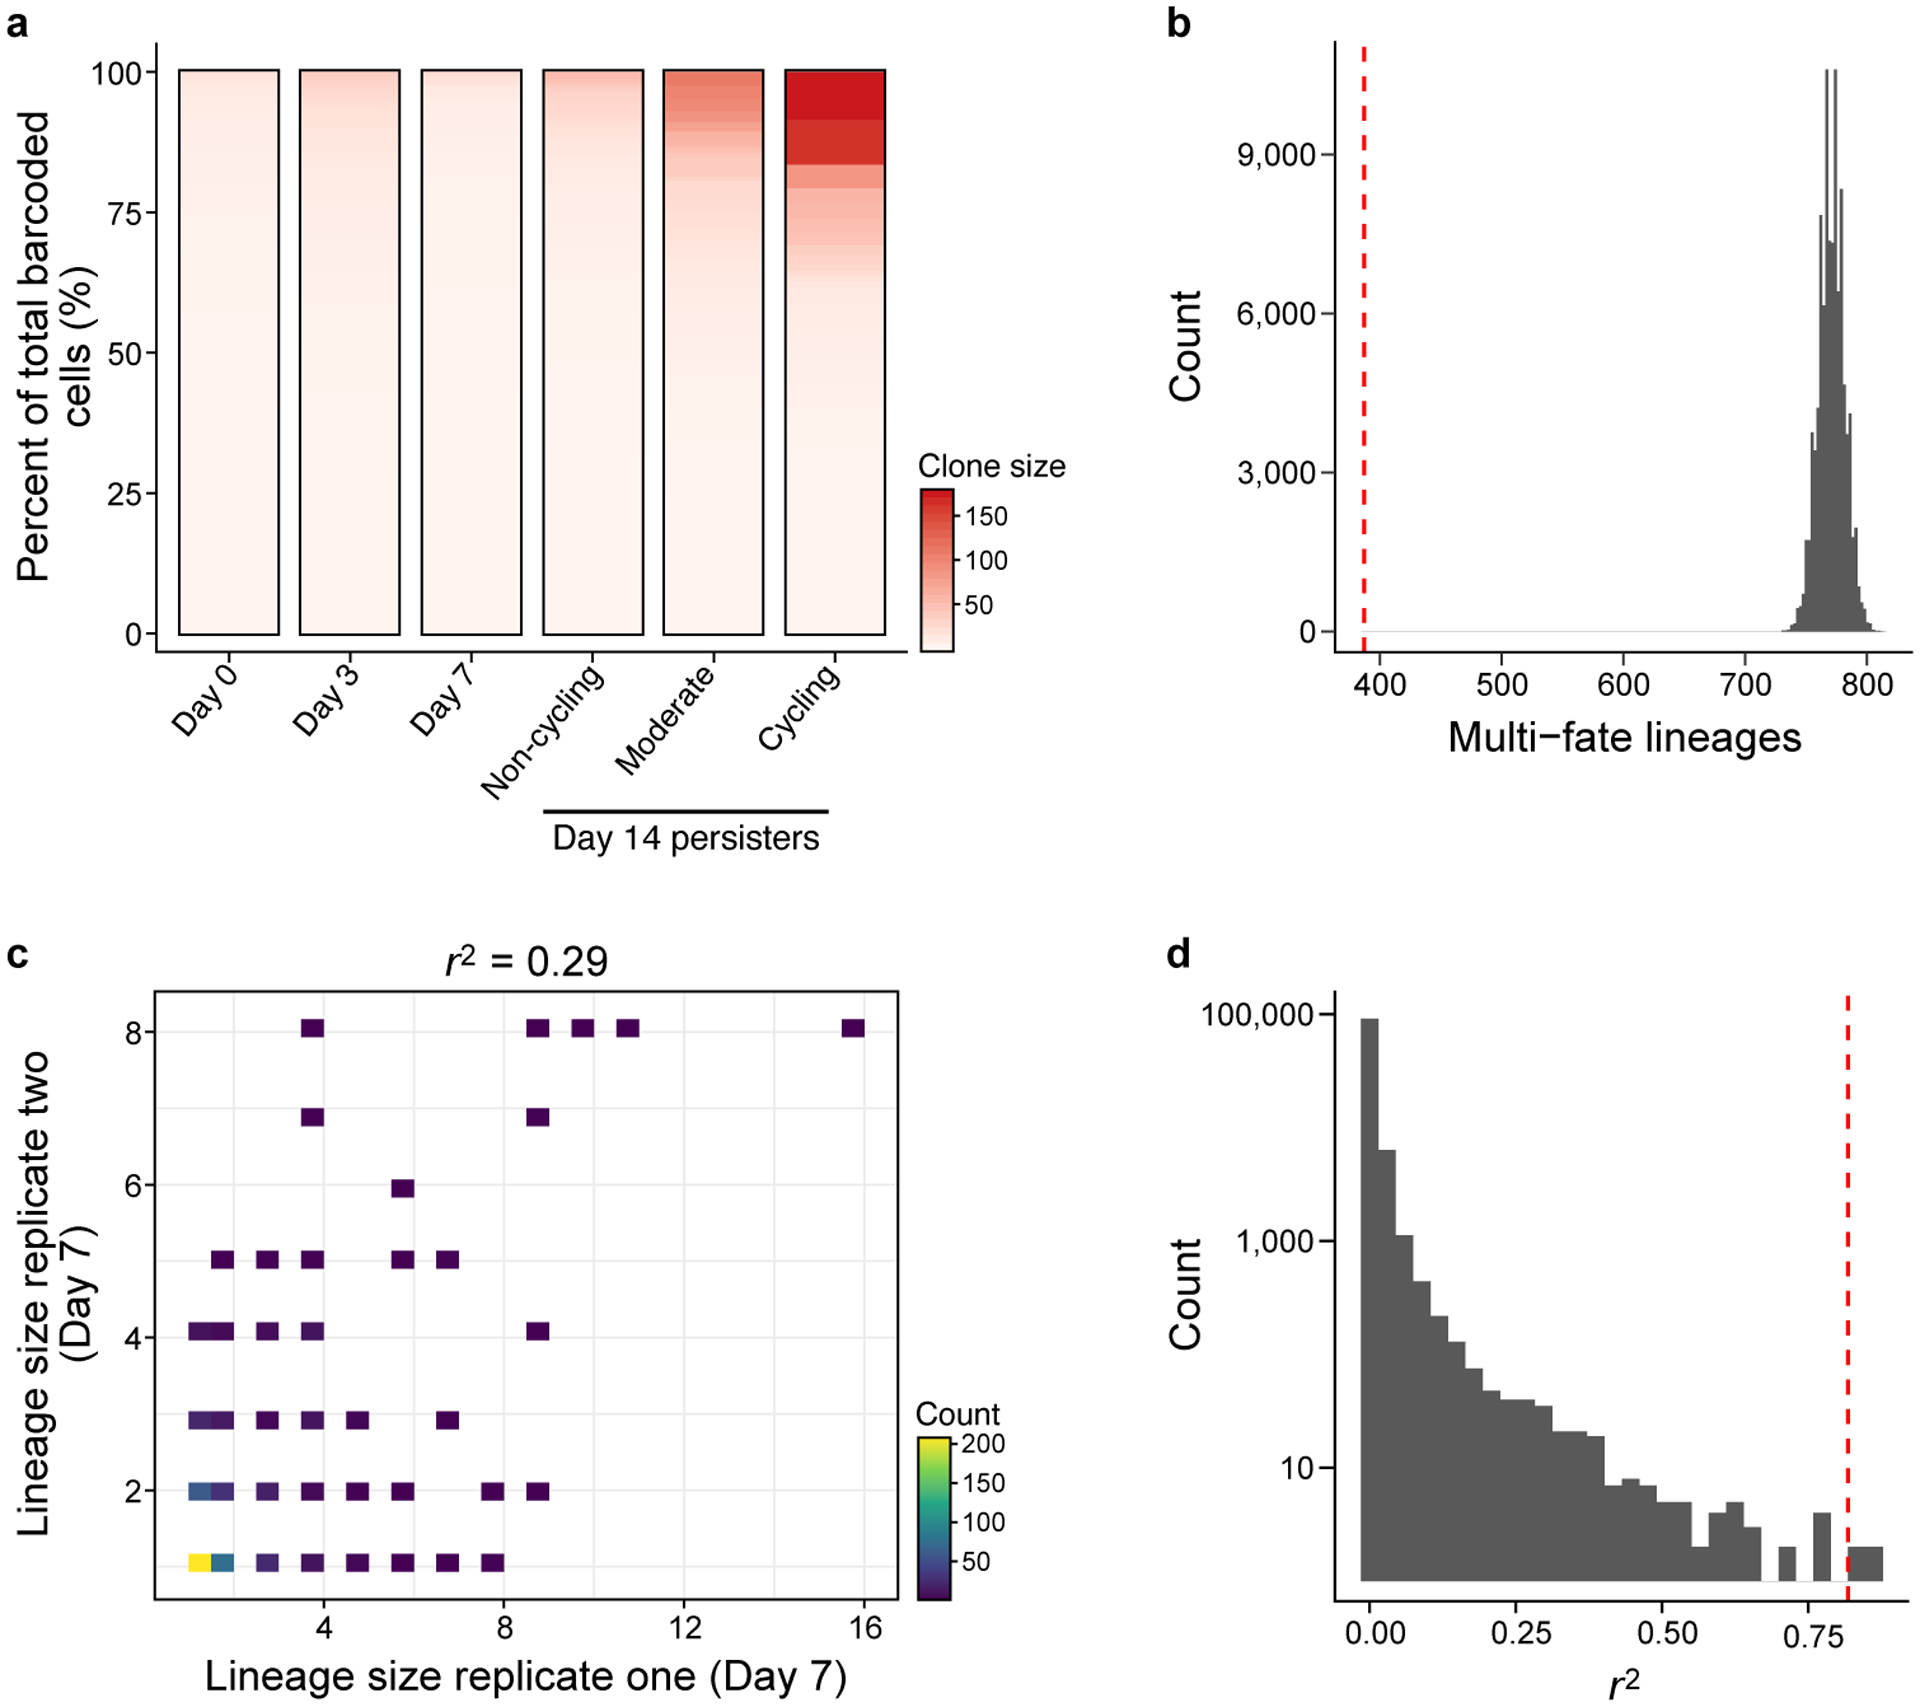
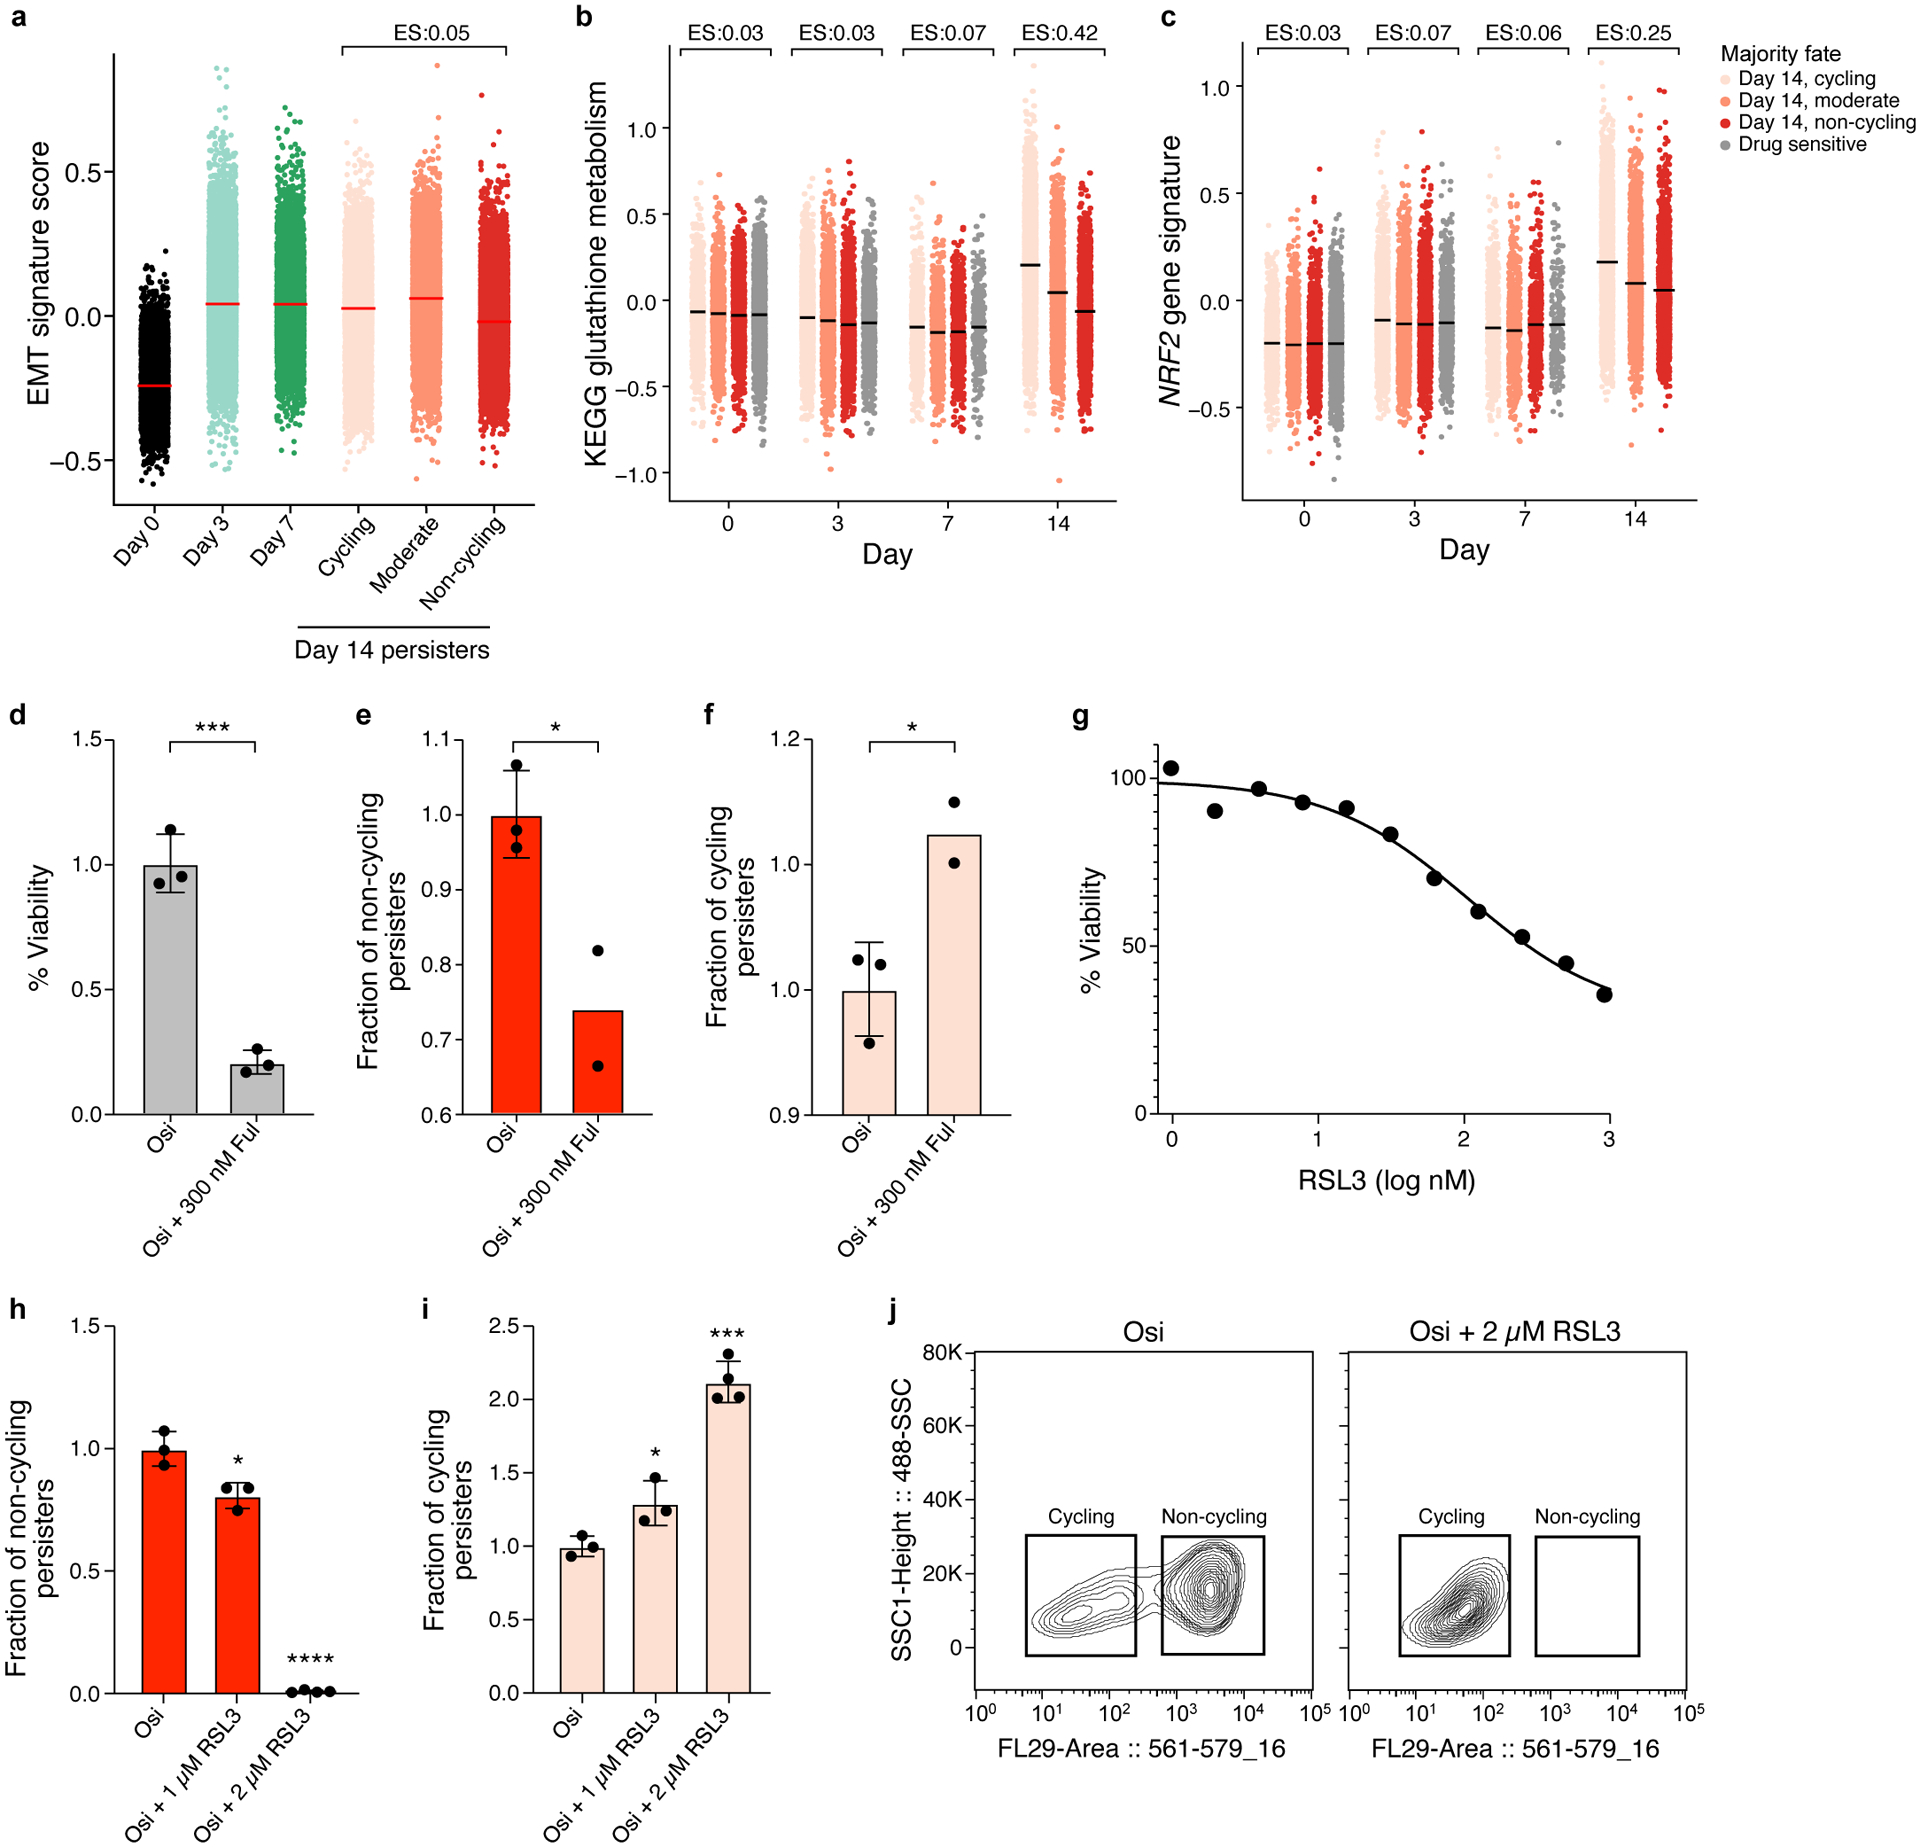
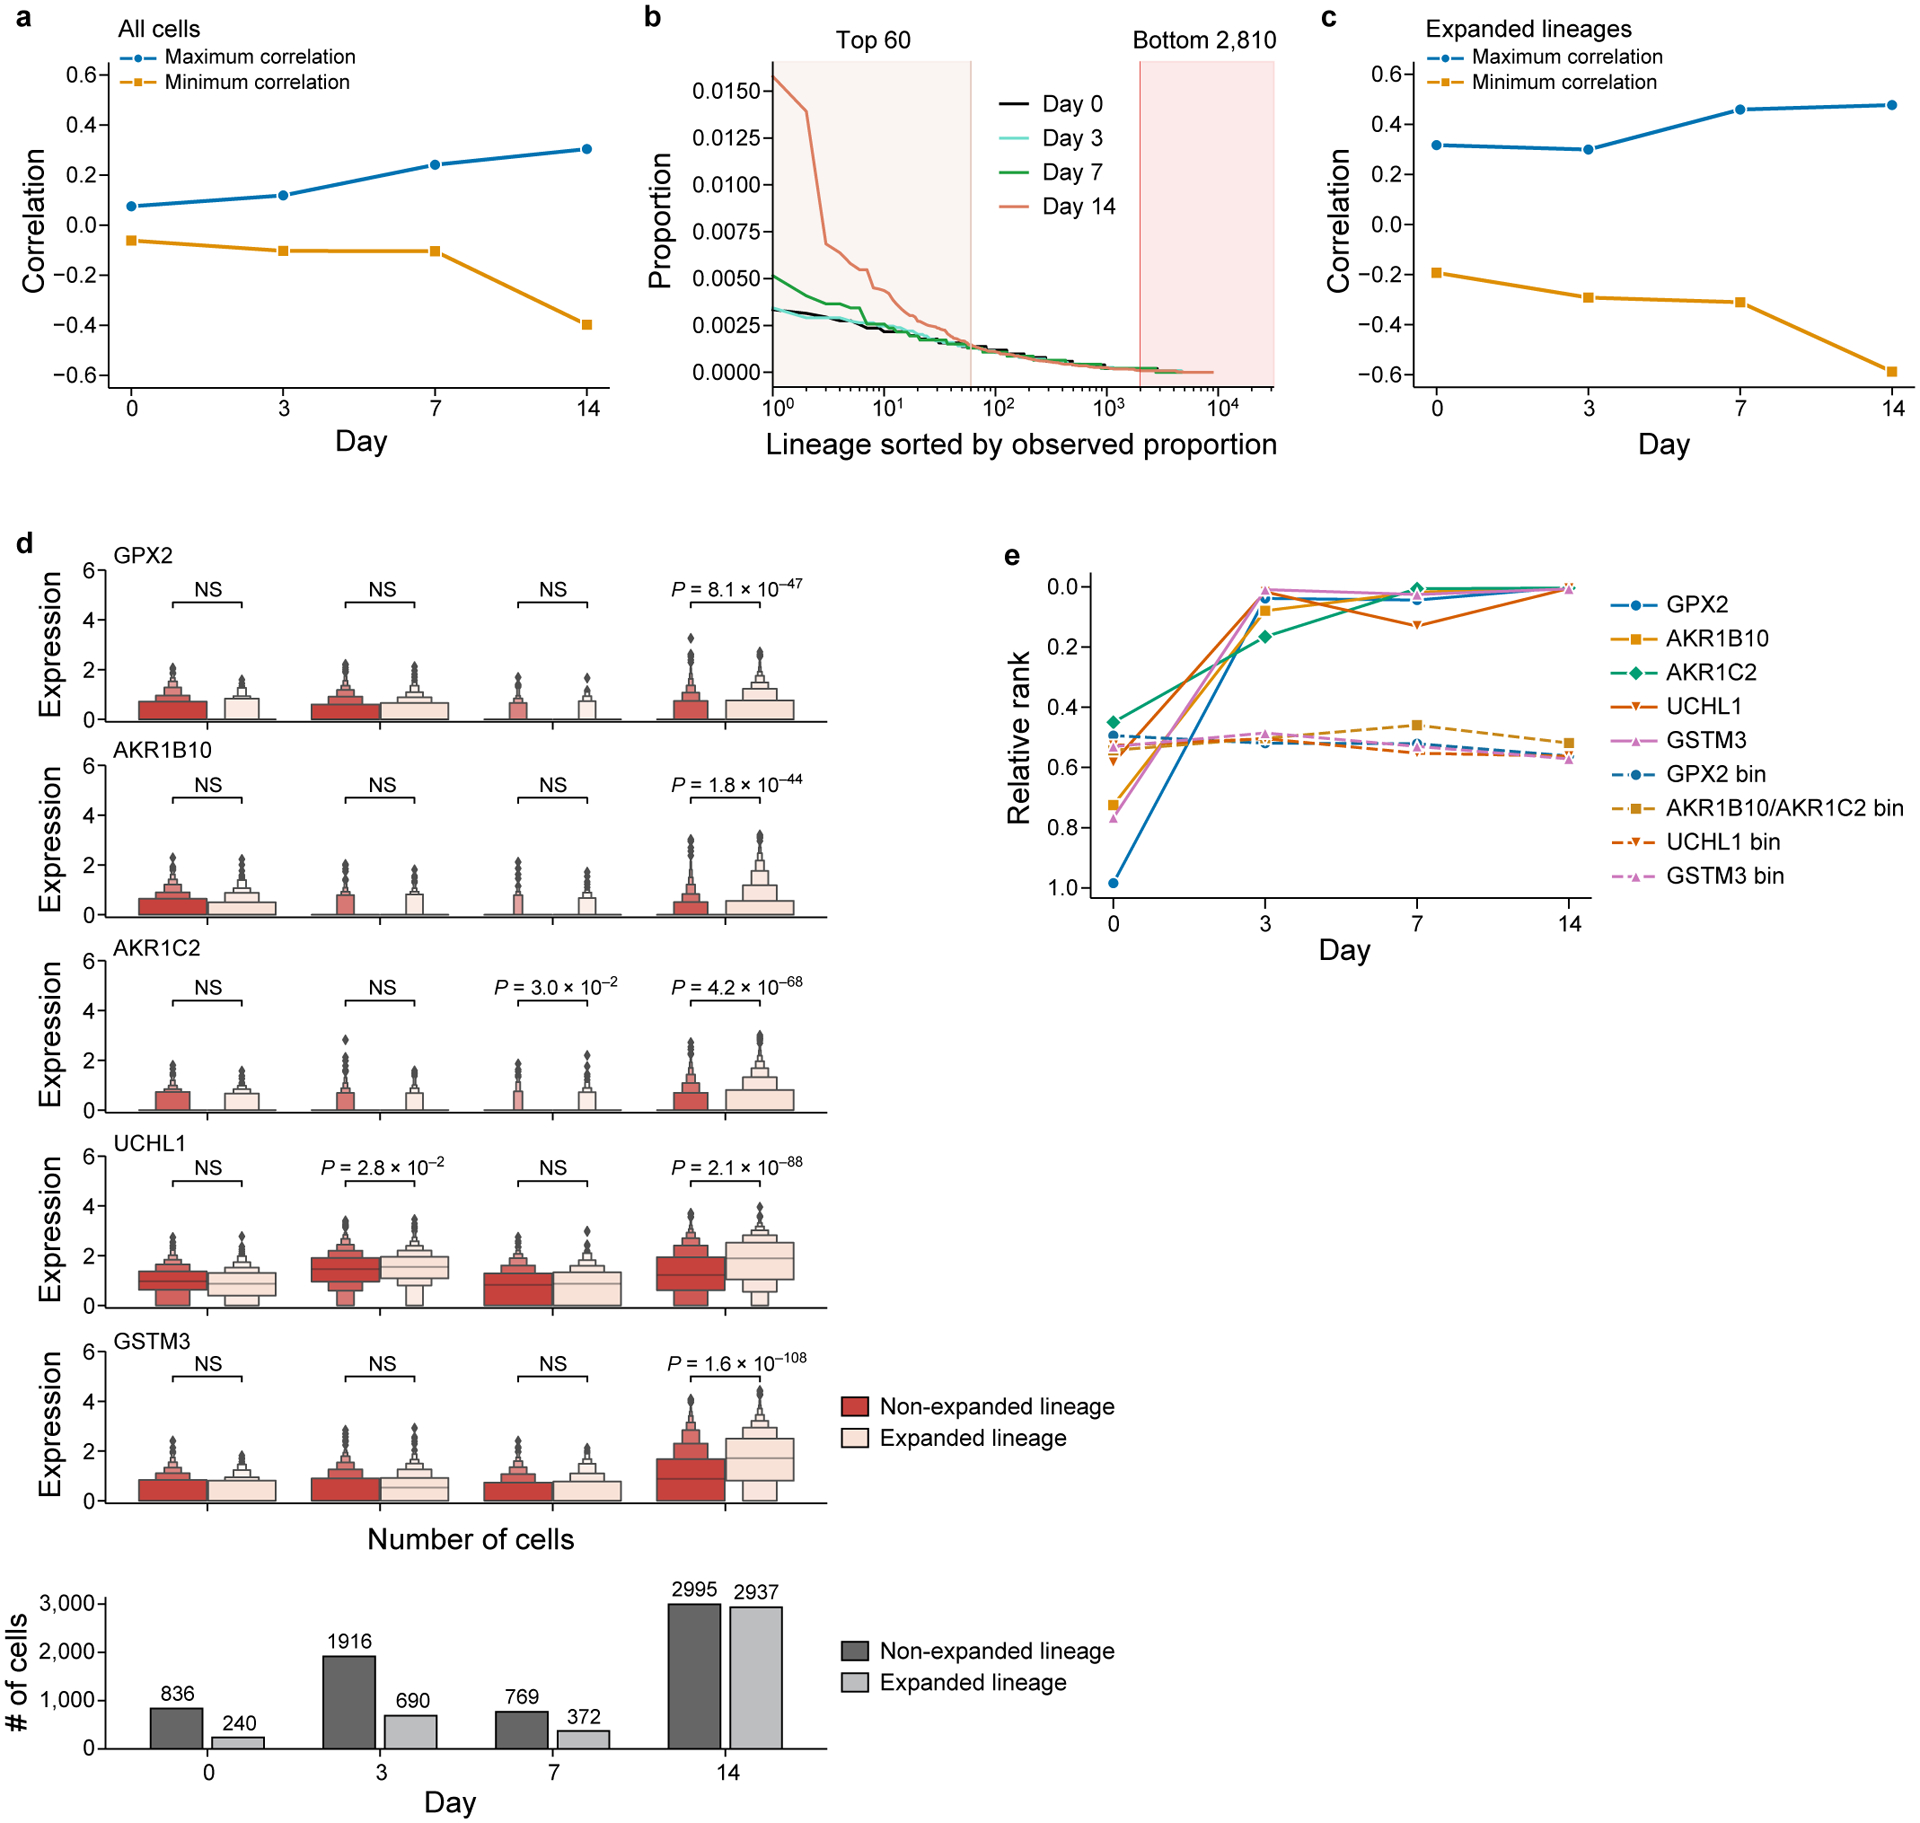
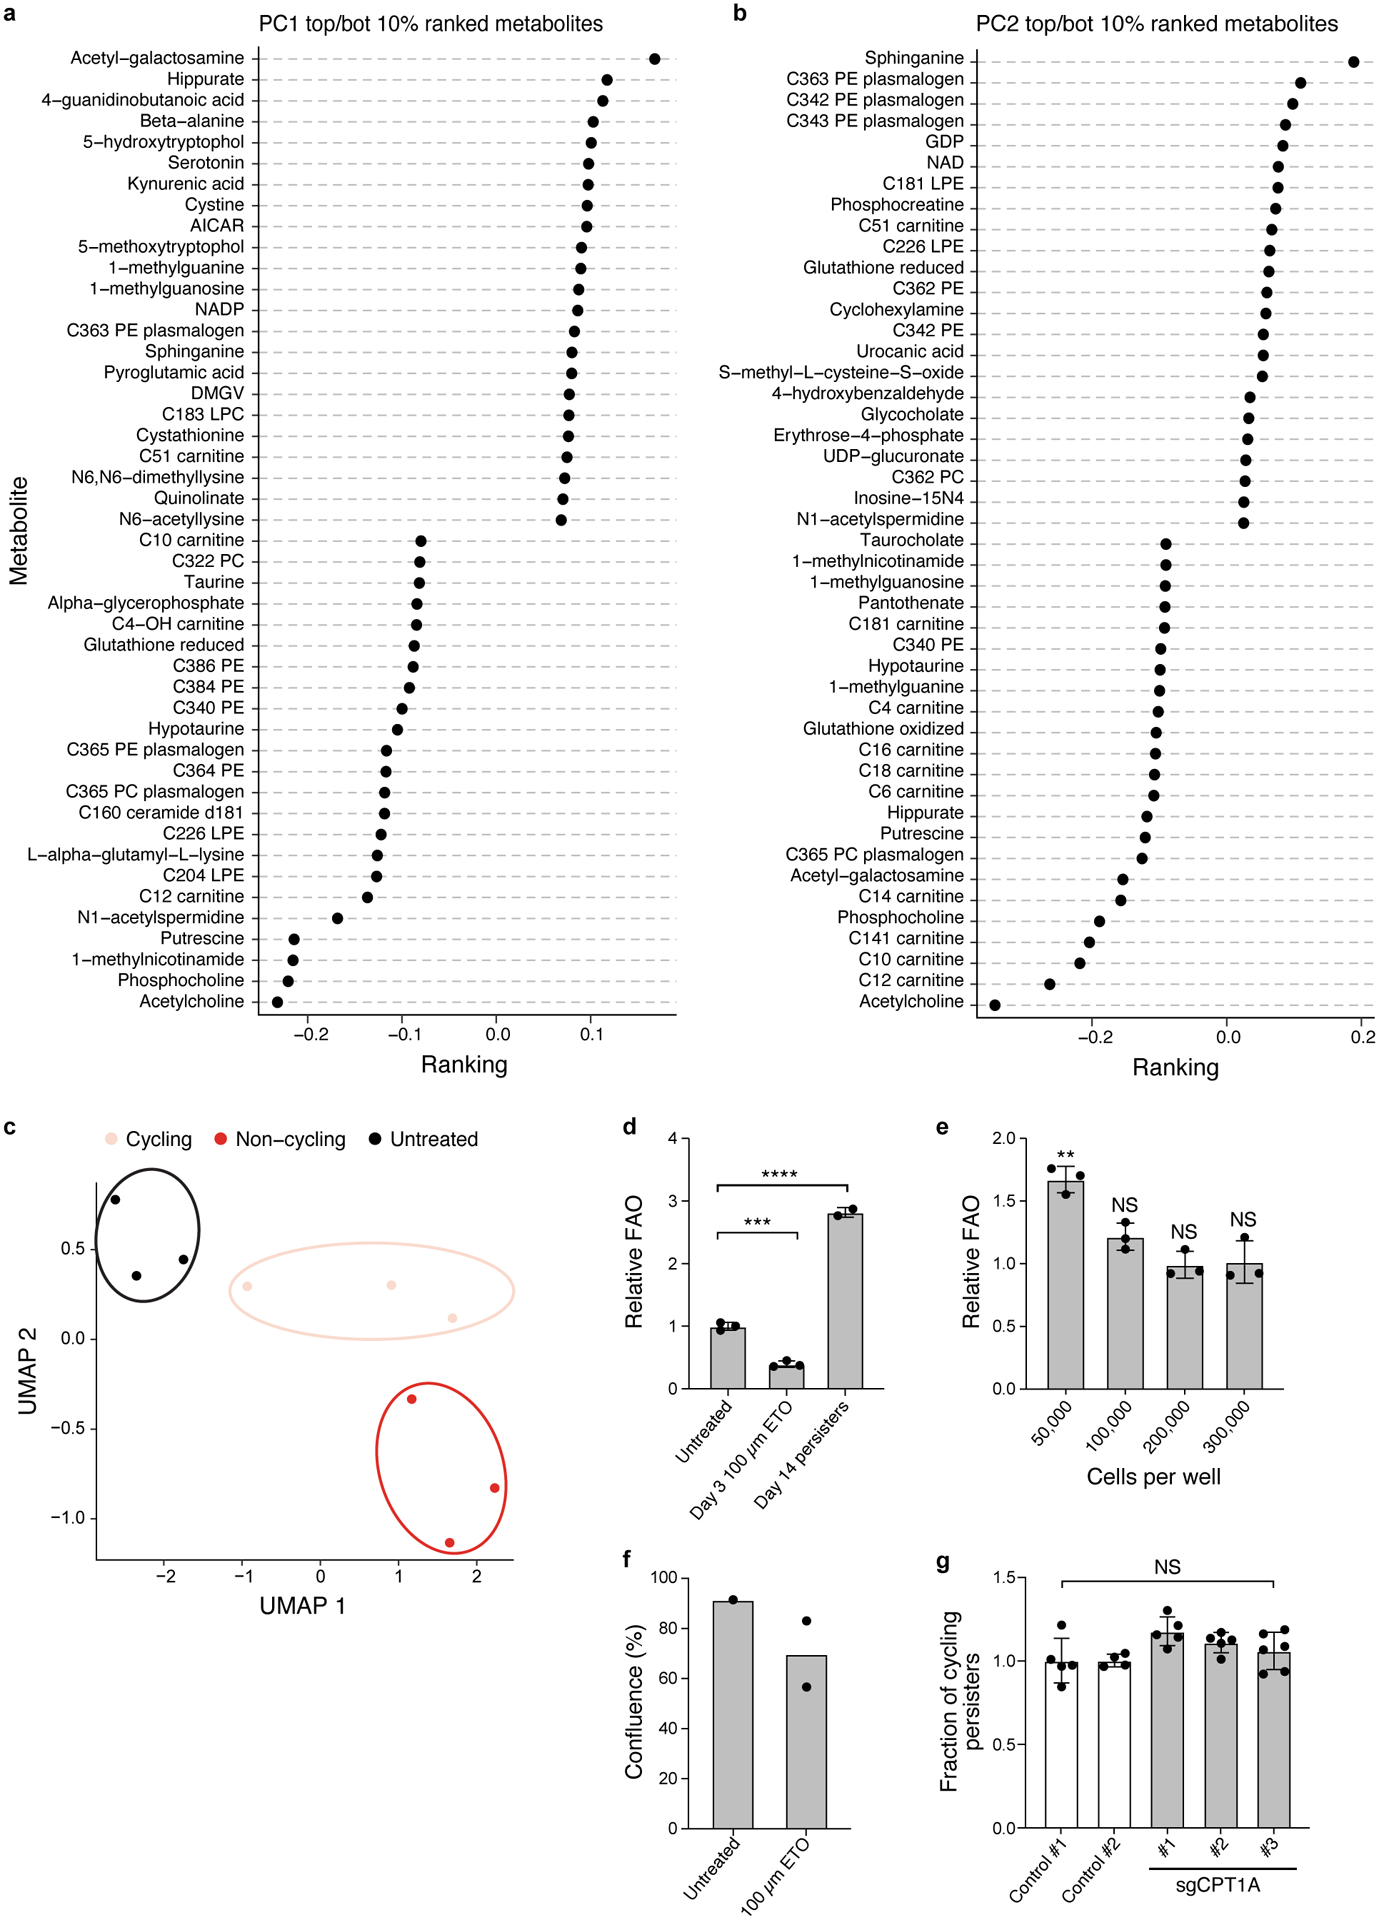
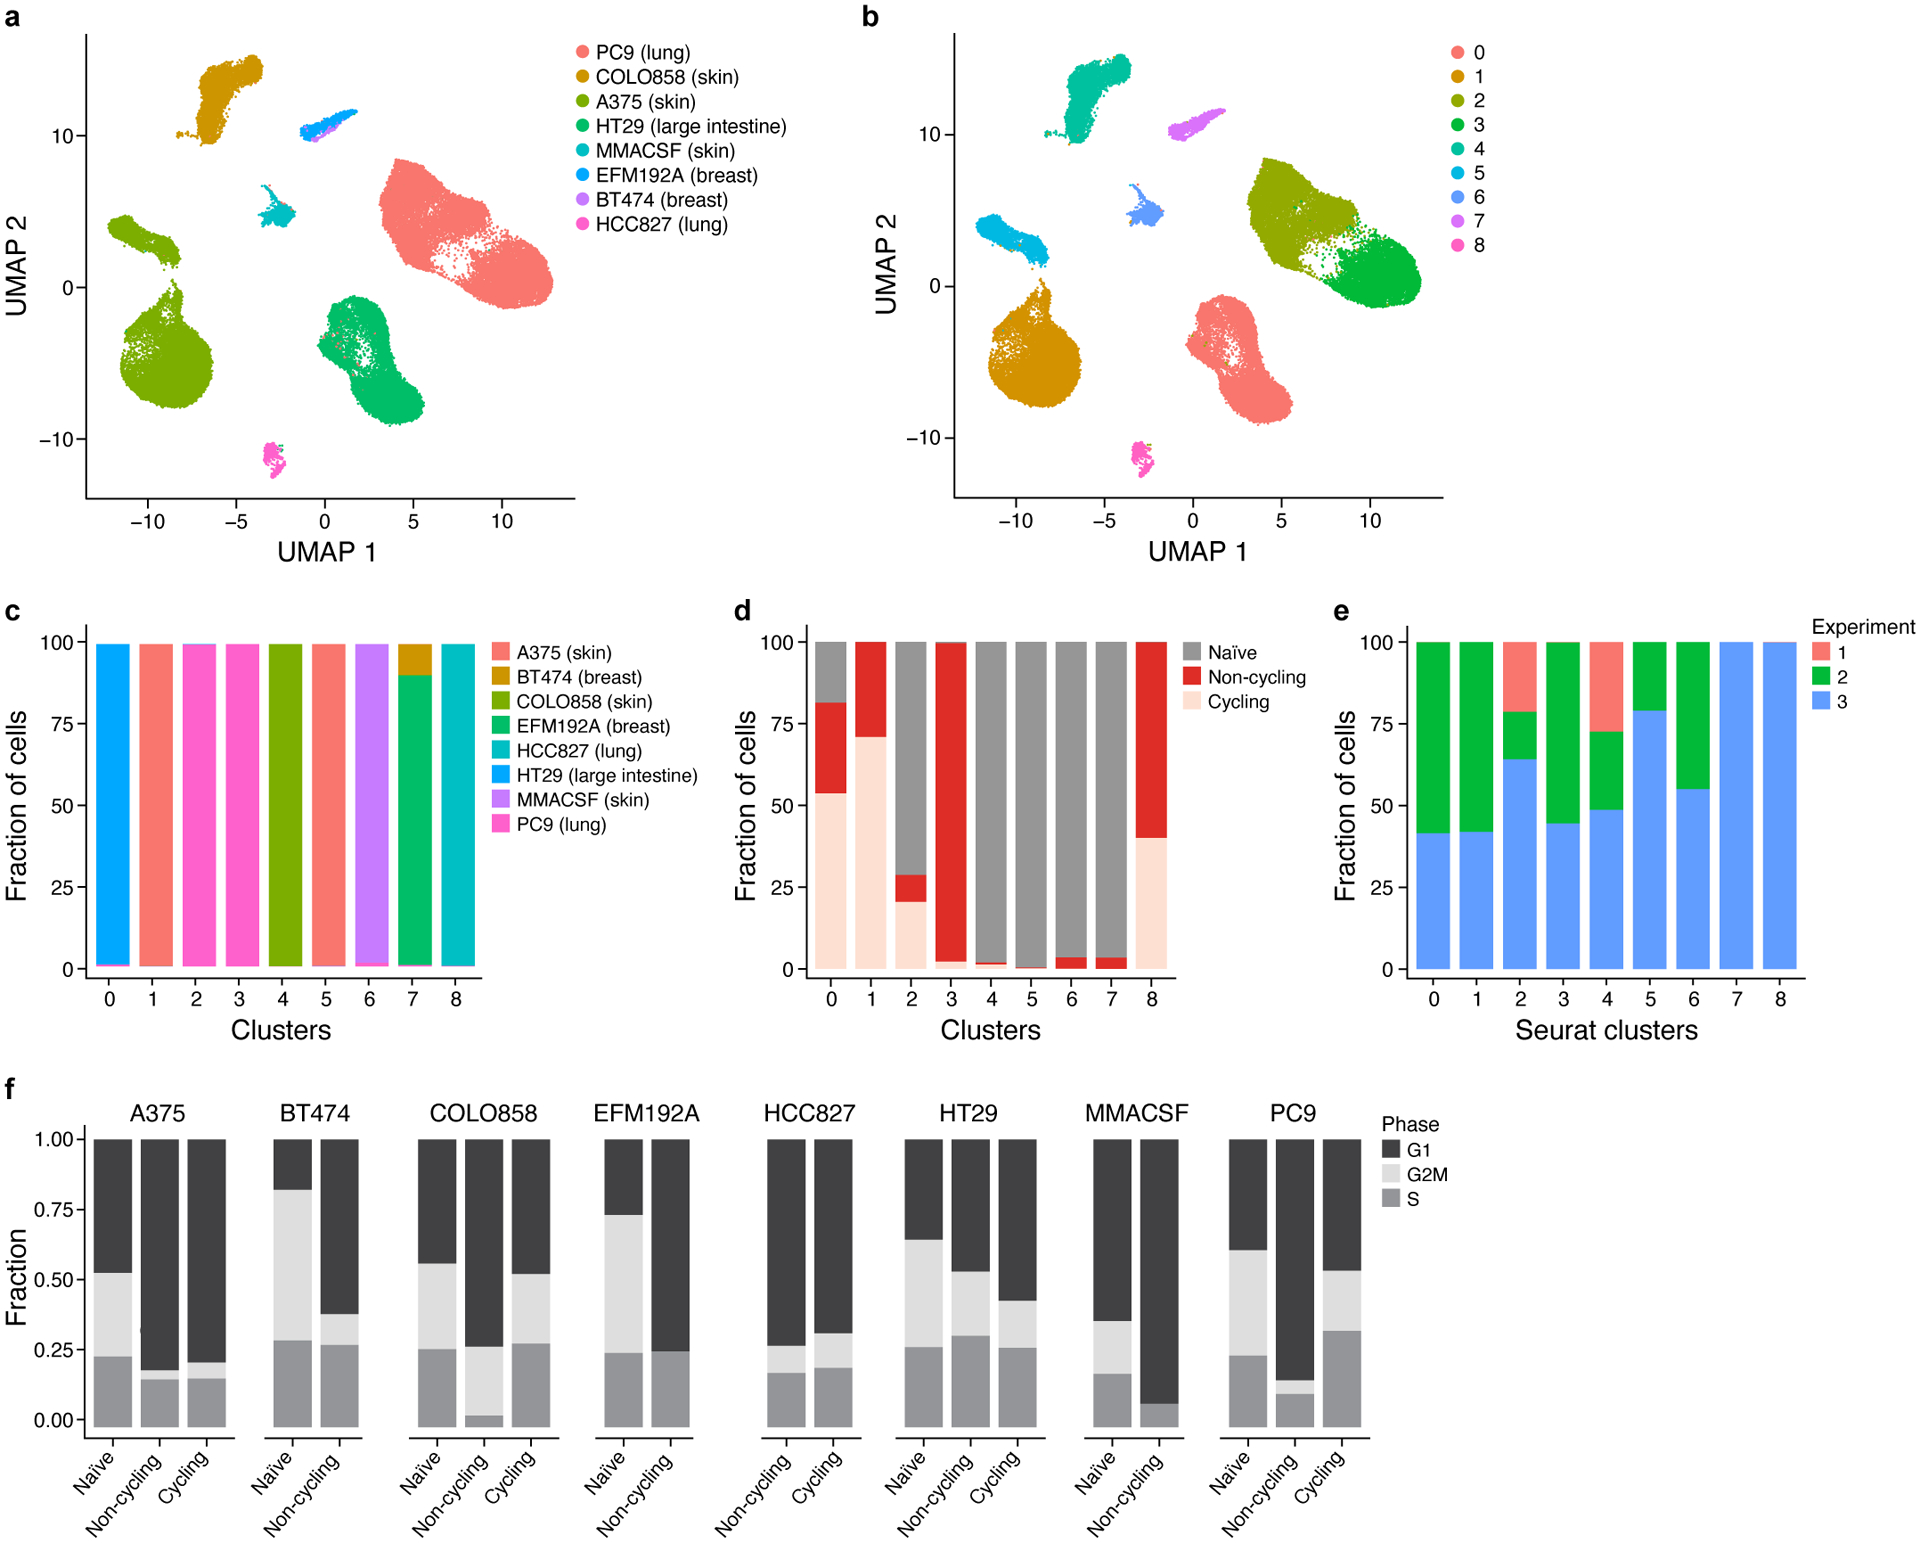
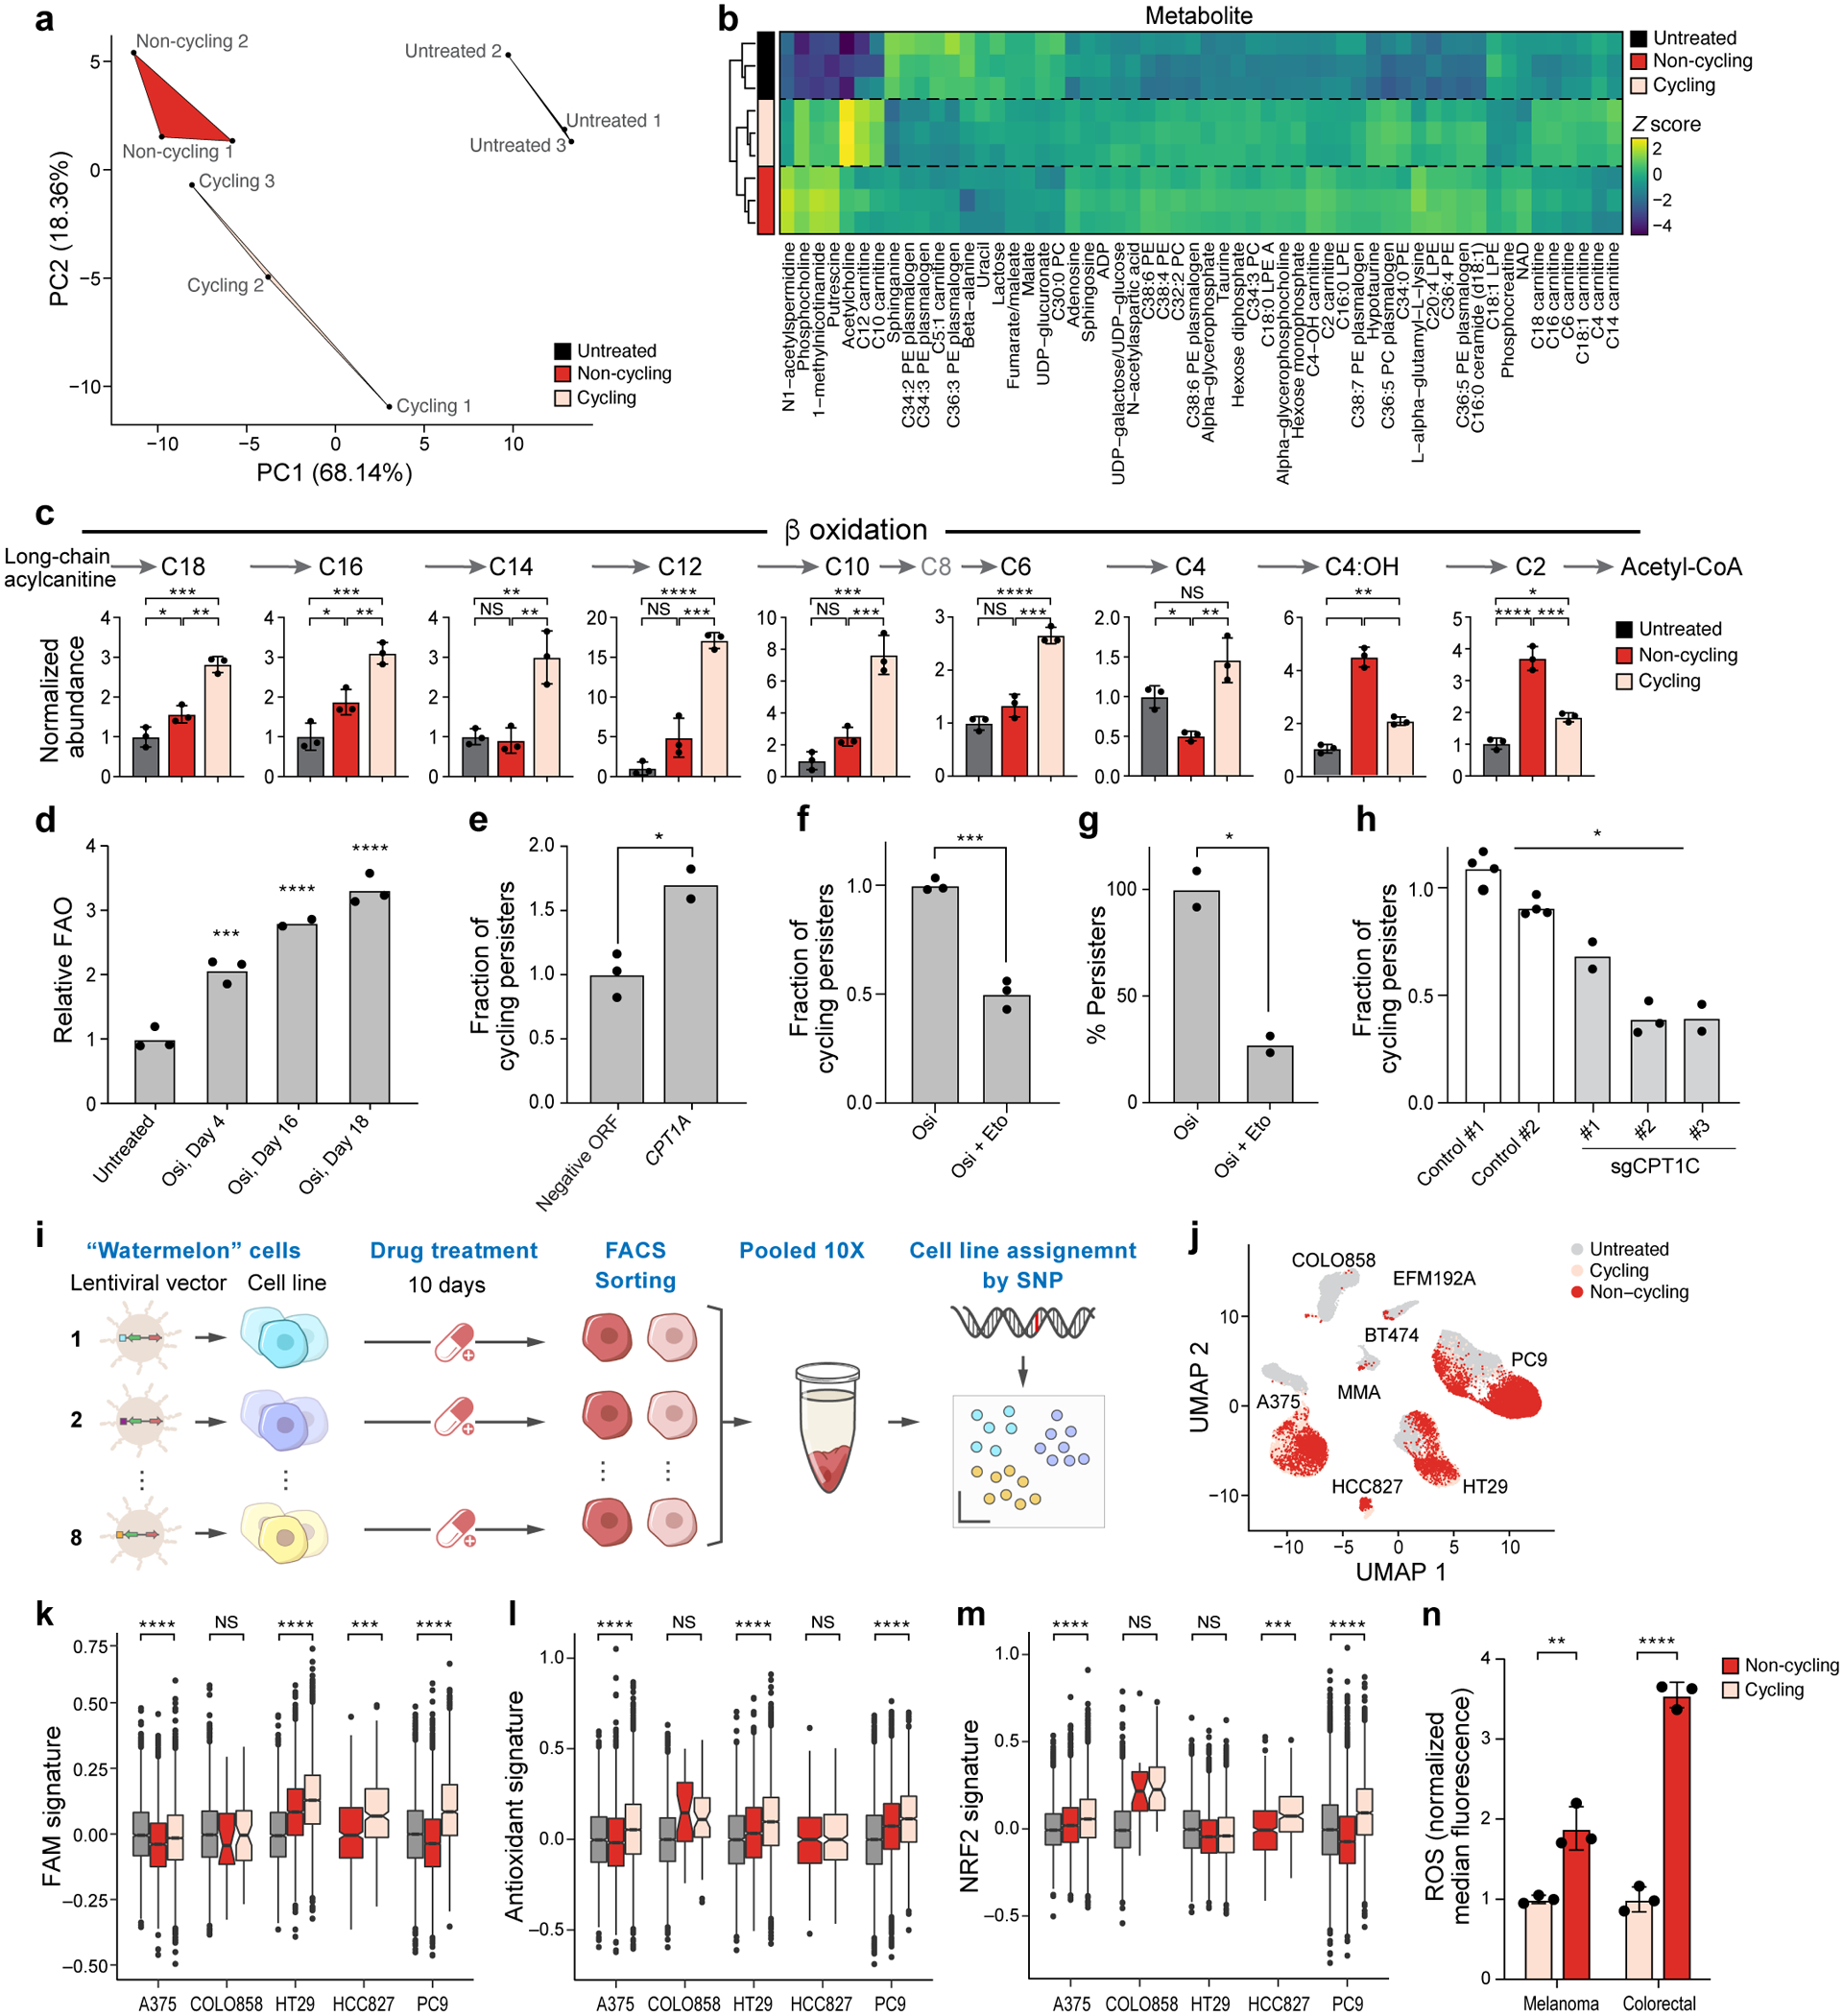
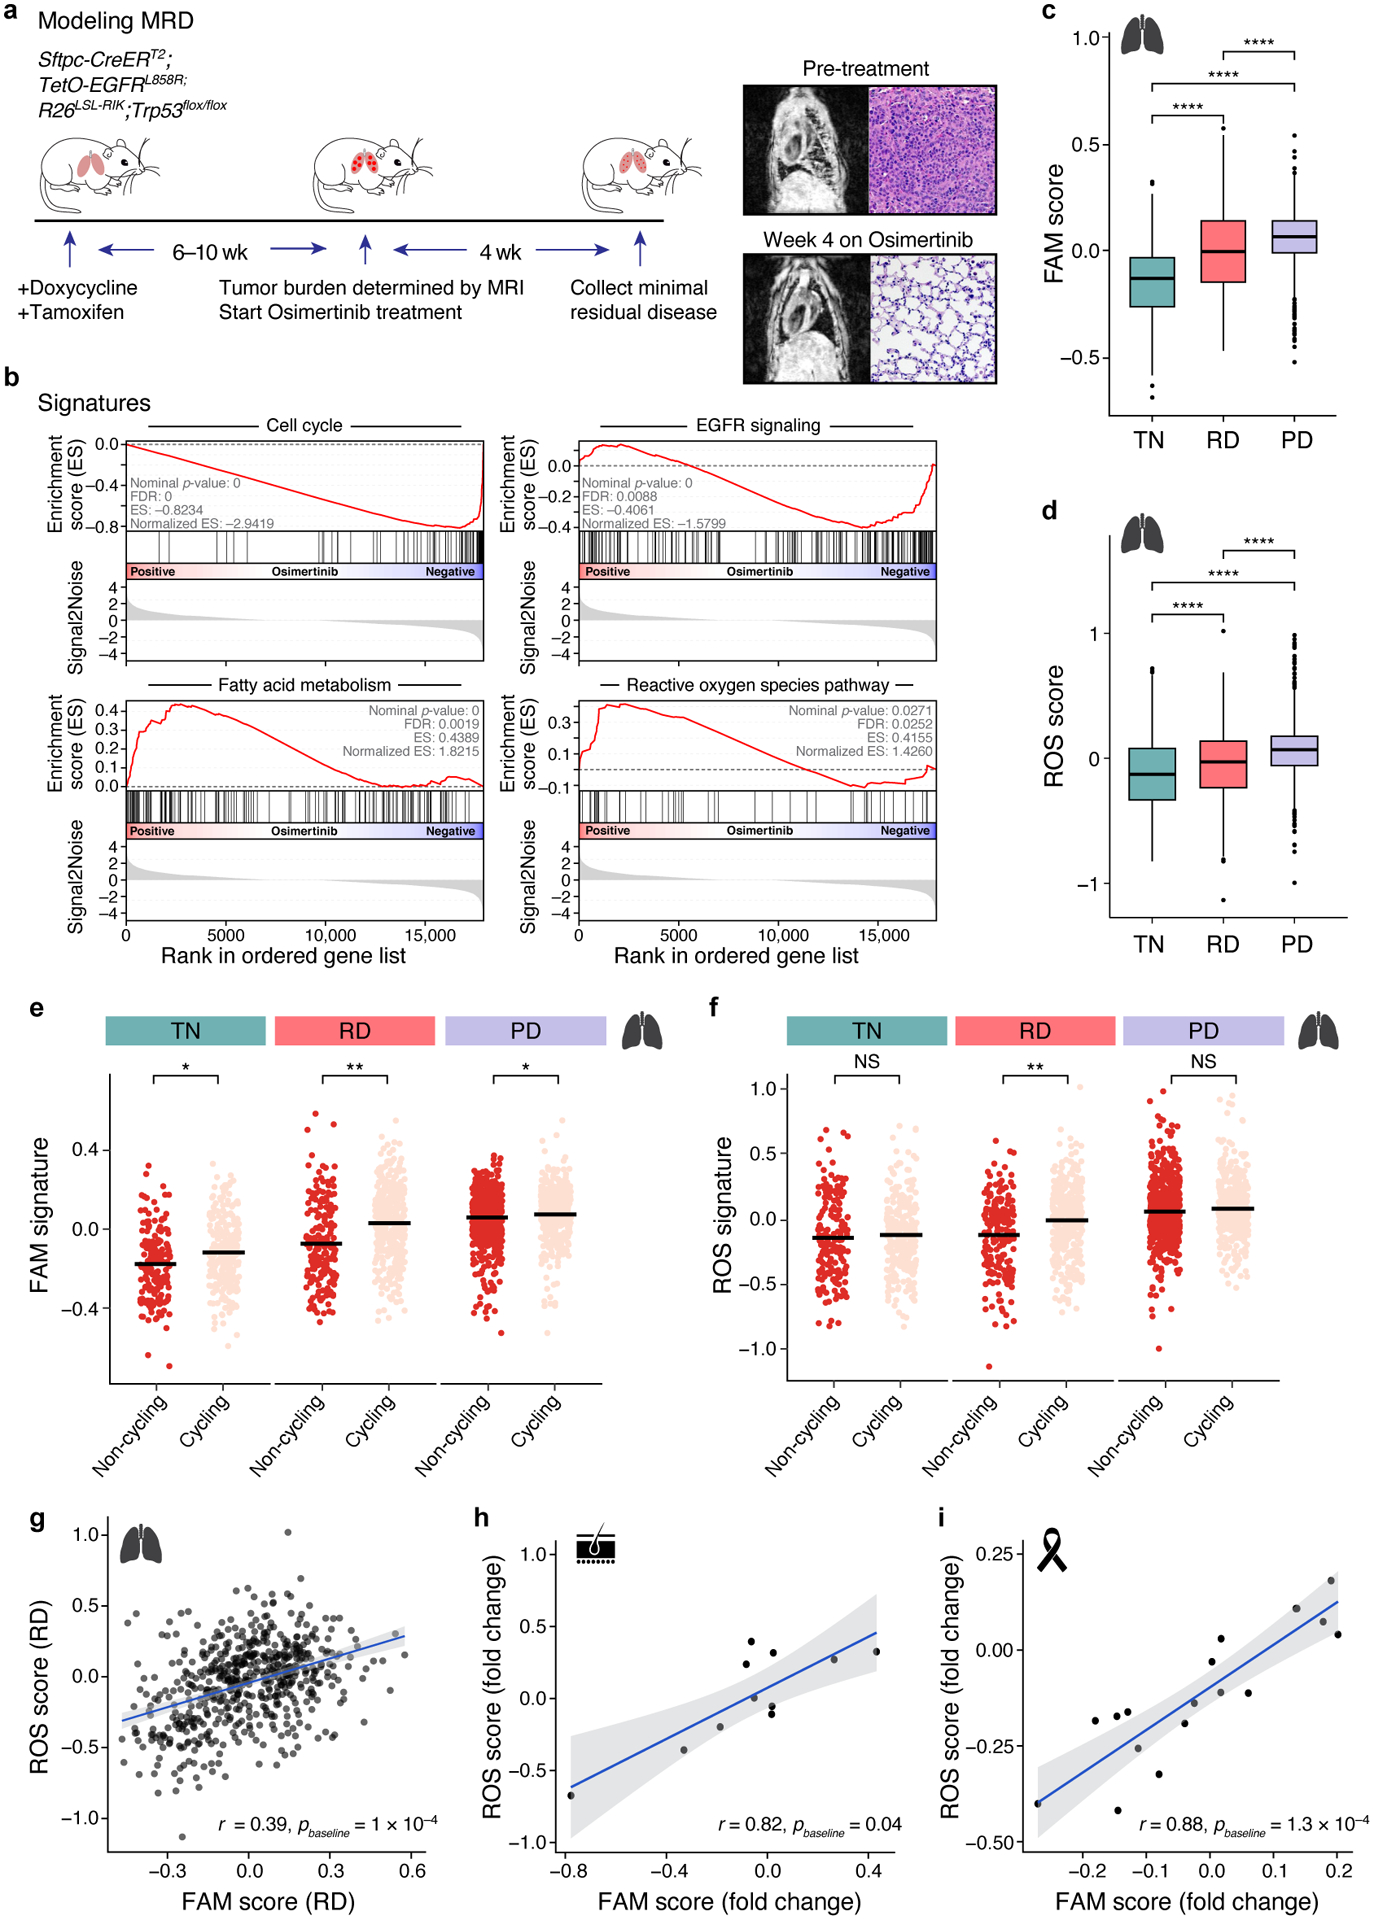
Non-genetic mechanisms have recently emerged as important drivers of cancer therapy failure1, where some cancer cells can enter a reversible drug-tolerant persister state in response to treatment2. Although most cancer persisters remain arrested in the presence of the drug, a rare subset can re-enter the cell cycle under constitutive drug treatment. Little is known about the non-genetic mechanisms that enable cancer persisters to maintain proliferative capacity in the presence of drugs. To study this rare, transiently resistant, proliferative persister population, we developed Watermelon, a high-complexity expressed barcode lentiviral library for simultaneous tracing of each cell's clonal origin and proliferative and transcriptional states. Here we show that cycling and non-cycling persisters arise from different cell lineages with distinct transcriptional and metabolic programs. Upregulation of antioxidant gene programs and a metabolic shift to fatty acid oxidation are associated with persister proliferative capacity across multiple cancer types. Impeding oxidative stress or metabolic reprogramming alters the fraction of cycling persisters. In human tumours, programs associated with cycling persisters are induced in minimal residual disease in response to multiple targeted therapies. The Watermelon system enabled the identification of rare persister lineages that are preferentially poised to proliferate under drug pressure, thus exposing new vulnerabilities that can be targeted to delay or even prevent disease recurrence.


Figures

Extended Data Figure 1.
Extended Data Figure 1.. Lineage detection efficacy and fluorescent dilution capacity of the Watermelon library
a. Viability of PC9 cells treated osimertinib. % of viable PC9 cells (y axis) after 72hr of treatment with osimertinib at different concentrations (x axis). b. Schematic of tracking. (1). Tracking of non-persister cells. Red arrows: cell that was tracked in the lineage. (2). Tracking of persister cells. Colonies detected at day 14, and the time lapse is viewed and tracked from day 14 backward to day 0 to detect the common initiator cell. After the initiator cell is detected, this initiator is tracked forward as in a (red line indicates the tracked cell). c. Watermelon library complexity. Distribution of number of unique lineage barcodes (y axis, red bars) in a Watermelon plasmid library sequenced at a depth of ~68×106 reads. Blue curve: cumulative wealth distribution of unique barcodes. d. Watermelon library sequence diversity. Sequence logo of nucleotide composition at each position (x axis) relative to the beginning of the barcode sequence of 5,472,944 unique lineage barcodes detected in the Watermelon library. e. PC9-Watermelon cell line grown in dox containing media. A merge of the green, red and bright field channels is shown. Scale bar 20μm. f. Fluorescence dilution of H2B-mCherry over time reports proliferative history. Distributions of mCherry fluorescence level (x axis) for n=3000 cells analyzed by flow cytometry at each time point (color legend) from cells transduced with the Watermelon vector, exposed to dox for 48 hours, sorted for red positive cells and seeded in separate wells at t=0 (Methods). Data are representative of two independent experiments.
Extended Data Figure 2.
Extended Data Figure 2.. scRNA-Seq along a time course of osimertinib treated PC9-Watermelon cells
a. Sorting strategy. Distribution of mCherry fluorescence level (x axis) in Watermelon-PC9 cells gates at day 14 of osimertinib treatment, marked by representative sorting gates using to sort three persister subpopulations: cycling, moderate cyclers and non-cycling. b. Number of high-quality cells profiled in each sample. c. Changes in expression profiles following treatment. t-stochastic neighborhood embedding (tSNE) of 56,419 PC9-Watermelon cell profiles (dots), colored (red) by the labeled time point. d. Assignment of cells to lineages by lineage barcode. Percent of cells (y axis) at each time point/subpopulation (x axis) that have a detected lineage barcode. e. Identification of cycling cells. Percent of cells (y axis) at each time point/subpopulation (x axis) that express either the G2/M or S phase signature. f. Majority fate. Clone size on day 14 (y axis) of each persister lineage barcode inferred from scRNA-seq ordered by ascending rank order (x axis) and colored by majority fate based on flow sample provenance of the captured cells.
Extended Data Figure 3.
Extended Data Figure 3.. Estimates of lineage diversity.
a. Difference in number of cells profiled per timepoint. Number of cells (y axis) with captured lineage barcode at each day (x axis). Day 14 cells are partitioned by the three mCherry populations (legend). b-e. Species diversity estimators can be biased by coverage. Estimated sample coverage (cumulative proportion of all lineages in the total population that were observed, top, y axis, Methods), estimated number of lineages in the population (middle, y axis, Methods), and estimated inverse Simpson Index, also known as Hill number of order 2 (bottom, y axis, Methods) at each timepoint (x axis), computed from all cells with barcodes (left) or subsampled without replacement to match the smallest number of cells per timepoint, 4,656 cells on day 7 (right). Confidence bands (shaded area) indicate the empirical pointwise 95% coverage confidence interval over 1,000 subsampling repetitions. Since standard species richness estimators are not suited for the analysis of estimated proportions from stratified sampling, we randomly subsampled 8,320, 1,949, and 1,276 day 14 cells without replacement from the cycling and moderate cyclers and non-cycling population, respectively (left panel, for unsorted population proportions see Extended Data Fig. 2a). P-values obtained by (asymptotic) two-sided Welch’s t-test with bootstrap estimated standard errors, Holm-corrected with level 5% (Methods, n = 5,087, day 0, n = 11,348, day 3, n = 4,656, day 7, n = 11,545, day 14 subsampled) c. Alternative estimates of number of lineages with rarefaction. Rarefaction curves for the expected observed number of different lineages (y axis) at varying hypothetical sample sizes (x axis) for each timepoint (colored lines). Actual number of observed lineages: marker; Interpolated results: solid lines; Extrapolation beyond the observed number: dashed lines. Day 14 cells were subsampled as done for the estimation of the number of lineages in the right-hand side panels of (b). Shaded areas: confidence bands at 95% confidence level. d,e. Estimated cumulative proportion (eCDF) of lineages in the total population (y axis) sorted in decreasing order of estimated lineage proportion (x axis) for each timepoint (colored lines) when estimating the proportion from all sequenced cells with barcodes (d) or subsampled to 4,656 cells (e) as in (b). Subsampling (b,e) and rarefaction (c) facilitate comparison between different timepoints since estimators of population diversity are strongly biased by sample size. Confidence bands indicate the empirical pointwise 95% coverage confidence interval over 1000 repetitions of the subsampling.
Extended Data Figure 4.
Extended Data Figure 4.. Lineage fate analysis
a. Single cell-derived clone size by sample. In each sample, detected barcodes were sorted in descending order by the sum of their counts. Each unique lineage barcode was accounted as a separate clone. b. The number of observed multi-fate lineages is significantly smaller (P = 1×10⁻⁵) than expected by chance. Distribution of the number of multi-fate lineages (x axis) in simulated data. Red line: observed number of multi-fate lineages. c,d. Clone size reproducibility is significantly higher than expected by chance. c. Clone size on day 7 of each persister lineage barcode inferred from scRNA-seq (x, y axes) in each of two independent experiments seeded from the same barcoded founding cell population. Top: linear correlation coefficient. d. Distribution of r2 values (x axis) in simulated day 14 data. Red line: observed r2 between the two replicates at day 14.
Extended Data Figure 5.
Extended Data Figure 5.. Differences in transcriptional programs and drug response in cycling and non-cycling persisters
a. EMT signature expression are similar in cycling and non-cycling persisters. Distribution of expression levels of EMT (y axis, log2(TPM+1)) across time points and subpopulations. Effect size (ES, b): difference between the mean signature score of cycling and non-cycling persisters. b-d. Persister populations show differential sensitivity to fulvestrant. Effect of fulvestrant co-treatment (300nM fulvestrant during days 14–20 of 300nM osimertinib) on overall survival (b) non-cycling (c) and cycling cells (d). e-g. Persister populations show differential sensitivity to RSL3. Effect of different doses of RSL3 co-treatment (during days 3–14 of 300nM osimertinib) on overall survival (e) non-cycling (f) and cycling cells (g). h. Co-treatment with 2 μM of RSL3 shifts surviving persister cells to cycling. Distributions of mCherry fluorescence level (x axis) for cells analyzed by flow cytometry with and without RSL3 co-treatment (panel legend). i,j. Higher expression of glutathione metabolism and NRF2 signatures in cycling vs. non-cycling persisters. Signature score (y axis) of glutathione metabolism (i) and NRF2 pathway (j) signatures in cells profiled at each time point (x axis) stratified by their lineage majority fate at day 14 (color legend). Effect size (ES) indicates difference between the mean signature score of cycling and non-cycling persisters. Error bars are mean +/− SD of two (e,f) or three biologically independent experiments (d,h-i). *P < 0.05; **P < 0.01; ***P < 0.001; ****P < 0.0001; two-tailed t-tests compared to osimertinib only condition (d-f, h-i).
Extended Data Figure 6.
Extended Data Figure 6.. Correlation between clone size at day 14 and gene expression
a. Gene expression is progressively more predictive of persister lineages over time. For each timepoint (x axis), maximum (blue) and minimum (orange) over the correlation coefficients (y axis) of each gene and the lineage size at day 14 (also see Fig. 2g). b. Choosing expanded and no-expanded lineages for gene expression comparisons. Cut-offs (vertical lines) for highly expanded and non-expanded lineages on day 14 based on the estimated proportion of each lineage in the population (y axis), sorted by decreasing proportion (x axis, log scale) for each timepoint (colored lines). c. For each timepoint (x axis), maximum (blue line) and minimum (orange line) over the correlation coefficients (y axis) of each gene and the lineage size at day 14 as in (a), but restricted to cells of highly expanded lineages as in (b). d. Genes with top correlation to lineage expansion. Top five rows: distribution of gene expression of top correlated genes (log normalized counts, y axis) at each time point (x axis), comparing cells from non-expanded (red) and expanded (pink) lineages, as defined in (b). Bottom row: numbers of cells (y axis) per timepoint in non-expanded, (dark gray) and expanded (light gray) lineages. Distributions are visualized as enhanced box plots indicating median (gray bar) and geometric progression of quantiles (progressively decreasing box widths for 75th, 87.5th, 93.75th, 96.875th, etc. percentiles, and analogously for 25th, 12.5th, 6.25th, 3.125th, etc. percentiles, labeling up to 1.5625% of the data as outliers). Bonferroni-Holm adjusted P values, determined by a two-sided Mann–Whitney U-test with continuity correction, or no significance (NS, P > 5%). e. Increase in correlation of top correlated genes as early as day 3. For each timepoint (x axis), rank of selected genes’ (colored solid lines) correlation with the lineage size at Day 14 among all genes (y axis), normalized to lie between 0 and 1, and average relative correlation rank of genes with similar mean expression as determined by grouping genes by their mean log-normalized expression over all timepoints combined into 20 bins (colored dashed lines) (Methods).
Extended Data Figure 7.
Extended Data Figure 7.. Metabolite profiles of cycling persisters, non-cycling persisters and untreated parental cells and FAO measurements
a,b. Principal Component Analysis (PCA) loadings (x axis) for the top 46 metabolites (y axis) associated with PC1 (a) and PC2 (b). c. UMAP representation of metabolomics data. d. Mean fatty acid oxidation (FAO) level (y axis, relative to mean of the untreated controls) measured by 3H-palmitic acid oxidation in PC9-Watermelon cells either untreated, treated only with 100 μM etomoxir for 3 days, or treated with 300nM osimertinib for 14 days. e. Mean FAO levels (y axis, relative to cells seeded at 300,000 per well, as used for the osimertinib time course) in PC9-Watermelon cells seeded at different densities (x axis) 24 hours prior to measurement. two tailed t-tests; **P < 0.01; NS – not significant (compared to 300,000 cells per well). f. Mean confluence (y axis) of PC9-Watermelon cells treated with 100μM Etomoxir for 14 days (Methods). g. Mean fraction of cycling persisters for control and sgCPT1A PC9 cells. Error bars are mean +/− SD of two (f) or three biologically independent experiments (d,e,g). **P < 0.01; ***P < 0.001; ****P < 0.0001; NS, not significant (P > 0.05); two-tailed t-tests (e-g).
Extended Data Figure 8.
Extended Data Figure 8.. Single cell analysis of multiple watermelon persister models
a,b.UMAP representation of cells colored by cell line (a) and cluster identify (b).c-e, Fraction of cells (y axis) in each cluster (x axis) colored by cell line (c), treatment (d) and experimental replicate (e). f. Proportion of cells (y axis) in each cell cycle phase (colored stacked bars) based on cell cycle scores inferred from scRNA-seq data across cell line models.
Extended Data Figure 9.
Extended Data Figure 9.. Modeling minimal residual disease using an engineered transgenic mouse model
a. Transgenic composition of the EGFRL858R genetically engineered mouse model used in this study. b. Tumor burden in a osimertinib-treated representative mouse as measured by MRI. c. IHC staining for EGFR L858R mutant and mKate in treatment-naïve mouse lung tumors. d. Experimental schema for molecular profiling of mKate+ cells isolation. e. Flow gating scheme for mKate+ cells. R4 cells from untreated and MRD-bearing mice were sorted and subjected to sequencing. mKate negative cells (R6). Images in c are representative of three independent experiments.
Extended Data Figure 10.
Extended Data Figure 10.. Changes in expression of metabolic programs in patient tumors
a,b. Increase in fatty acid metabolism and ROS pathway signatures in drug-treated human lung adenocarcinoma. Distribution of expression scores of FAM (a) and ROS (b) signatures in cells from individual EGFR-driven lung adenocarcinoma tumors (with more than 10 cells) across different treatment timepoints (x axis). Box plots are represented by center line, median; box limits, upper and lower quartiles; whiskers extend at most 1.5× interquartile range past upper and lower quartiles. x¯: Mean signature level for time point. For number of cells per patient see Supplementary Table 3. c-e. Correlation between ROS (y axis) and FAM (x axis) signature scores in (c) treatment naïve (TN), residual disease (RD) and progressive disease (PD) human lung adenocarcinoma, (d) treatment naïve melanoma, and (e) treatment naïve breast cancer. Significance based on bootstrap test (c, Methods) and t distribution (d,e). 95% confidence interval (d-e, shaded area).
Figure 1.
Figure 1.. Persister cells contain a rare proliferative subpopulation
a. Representative phase contrast images of a colony of PC9 cells before (left) and after (right) 14 days of 300 nM osimertinib treatment (Methods). Arrow: A colony of cycling persisters. Scale bar 100 μm. b. Left: Number of cell divisions (colorbar) for each of 1,135 individual PC9 cell lineages (rows, left) or only for 77 persister lineages (rows, right) tracked by live imaging of a 14-day osimertinib treatment (x axis). White: lineage perished. c. Distribution of mean cell cycle time (y axis) of untreated and persister cell lineages (x axis) from live cell imaging tracking data. d. Proportion of lineages with a large (>6 cells; yellow) or small (1–6 cells, blue) number of progeny or with no progeny (drug sensitive, grey) at endpoint (14-day osimertinib treatment). e,f. The Watermelon system. e. Watermelon vector. Semi-random barcode linked to the NLS-mNeon gene allows for lineage tracing. The doxycycline inducible H2B-mCherry facilitates proliferation tracking via fluorescent dilution. f. Merged fluorescence (red) and phase contrast of Watermelon-PC9 persister cells following 14-day osimertinib treatment during which dox was included for the first 3 days. Arrowhead: colony of cycling persisters. Scale bar 100 μm. g. Percent of viable cells (y axis) from populations derived from parental (green), cycling persister (pink) and non-cycling persister (red) cells treated with the indicated concentrations of osimertinib (x axis) for 72hr (Methods). Black arrow: concentration used for establishing persister cells (300nM). h. Mean doubling time (y axis) in populations derived from parental (green), cycling persister (pink) and non-cycling persister (red) cells, grown in drug free media. Error bars are mean +/− SD of three biologically independent experiments. NS, not significant (P > 0.05); two-tailed t-tests. Images a and f are representative of three independent experiments.
Figure 2.
Figure 2.. Cycling and non-cycling persisters arise from different cell lineages that express distinct transcriptional programs
a. Experimental scheme. Vertical arrows: scRNA-seq collection time point. b. Proportion of cells in each cell cycle phase inferred from scRNA-seq. c. Lineage size (colourbar) for each lineage barcode (rows) across time points. Lineages sorted by fate at day 14, and marked by the majority fate of the mCherry populations on day 14 in that lineage (left bar). d. Force-directed layout of scRNA-seq profiles coloured by timepoint and day 14 mCherry expression (left); day 14 clone size (middle) or fate (right) of the lineage the cells belong to. Inset, right: fate distribution at day 14. e. Clone size of each persister lineage barcode in two independent experiments seeded from the same barcoded founding population. Colour: Persister fate of majority of cells in the lineage of combined replicates. P value determined by permutation test (Methods). f. Signature scores by lineage majority fate. g. Correlation coefficient (colourbar) of each gene’s (row) expression in each persister cell in a given timepoint (columns) and the cells’ corresponding lineage size at day 14. h. Distribution of expression levels (log2(TPM+1), y axis) across time for 5 of the top 10 genes positively correlated with persister lineage size. i. Fraction of cycling persisters following osimertinib treatment in control and sgKeap1 PC9 cells, P =3×10⁻⁴. j,k. ROS levels in PC9 treated with osimertinib timecourse (j, P0,3 =1.3×10⁻³, P3,7 < 1×10⁻⁴, P7,14 <1×10⁻⁴,one-way ANOVA with Tukey’s correction) or in persister subpopulations (k, P = 4×10⁻⁴). l-n. Fraction of cycling persisters following osimertinib treatment with or without NAC (l, P = 1.1 × 10⁻³), in PC9 transfected with control or a GPX2(m, P =1.5×10⁻²), or cells treated with or without Erastin (n, P =1×10⁻²). Error bars are mean +/− SD of three biologically independent experiments (i-n). * P < 0.05; ** P < 0.01; ***P < 0.001; two-tailed t-tests.
Figure 3.
Figure 3.. Persister cells shift their metabolism to fatty acid oxidation
a. The first two principal components (PCs) of a Principal Component Analysis of LC-MS/MS metabolite profiles. b. Z-scores (colourbar) of differentially abundant metabolites (rows) (one-way ANOVA P-value<0.05) between cycling persisters (pink), non-cycling persisters (red) and untreated parental cells (black) (columns). c. Mean abundance of β-oxidation metabolites measured by LC-MS. d. Mean fatty acid oxidation (FAO) levels (y axis, relative to mean of untreated cells) measured by 3H-palmitic acid oxidation in PC9 osimertinib-treated cells over time. P0,4 = 8×10⁻⁴, P0,16 < 1×10⁻⁴, P0,18 <1×10⁻⁴, one-way ANOVA with Tukey’s correction. e. Mean fraction of cycling persisters at day 14 of 300 nM osimertinib treatment of PC9 transfected with control or CPT1A-expressing vector, P =1×10⁻². f,g. Mean fraction of cycling persisters (y axis, f, P =3×10⁻⁴) and overall fraction of persister cells (y axis, g, P =1.6×10⁻²) at day 14 of 300 nM osimertinib treatment alone or with 100μM Etomoxir at days 3–14. h. Mean fraction of cycling persisters for control and sgCPT1C PC9 cells, P = 3×10⁻². i. Schematic for pooled persister assay. j. UMAP of single cell profiles (dots) from eight Watermelon persister models coloured by cell cycle phase. k-m. Signature scores of fatty acid metabolism (k), antioxidant response (l) and NRF2 (m) pathways in persister cells from indicated models. Significance based on comparing cycling to non-cycling populations (Methods and Supplementary Table 2). Box plots represented by center line, median; box limits, upper and lower quartiles; whiskers extend at most 1.5× interquartile range past upper and lower quartiles. n. Mean ROS levels in melanoma (A375, P = 5.1×10⁻³) and colorectal (HT29, P <1×10⁻⁴) persister populations. Error bars are mean +/− SD of two (e,g) or three biologically independent experiments (c,d,f,h,n). * P < 0.05; * * P < 0.01; * * * P < 0.001; * * * *P < 0.0001; two-tailed t-tests.
Figure 4.
Figure 4.. Metabolic shift in tumours treated with oncogene-targeted therapy
a. Fatty acid metabolism (FAM) and reactive oxygen species (ROS) pathway signatures increase with treatment in a genetically engineered mouse model. Left: Experimental scheme for tumour development and drug treatment; middle: MRI (left) and H&E staining (right) of pre- (top) and post-treatment (bottom) mouse lungs. b. Gene Set Enrichment Analysis (GSEA) of cell cycle, EGFR signaling, ROS, and FAM related genes in minimal residual disease samples versus untreated control. c,d. Signature scores FAM (c, PTN,RD< 2×10⁻¹⁶, PTN,PD< 2×10⁻¹⁶, PRD,RD= 6×10⁻¹⁴) and ROS (d, PTN,RD=6.7×10⁻⁷, PTN,PD< 2×10⁻¹⁶, PRD,RD= 4.8×10⁻¹⁶) in treatment naïve (TN), residual disease (RD) and progressive disease (PD) of human lung adenocarcinoma (457, 557, and 1,088 cells per group, respectively). *** P < 0.001**** P<0.001; two-sided Wilcoxon test. Expression data from NCT03433469 trial. Box plots represented by center line, median; box limits, upper and lower quartiles; whiskers extend at most 1.5× interquartile range past upper and lower quartiles. e,f. FAM (e, PTN=1.2×10⁻², PRD=1.1×10⁻³, PPD=1.5×10⁻²) and ROS (f, PTN=0.9, PRD= 5.3×10⁻³, PPD=0.1) signature scores (y axis) in cells (dots) stratified by cycling (pink) vs. non-cycling (red) status across treatment phases of lung adenocarcinoma samples. * P < 0.05 (mixed linear model; Supplemental Methods). g. Correlation between ROS and FAM signature scores (x and y axes) in cells (dots) from lung adenocarcinoma residual disease. Bottom right: Correlation coefficient. h,i. Correlation between ROS and FAM signature scores in melanoma (h) and breast cancer (i) residual disease samples (dots). ROS (y axis) and FAM (x axis) signature scores in melanoma patients treated with BRAFi/MEKi (h) and HER2+ breast cancer patients treated with lapatinib (i). Bottom right: correlation coefficient. 95% confidence interval (g-i, shaded area).

Comment in

References

    1. Salgia R & Kulkarni P The Genetic/Non-genetic Duality of Drug ‘Resistance’ in Cancer. Trends Cancer 4, 110–118, doi:10.1016/j.trecan.2018.01.001 (2018). - DOI - PMC - PubMed
    1. Vallette FM et al. Dormant, quiescent, tolerant and persister cells: Four synonyms for the same target in cancer. Biochem Pharmacol 162, 169–176, doi:10.1016/j.bcp.2018.11.004 (2019). - DOI - PubMed
    1. Sharma SV et al. A chromatin-mediated reversible drug-tolerant state in cancer cell subpopulations. Cell 141, 69–80, doi:10.1016/j.cell.2010.02.027 (2010). - DOI - PMC - PubMed
    1. Hata AN et al. Tumor cells can follow distinct evolutionary paths to become resistant to epidermal growth factor receptor inhibition. Nat Med 22, 262–269, doi:10.1038/nm.4040 (2016). - DOI - PMC - PubMed
    1. Tirosh I et al. Dissecting the multicellular ecosystem of metastatic melanoma by single-cell RNA-seq. Science 352, 189–196, doi:10.1126/science.aad0501 (2016). - DOI - PMC - PubMed

Publication types

MeSH terms