. 2021 Sep;597(7875):256-262.
doi: 10.1038/s41586-021-03795-7. Epub 2021 Aug 11.

Aged skeletal stem cells generate an inflammatory degenerative niche

Affiliations

Aged skeletal stem cells generate an inflammatory degenerative niche

Thomas H Ambrosi et al. Nature. 2021 Sep.

Abstract

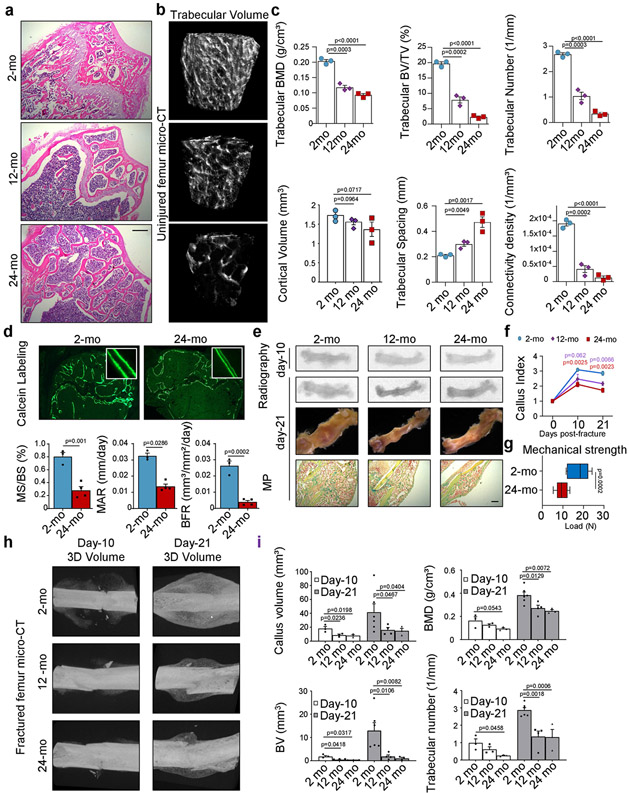
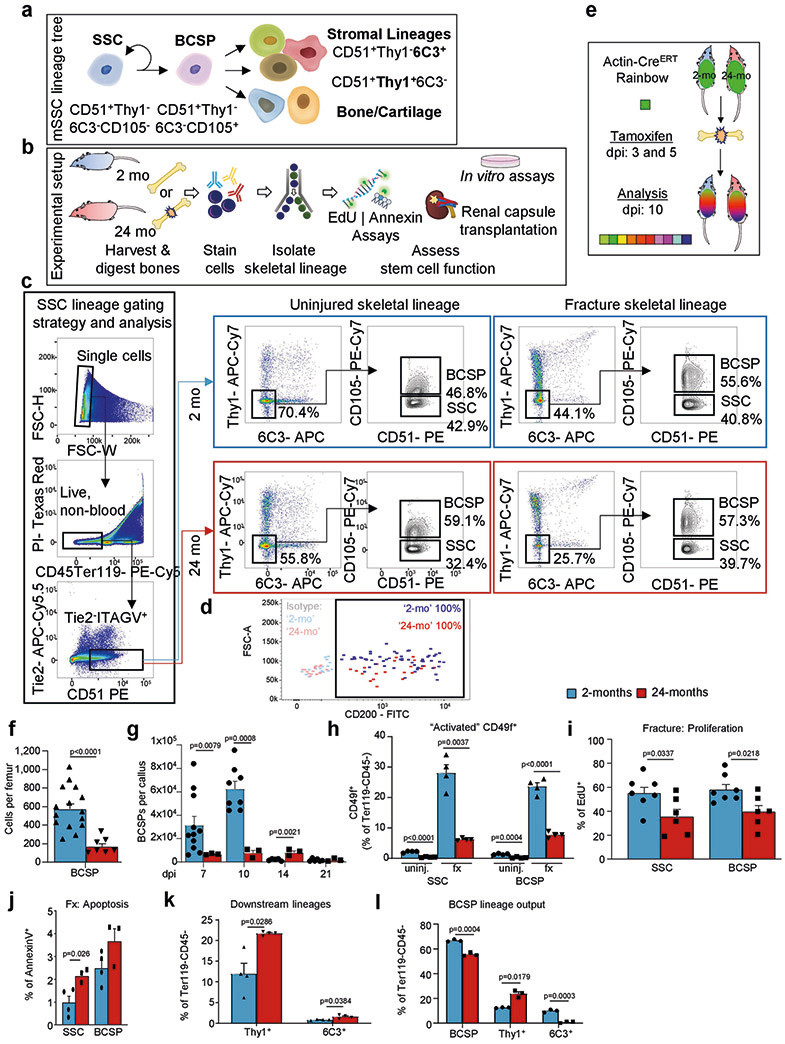
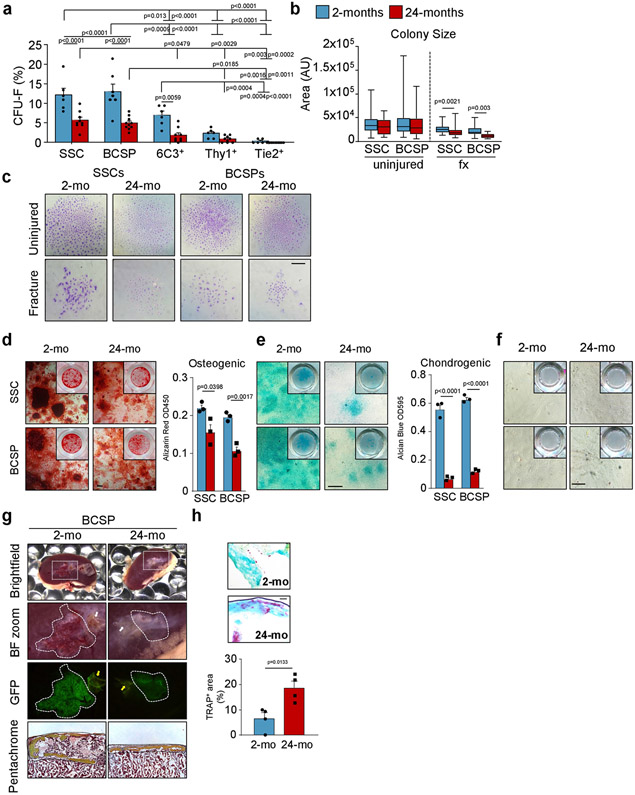
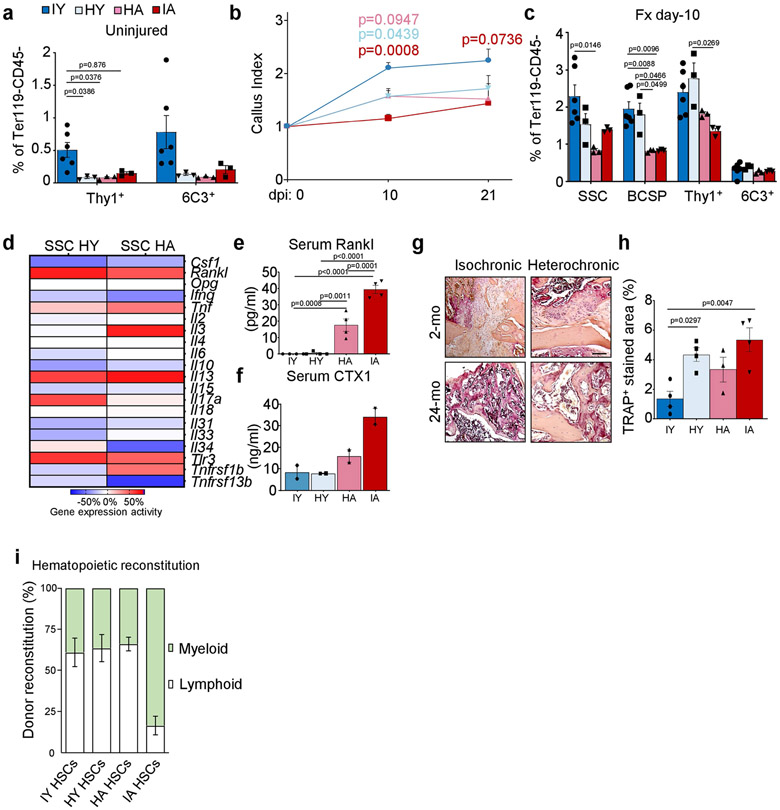
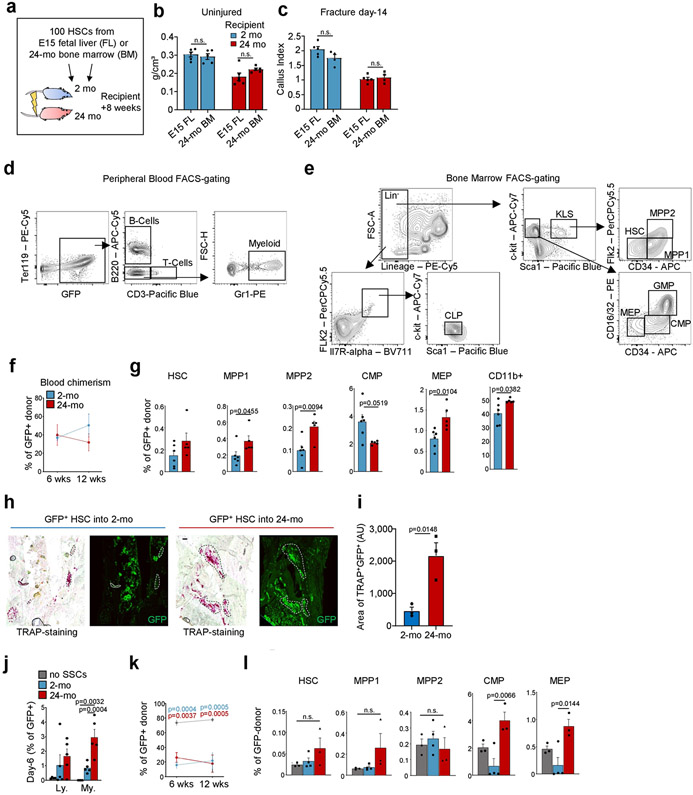
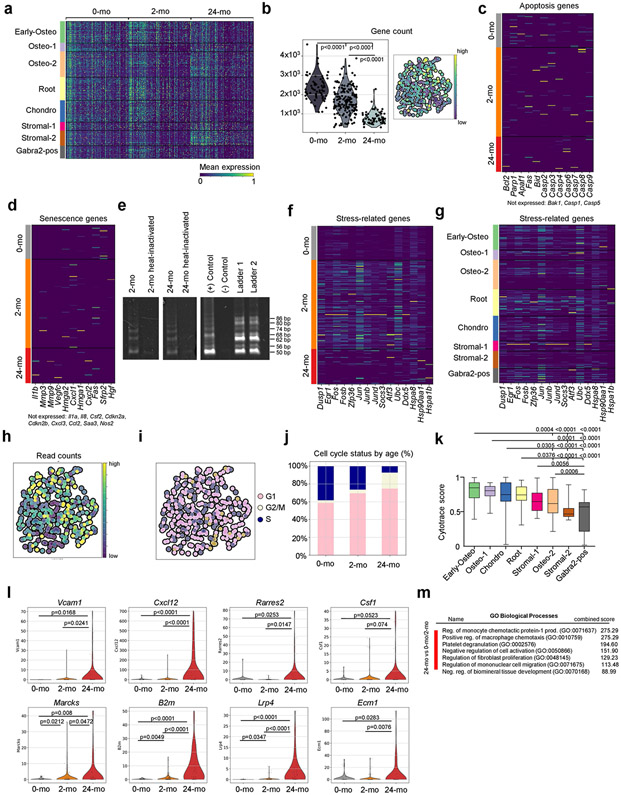
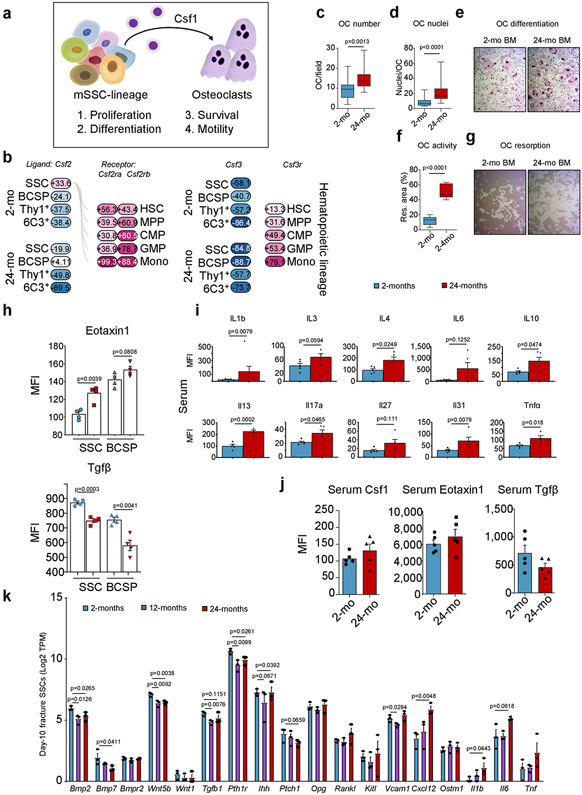
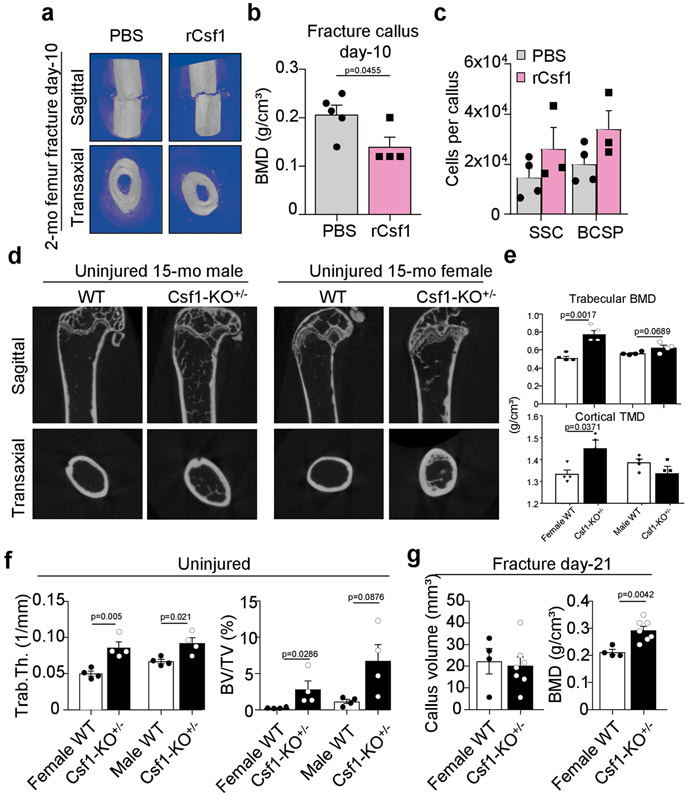
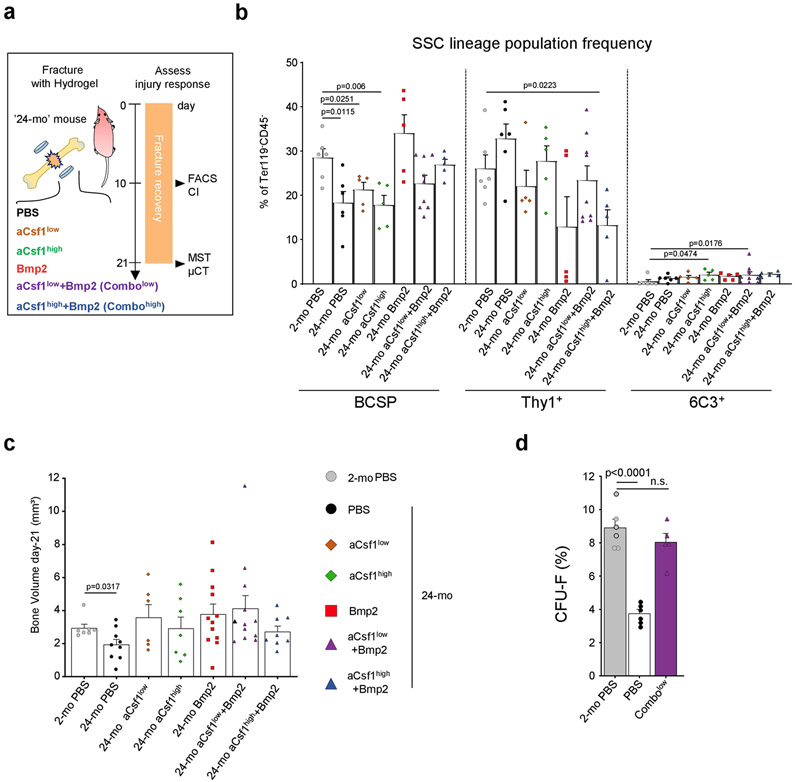
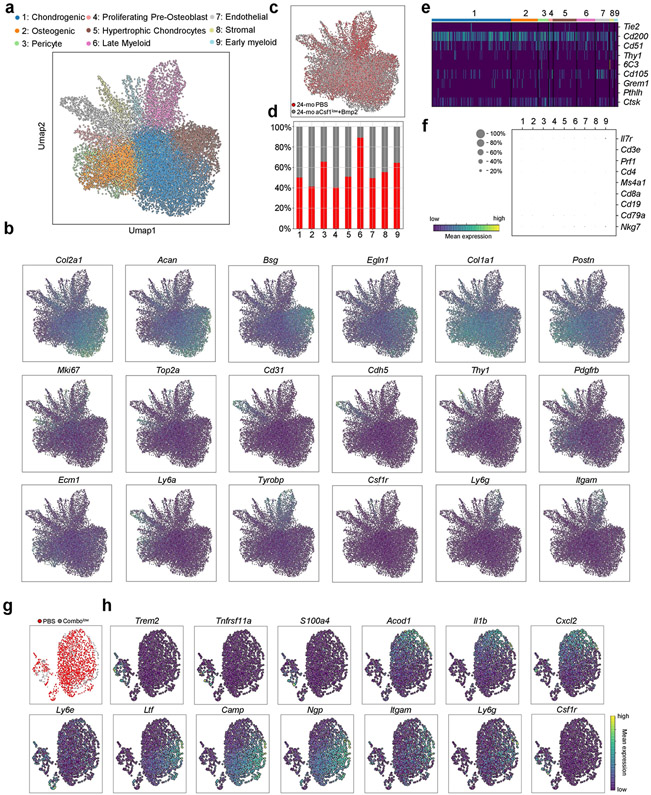
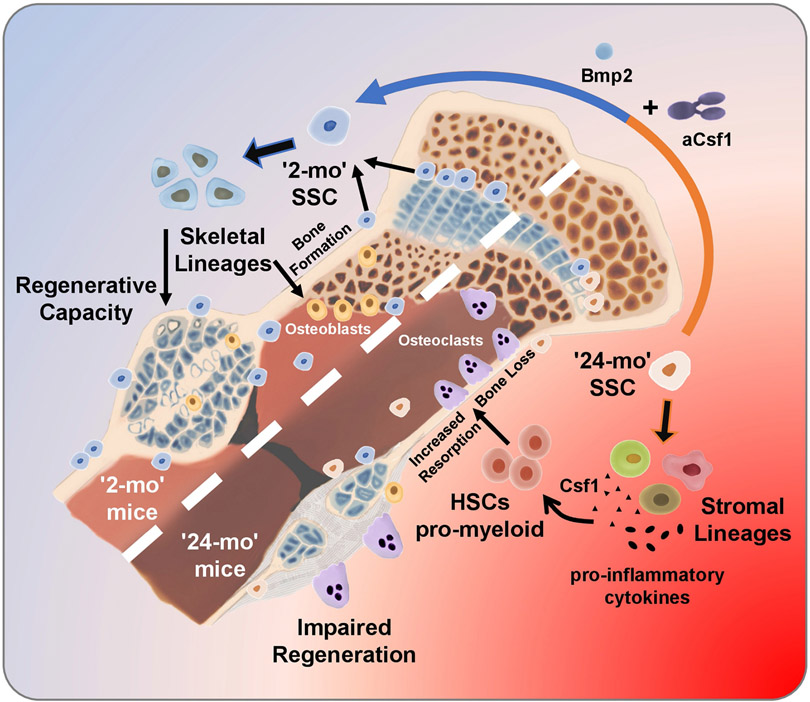
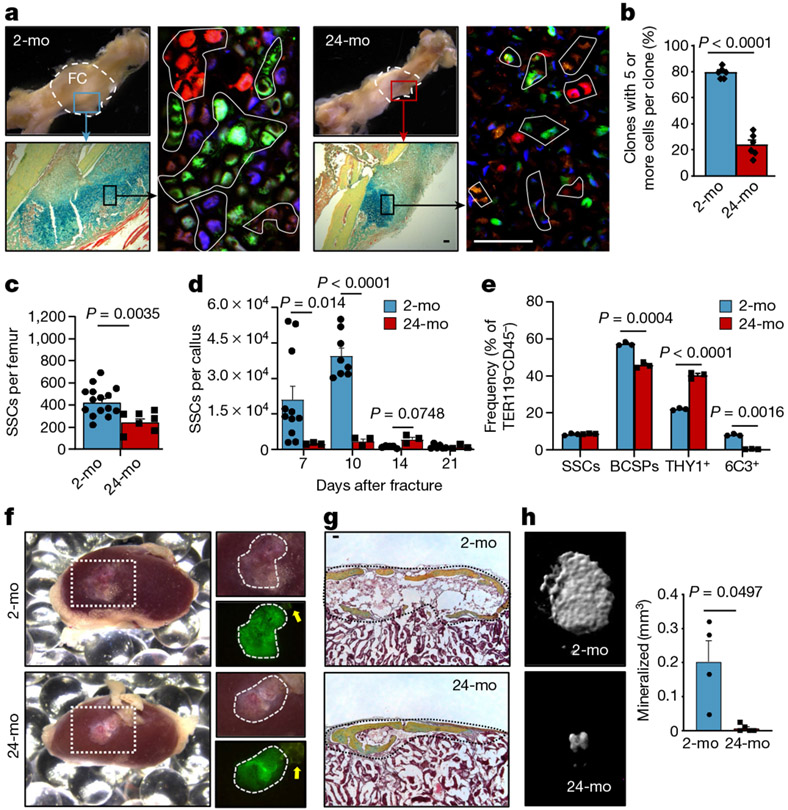
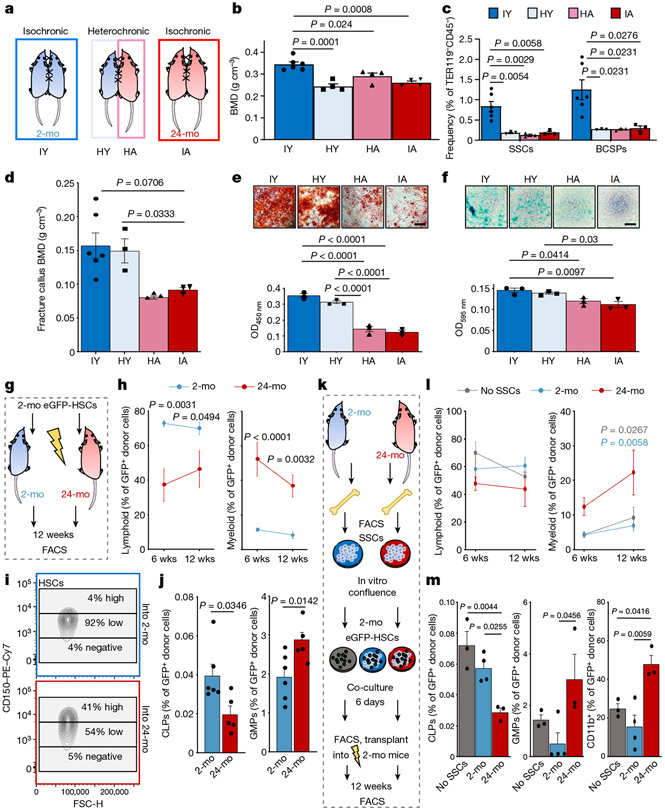
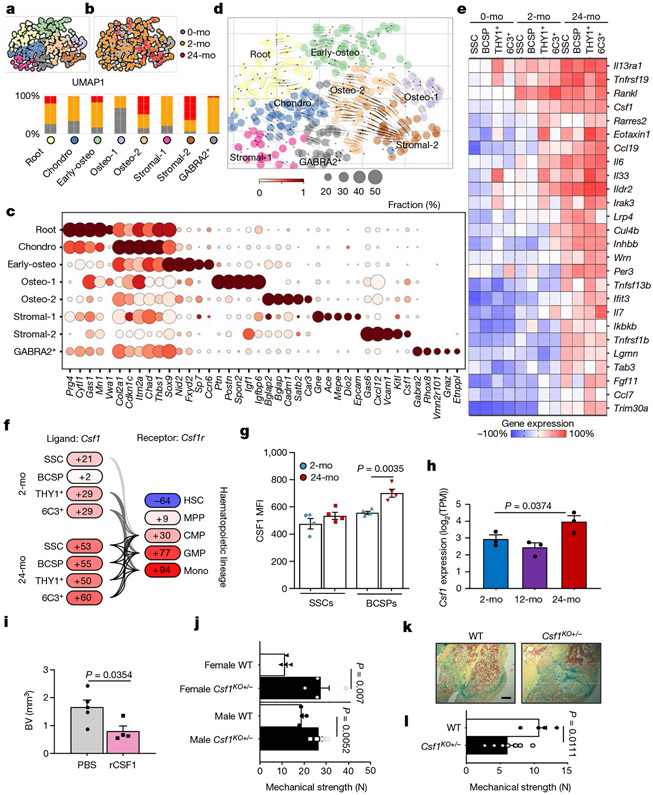
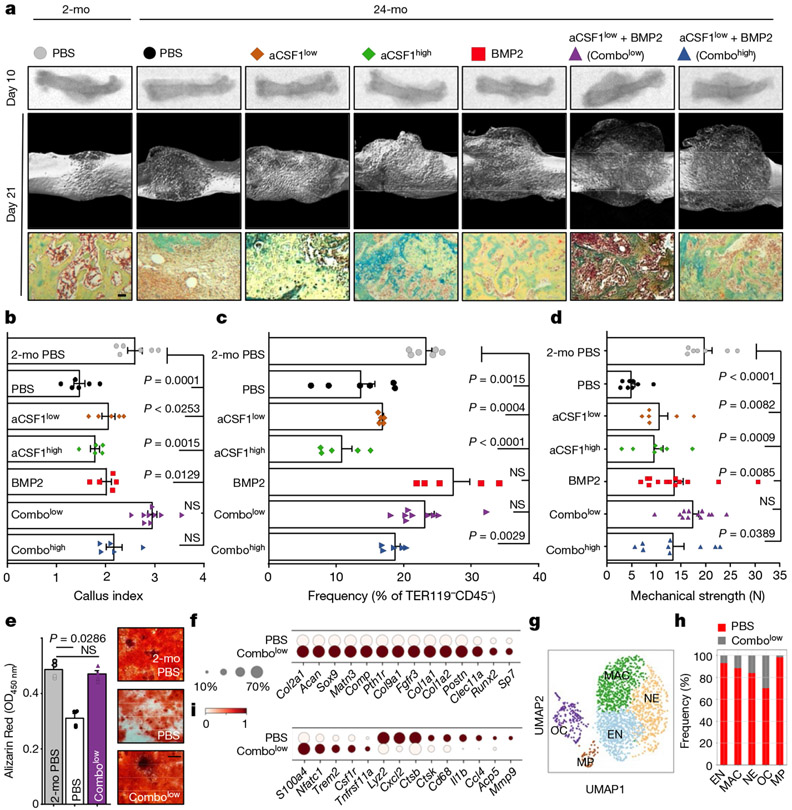
Loss of skeletal integrity during ageing and disease is associated with an imbalance in the opposing actions of osteoblasts and osteoclasts1. Here we show that intrinsic ageing of skeletal stem cells (SSCs)2 in mice alters signalling in the bone marrow niche and skews the differentiation of bone and blood lineages, leading to fragile bones that regenerate poorly. Functionally, aged SSCs have a decreased bone- and cartilage-forming potential but produce more stromal lineages that express high levels of pro-inflammatory and pro-resorptive cytokines. Single-cell RNA-sequencing studies link the functional loss to a diminished transcriptomic diversity of SSCs in aged mice, which thereby contributes to the transformation of the bone marrow niche. Exposure to a youthful circulation through heterochronic parabiosis or systemic reconstitution with young haematopoietic stem cells did not reverse the diminished osteochondrogenic activity of aged SSCs, or improve bone mass or skeletal healing parameters in aged mice. Conversely, the aged SSC lineage promoted osteoclastic activity and myeloid skewing by haematopoietic stem and progenitor cells, suggesting that the ageing of SSCs is a driver of haematopoietic ageing. Deficient bone regeneration in aged mice could only be returned to youthful levels by applying a combinatorial treatment of BMP2 and a CSF1 antagonist locally to fractures, which reactivated aged SSCs and simultaneously ablated the inflammatory, pro-osteoclastic milieu. Our findings provide mechanistic insights into the complex, multifactorial mechanisms that underlie skeletal ageing and offer prospects for rejuvenating the aged skeletal system.


Figures

Extended Data Fig. 1 ∣
Extended Data Fig. 1 ∣. Ageing alters bone physiology and fracture healing in mice.
a, Representative haematoxylin and eosin (H&E) staining of proximal femurs from 2-month-old, 12-month-old and 24-month-old mice (representative of sections from three independent mice per age group). b, Three-dimensional μCT reconstruction of femoral bone mass in 2-month-old, 12-month-old and 24-month-old mice. c, Quantification of bone parameters by μCT measurements in the three age groups (n = 3 per age group). d, Bone formation rate (BFR) assessment by calcein labelling in 2-month-old and 24-month-old mice (n = 3 per age group). MS, mineralizing surface; BS, bone surface; MAR: mineral apposition rate. e, Radiograph, μCT, and Movat’s pentachrome staining images of fracture calluses at day 10 and day 21 after injury. f, Callus index measurements at day 10 and day 21 after fracture in femurs from 2-month-old, 12-month-old and 24-month-old mice (day 10 12-mo, n = 5; all other groups, n = 3). g, Mechanical strength test of fracture calluses at day 21 after fracture (2-mo, n = 10; 24-mo, n = 8). Box-and-whisker plots with centre line as median, box extending from 25th to 75th percentile and minimum to maximum values for whiskers. h, μCT images of fracture calluses from 2-month-old, 12-month-old and 24-month-old mouse femurs at day 10 and day 21 after injury. i, Quantification of fracture callus parameters by μCT measurements in the three age groups (n = 3–6). All scatter plot data are mean + s.e.m. One-sided Student’s t-test for comparison of ageing groups to the 2-month-old group, adjusted for non-normality (Mann–Whitney test) or unequal variances (Welch’s test) where appropriate. For exact P values, see Source Data. Scale bars, 150 μm.
Extended Data Fig. 2 ∣
Extended Data Fig. 2 ∣. Phenotypic SSCs are present in aged mice.
a, The mouse skeletal stem-cell lineage. A self-renewing SSC gives rise to a BCSP cell which is the precursor for committed cartilage, bone and stromal lineages. b, Schematic of experimental strategy to analyse intrinsic characteristics of highly purified SSC lineage cells from 2-month-old or 24-month-old mice. c, FACS gating strategy for the isolation of mouse SSC lineage cells. Representative FACS profiles for 2-month-old and 24-month-old mice are shown during the uninjured state and the day-10 fracture state. d, CD200 expression of SSC gated cells in 2-month-old (blue) and 24-month-old (red) mice. Isotype controls performed on SSCs from 2-month-old or 24-month-old mice are shown for gating of the CD200-positive fraction. e, Schematic representation of the experimental set-up investigating clonal activity in fractures of 2-month-old or 24-month-old Actin-CreERT Rainbow mice (dpi, days post-injury). f, Flow cytometric quantification of BCSPs per uninjured femur (2-mo, n = 15; 24-mo, n = 7). g, Prevalence of BCSPs at different days after fracture injury in 2-month-old and 24-month-old mice (2-mo, n = 5-11; 24-mo, n = 3). h, Flow cytometric analysis of CD49f+ phenotypic SSCs and BCSPs under uninjured (uninj.) and fractured (fx; day 10) conditions in 2-month-old and 24-month-old mice (n = 4 per state, age and population). i, Proliferative activity within SSCs and BCSPs at day 10 after fracture as measured by EdU incorporation (2-mo, n = 7; 24-mo, n = 6).j, Assessment of apoptotic activity within SSCs and BCSPs at day 10 after fracture as measured by Annexin V staining (2-mo, n = 4; 24-mo, n = 3). k, Flow cytometric quantification of THY1+ and 6C3+ downstream cell population frequency in 2-month-old and 24-month-old mice in response to fracture at day 10 after injury (n = 4 per age). l, Flow cytometric analysis of the lineage output of BCSPs freshly isolated from 2-month-old and 24-month-old mice and cultured for six days (n = 3 per age). Comparison of 2-month-old and 24-month-old age groups by two-sided Student’s t-test adjusted for non-normality (Mann-Whitney test) or unequal variances (Welch’s test) where appropriate. Data are mean + s.e.m. For exact P values, see Source Data.
Extended Data Fig. 3 ∣
Extended Data Fig. 3 ∣. SSCs and BCSPs show reduced functionality in vitro and in vivo.
a, Fibroblast colony forming unit (CFU-F) ability of 2-month-old and 24-month-old SSC-derived cell populations of long bones (2-mo, n = 5-6; 24-mo, n = 9-10). Two-way ANOVA with Bonferroni’s post-hoc test. b, SSC- and BCSP-derived colony size of cells derived from uninjured and day-10-fractured bones (n = 7–120). Statistical testing between age groups by unpaired Student’s t-test or Mann–Whitney test for non-normality. c, Representative images of colonies stained by Crystal Violet (representative of CFU-F from three independent experiments). d, In vitro osteogenic capacity of SSCs and BCSPs from 2-month-old and 24-month-old mice as determined by Alizarin Red S staining. Representative staining (left) and quantification of osteogenesis (right) (n = 3 per age). e, In vitro chondrogenic capacity of SSCs and BCSPs from 2-month-old and 24-month-old mice as determined by Alican Blue staining. Representative staining (left) and quantification of chondrogenesis (right) (n = 3 per age). f, In vitro adipogenic capacity of SSCs and BCSPs from 2-month-old and 24-month-old mice as determined by Oil Red O staining. g, Renal capsule transplantation results of grafts excised 4 weeks after transplantation of GFP-labelled BCSPs derived from long bones of 2-month-old and 24-month-old mice. Representative gross images of kidneys and magnified graft as bright-field images and with GFP signal shown, for cells derived from 2-month-old (left) and 24-month-old (right) mice. Sectioned grafts stained by Movat’s pentachrome are displayed at the bottom. White and yellow arrows point at auto-fluorescent collagen sponge, which is not part of the graft (representative of 4 independent mice or experiments per age group). h, TRAP-staining images (top) and quantification (bottom) for osteoclast surfaces in sections derived from SSC-derived renal grafts (n = 4 per age group). Statistical testing by two-sided Student’s t-test adjusted for non-normality (Mann–Whitney test) or unequal variances (Welch’s test) where appropriate. Data are mean + s.e.m. For exact P values, see Source Data. Scale bars, 50 μm.
Extended Data Fig. 4 ∣
Extended Data Fig. 4 ∣. Exposure to a young circulation does not rejuvenate the SSC lineage.
a, THY1+ and 6C3+ cell frequency as assessed by flow cytometry at four weeks of parabiosis (IY, n = 6; HY, n = 3; HA, n = 3; IA, n = 3). b, Callus index (highest width of callus divided by bone shaft width next to fracture) for parabiosed mice at day 10 (IY, n = 9; HY, n = 9; HA, n = 6; IA, n = 5) and day 21 (IY, n = 4; HY, n = 5; HA, n = 3; IA, n = 3) after fracture injury. Statistical testing by two-way ANOVA with Bonferroni post-hoc test. c, SSC lineage frequencies as assessed by flow cytometry at day 10 after fracture (Fx) in parabionts (IY, n = 6; HY, n = 3; HA, n = 3; IA, n = 3). Statistical testing by one-way ANOVA analyses with Tukey’s post-hoc test for all comparisons. d, Microarray-based inflammatory gene expression levels of purified SSCs from HA and HY mice. e, Blood serum concentration of RANKL in the circulation of four-week parabionts (n = 4 per group). f, Blood serum concentration of CTX1 in the circulation of four-week parabionts (n = 2 per group). g, Representative images of TRAP staining of fracture calluses of parabionts. h, Quantification of TRAP staining in fracture calluses of parabionts (IY, n = 4; HY, n = 4; HA, n = 3; IA, n = 4). i, Percentage of myeloid and lymphoid reconstitution from transplanted HSCs of parabionts into irradiated recipient mice (n = 4 per group). Statistical testing by one-way ANOVA analyses with Tukey’s post-hoc test for all comparisons. All data are mean + s.e.m. For exact P values, see Source Data. Scale bar, 100 μm.
Extended Data Fig. 5 ∣
Extended Data Fig. 5 ∣. The bone marrow microenvironment influences HSC lineage output.
a, Schematic of experimental approach for transplanting freshly isolated HSCs from fetal liver or 24-month-old mice into either 2-month-old or 24-month-old lethally irradiated mice. b, BMD in 2-month-old and 24-month-old lethally irradiated mice transplanted with fetal liver (FL) HSCs or HSCs from 24-month-old mice 8 weeks after haematopoietic reconstitution (E15 FL into old mice, n = 6; n = 5, all other groups). BM, bone marrow. c, Callus index of recipient mice at day 14 after fracture induced at the 8-week time point after transplantation (E15 FL groups, n = 5; 24-mo BM groups, n = 4). d, Representative FACS-gating strategy for myeloid (GR1+) and lymphoid (B and T cells) cells in peripheral blood after haematopoietic reconstitution with GFP-donor HSCs (gated from TER119, live cells). e, Representative bone marrow FACS-gating strategy of GFP+ donor-derived cells for haematopoietic lineage tree populations. f, Peripheral blood analysis for donor chimerism after haematopoietic reconstitution of 2-month-old and 24-month-old mice with young HSCs. g, BM analysis of donor-derived (GFP+) HSC lineage cell populations by flow cytometry. Two-way ANOVA with Bonferroni post-hoc test. h, Representative TRAP-staining and GFP-fluorescence images (same section) from day-10 fracture calluses of 2-month-old and 24-month-old mice reconstituted with GFP-labelled HSCs from 2-month-old mice. i, Quantification of the total area of TRAP+GFP+ regions in sections of fracture calluses of mice (n = 3 per age group).j, Flow cytometric analysis of lymphoid and myeloid cell types in 6-day co-cultures (no SSCs, n = 4; 2-mo, n = 5; 24-mo, n = 5). One-way ANOVA with Tukey’s posthoc test for comparison of more than two groups. k, Peripheral blood analysis for donor chimerism after haematopoietic reconstitution with co-cultured haematopoietic cells. Two-way ANOVA with Bonferroni post-hoc test. l, Bone marrow analysis of co-cultured donor-derived (GFP+) HSC lineage cell populations by flow cytometry (no SSCs, n = 3; 2-mo, n = 4; 24-mo, n = 3). One-way ANOVA with Tukey’s post-hoc test for comparison of more than two groups. Comparison of 2-month-old versus 24-month-old groups by two-sided Student’s t-test adjusted for non-normality (Mann–Whitney test) or unequal variances (Welch’s test) where appropriate. One-way ANOVA with Tukey’s post-hoc test. All data are mean + s.e.m. For exact P values, see Source Data. Scale bar, 100 μm.
Extended Data Fig. 6 ∣
Extended Data Fig. 6 ∣. Distinct transcriptomic signatures in SSCs of different ages.
a, Heat map of the top 150 differentially expressed genes in each age group by Leiden clusters. b, Gene count per single cell as violin plots grouped by age (left) and in a UMAP plot. Statistical testing by Mann–Whitney test. c, Heat map showing the expression of apoptosis-related genes in single-cell data grouped by age. d, Heat map showing the expression of senescence-associated genes in single-cell data grouped by age. e, Electrophoresis gel showing telomerase expression in freshly purified SSCs from 2-month-old and 24-month-old mice. For gel source data, see Supplementary Data 1. f, Heat map showing the expression of tissue digest and stress-associated response genes in single-cell data grouped by age. g, Heat map showing the expression of tissue digest and stress-associated response genes in single-cell data grouped by Leiden cluster. h, Total read count per single cell in UMAP plot. i, Cell-cycle status of single cells illustrated in UMAP plot.j, Proportion of cell-cycle state per age group. k, CytoTrace scores of single SSCs grouped by Leiden cluster (Early-osteo, n = 48; Osteo-1, n = 19; Chondro, n = 48; Root, n = 51; Stromal-1, n = 19; Osteo-2, n = 56; Stromal-2, n = 33; GABRA2+, n = 28 single cells). Data are shown as box-and-whisker plots with centre line as median, box extending from 25th to 75th percentile and minimum to maximum values for whiskers. l, Single-cell data of selected age-associated genes related to enhanced bone loss and support of osteoclastogenesis, shown as violin plots grouped by age. Statistical testing between age groups by two-sided Student’s t-test adjusted for non-normality (Mann–Whitney test) or unequal variances (Welch’s test) where appropriate. m, EnrichR GO analysis of differentially expressed genes of SSCs from 24-month-old versus 0-month-old or 2-month-old SSCs and their relation to cell function as determined by GO Biological Processes.
Extended Data Fig. 7 ∣
Extended Data Fig. 7 ∣. Skeletal-lineage-derived CSF1 promotes bone resorption with age.
a, Model of SSC-lineage-derived CSF1 actions as described in the literature for osteoclast function. b, Ligand (Csf2 or Csf3) and receptor (Csf2r or Csf3r) bulk microarray gene expression (%) in the 2-month-old and 24-month-old SSC lineage and in the haematopoietic lineage, respectively. c, Quantification of the number of in-vitro-cultured osteoclasts derived from the bone marrow of 2-month-old and 24-month-old mice (2-mo, n = 16; 24-mo, n = 18, number per field of view, from three mice per age group). d, Number of nuclei per derived osteoclast (n = 14 per age group). e, Representative bright-field images of in-vitro-derived osteoclasts. f, Quantification of in vitro resorption activity of bone-marrow-derived osteoclasts from the bone marrow of 2-month-old and 24-month-old mice (n = 5 wells with cells from two different mice per age). g, Representative bright-field images in the same experiment. h, Luminex protein data of eotaxin1 and TGFβ in the supernatant of SSC and BCSP cultures of 2-month-old and 24-month-old mice (n = 4 per age group). Statistical testing by two-sided Student’s t-test. i, Blood serum concentrations of selected inflammatory markers in 2-month-old and 24-month-old mouse blood (n = 4-5 per age). Statistical testing by two-sided Student’s t-test.j, Blood serum concentrations of CSF1, eotaxin1 and TGFβ in the circulation of 2-month-old and 24-month-old mice (n = 5 per age). Statistical testing by two-sided Student’s t-test. k, Gene expression of pro-haematopoietic or pro-osteoclastic and pro-osteogenic genes in bulk RNA-sequencing data of SSCs of day-10 fracture calluses from 2-month-old, 12-month-old and 24-month-old mice (n = 3 per age). One-sided Student’s t-test of ageing groups versus 2-month-old group. All data in scatter plots are mean + s.e.m., except c, d, f, which show box-and-whisker plots with centre line as median, box extending from 25th to 75th percentile and minimum to maximum values for whiskers. For exact P values, see Source Data.
Extended Data Fig. 8 ∣
Extended Data Fig. 8 ∣. CSF1 levels control skeletal maintenance and repair.
a, Representative μCT images of day-10 fracture calluses at the time of surgery supplemented with hydrogel containing recombinant CSF1 (5 μg) or PBS as control. b, BMD of day-10 fracture calluses treated with or without rCSF1 (PBS, n = 5; rCSF1, n = 4). c, Total number of SSCs and BCSPs at day 10 assessed by FACS (PBS, n = 4; rCSF1, n = 3). d, Representative μCT reconstructions of femur bones from uninjured wild-type or haplo-insufficient Csf1KO (Csf1KO+/−) 15-month-old female and male mice. e, Trabecular BMD (top) and cortical total mineral density (TMD; bottom) of femur bones from female and male wild-type and Csf1KO mice (n = 4 per genotype and sex). f, Bone parameters quantified by μCT from uninjured 15-month-old wild-type and Csf1KO female and male mice (n = 4 per genotype and sex). g, Bone parameters quantified by μCT from 21-day fracture calluses of 15-month-old wild-type and Csf1KO female mice (WT, n = 4; Csf1KO, n = 7). All comparison of 2-month-old versus 24-month-old groups by two-sided Student’s t-test. Data are mean + s.e.m. For exact P values, see Source Data.
Extended Data Fig. 9 ∣
Extended Data Fig. 9 ∣. Rejuvenating fracture healing in aged mice with defined factors.
a, Schematic representation of experimental set-up of rescue experiments with 24-month-old mice. b, Frequency of BCSPs, THY1+ and 6C3+ in 24-month-old mice at day 10 after fracture induction and application of factors (BMP2: 5 μg; CSF1low: 2 μg; CSF1high: 5 μg) (2-mo PBS, n = 6; PBS, n = 6; CSF1low, n = 5; CSF1high, n = 5; BMP2, n = 5; Combolow, n = 9; Combohigh, n = 5). c, μCT analysis of newly formed mineralized bone volume of treated fracture calluses at day 21 (2-mo PBS, n = 7; PBS, n = 9; CSF1low, n = 6; CSF1high, n = 7; BMP2, n = 12; Combolow, n = 12; Combohigh, n = 8). All two-sided Student’s t-tests between the 2-month-old group and each 24-month-old group adjusted for non-normality (Mann–Whitney test) or unequal variances (Welch’s test) where appropriate. d, CFU-F capacity of SSCs isolated from fracture calluses from the 2-mo-PBS, PBS and ‘Combolow treatment groups at day 10 (2-mo PBS, n = 6; PBS, n = 6; Combolow, n = 5). Two-sided Student’s t-test between the 2-month-old PBS-treated group and each 24-month-old group adjusted for non-normality (Mann–Whitney test) where appropriate (n.s., not significant). Data are mean + s.e.m. For exact P values, see Source Data.
Extended Data Fig. 10 ∣
Extended Data Fig. 10 ∣. Compositional and transcriptomic changes in fracture calluses of aged mice after rescue treatment.
a, Leiden clustering of 10X scRNA-seq experiment of 17,230 fracture callus cells from 24-month-old mice treated with PBS and from 24-month-old mice treated with aCSF1low + BMP2 (Combolow). b, UMAP plot showing expression of selected marker genes for Leiden clusters. c, UMAP plot showing distribution of cells from each treatment group. Red, 24-mo PBS; grey, 24-mo Combolow. d, Percentual fraction of treatment group cells per Leiden cluster. e, Heat map showing positive and negative markers used to identify SSCs. f, Dot plot showing the absence of lymphoid gene expression in 10X datasets. g, UMAP plot with cells labelled by treatment group in 10X dataset subset for cells enriched for haematopoietic gene expression. h, Same UMAP plot showing expression of selected marker genes.
Extended Data Fig. 11 ∣
Extended Data Fig. 11 ∣. Graphical abstract of SSC-mediated skeletal ageing.
Loss of skeletal integrity with age owing to reduced bone formation and increased bone resorption is associated with reduced SSC frequency and activity. The 24-month-old skeleton is characterized by increased bone loss, impaired regeneration and lineage skewing of the SSC lineage towards osteoclast-supportive stroma. Skeletal regeneration can be rejuvenated by simultaneous application of recombinant BMP2 and a low dose of an antibody blocking the action of CSF1.
Fig. 1 ∣
Fig. 1 ∣. Age-related bone loss coincides with altered skeletal stem-cell function.
a, Representative gross images showing fracture calluses (FC) of Actin-CreERT Rainbow mice at day 10 after fracture (top left), magnified outer callus region stained with Movat’s pentachrome (bottom left) and fluorescent clones (right) in 2-month-old (2-mo) and 24-month-old (24-mo) mice. b, Quantification of clone sizes. Six distinct callus regions (5–19 clones per section) from two mice per age group were counted. c, Flow cytometric quantification of SSCs per uninjured femur (2-mo, n = 15; 24-mo, n = 7). d, Prevalence of SSCs at different days after fracture injury in 2-month-old and 24-month-old mice (2-mo, day-7 n = 11, day-10 n = 7, day-14 n = 5, day-21 n = 6; 24-mo, n = 3). e, Flow cytometric analysis of the lineage output of freshly isolated SSCs from 2-month-old and 24-month-old mice. Cells were cultured for six days (n = 3 mice per age). f, Four-week renal capsule grafts derived from GFP-labelled SSCs of 2-month-old and 24-month-old mice. Representative gross images of kidneys (left) and magnified graft as bright-field images and with GFP signal shown (right). Yellow arrow indicates auto-fluorescent collagen sponge (not part of the graft). g, Sectioned grafts stained with Movat’s pentachrome. h, Representative μCT images (left) and quantification of mineralization (right) of renal grafts (2-mo, n = 4; 24-mo, n = 5). All comparisons by two-sided Student’s t-test adjusted for non-normality (Mann-Whitney test) or unequal variances (Welch’s test) where appropriate. Data are mean + s.e.m. For exact P values, see Source Data. Scale bars, 50 μm.
Fig. 2 ∣
Fig. 2 ∣. The SSC lineage contributes to age-related skewing of the haematopoietic lineage.
a, Schematic representation of parabiosis experiments with isochronic 2-month-old (isochronic young; IY) and 24-month old (isochronic aged; IA) pairs as well as heterochronic pairs with one 2-month-old (heterochronic young; HY) and one 24-month-old (heterochronic aged; HA) mouse. b, BMD at four weeks of parabiosis (IY, n = 6; HY, HA, IA, n = 4 per group). c, Frequency of SSCs and BCSPs at four weeks of parabiosis. d, BMD at day 10 after fracture of parabiosed mice (IY, n = 6; HY, n = 3; HA, n = 3; IA, n = 3). e, In vitro osteogenesis of SSCs from parabiosed mice at day 10 after fracture showing representative staining (top) and quantification (bottom). OD450 nm, optical density at 450 nm. f, In vitro chondrogenesis of the same SSCs (n = 3 per group). g, Schematic for transplantation of GFP-labelled HSCs from the bone marrow of 2-month-old mice into lethally irradiated 2-month-old or 24-month-old mice. h, Peripheral blood analysis at 6 weeks (wks) and 12 weeks after haematopoietic reconstitution for lymphoid (B and T cells) and myeloid (GR1+) fractions (2-mo, n = 6; 24-mo, n = 5). i, Expression of CD150 (SLAM) in donor-derived GFP+LINcKIT+SCA1+FLT3CD34 bone marrow HSCs. j, Bone marrow analysis of donor-derived (GFP+) haematopoietic cell populations at 12 weeks by flow cytometry (2-mo, n = 6; 24-mo, n = 5). CLP, common lymphoid progenitor; GMP, granulocyte–monocyte progenitor. k, Schematic of SSC–HSC co-culture experiments. l, Peripheral blood analysis after haematopoietic reconstitution with co-cultured haematopoietic cells. m, Bone marrow analysis of co-cultured donor-derived (GFP+) haematopoietic cell populations at 12 weeks (no SSCs, n = 3; 2-mo, n = 4; 24-mo, n = 3). Data are mean + s.e.m. Statistical testing in bf, m by one-way ANOVA analyses with Tukey’s post-hoc test for all comparisons. j, Two-sided Student’s t-test adjusted for non-normality (Mann–Whitney test) where appropriate. h, l, Two-way ANOVA with Bonferroni post-hoc test. For exact P values, see Source Data. Scale bars, 50 μm.
Fig. 3 ∣
Fig. 3 ∣. A pro-inflammatory aged skeletal lineage drives enhanced osteoclastic activity through CSF1.
a, Uniform manifold approximation and projection (UMAP) plot showing Leiden clusters from combined Smart-seq2 scRNA-seq of single cells from postnatal day 3 (0-month-old), 2-month-old and 24-month-old mice. b, Clustering of the same UMAP plot by age (top), showing the distribution within Leiden clusters (bottom) of sequenced single cells by age. c, Dot plot showing marker genes for each Leiden cluster. d, RNA velocity trajectory inference analysis with cells labelled by Leiden cluster. e, Heat map of bulk microarray data for the expression of pro-inflammatory and pro-myeloid or pro-osteoclastic genes of purified skeletal lineage populations. Wisp3 is also known as Ccn6. Each cell population reflects the expression of a pooled sample of three to five mice. f, Ligand (Csf1) and receptor (Csf1r) microarray bulk gene expression (in percentage) in the 2-month-old and 24-month-old SSC lineage and in the haematopoietic lineage, respectively. MPP, multipotent progenitor; CMP, common myeloid progenitor; mono, monocyte. g, Levels of CSF1 protein measured by Luminex assay in the supernatant of SSC and BCSP cultures from 2-month-old and 24-month-old mice (n = 4 per group). MFI, median fluorescence intensity. h, Csf1 expression in bulk RNA-sequencing data of purified SSCs of day-10 fracture calluses from 2-month-old, 12-month-old and 24-month-old mice (n = 3 per age). TPM, transcripts per million. One-sided Student’s t-test to compare ageing groups to the 2-month-old group. i, μCT analysis of bone volume (BV) of day-10 fracture calluses that were locally treated with PBS or 5 μg of recombinant CSF1 (rCSF1) (PBS, n = 5; rCSF1, n = 4). j, Mechanical strength of uninjured femur bones from 15-month-old haplo-insufficient Csf1-knockout (Csf1KO) mice versus wild-type (WT) mice (n = 4 per group). k, l, Movat’s pentachrome staining of day-21 fracture callus tissue (k) and mechanical strength of the same calluses (l) from 15-month-old Csf1KO and wild-type mice (wild type, n = 4; Csf1KO, n = 7). Two-sided Student’s t-test adjusted for unequal variances (Welch’s test) where appropriate (g, i, j, l). Data are mean + s.e.m. For exact P values, see Source Data. Scale bar, 150 μm.
Fig. 4 ∣
Fig. 4 ∣. Combinatorial targeting of the aged skeletal niche restores youthful fracture regeneration.
a, Radiographic images of fractured femurs at day 10 (top) and μCT reconstructions of calluses at day 21 after fracture (middle). Bottom, Movat’s pentachrome staining of sections of calluses. b, Callus index at day 10 after fracture. c, Frequency of SSCs at day 10 (2-mo PBS, n = 6; PBS n = 6; CSF1low, n = 5; CSF1hlgh, n = 5; BMP2, n = 5; Combolow, n = 9; Combohlgh, n = 5). d, Mechanical strength test of fractured bones at day 21 (2-mo PBS, n = 7; PBS, n = 8; CSF1low, n = 6; CSF1high, n = 7; BMP2, n = 13; Combolow, n = 12; Combohigh, n = 9). e, In vitro osteogenesis of SSCs at day 10 (n = 4 per group). Data are mean + s.e.m. Two-sided Student’s t-test between the 2-month PBS group and each 24-month group, adjusted for non-normality (Mann–Whitney test) where appropriate (NS, not significant). f, Dot plot showing the expression of osteochondrogenic genes from 10X scRNA-seq of 24-month PBS and Combolow fracture calluses; subset for non-haematopoietic cells. g, Leiden clustering of the 10X scRNA-seq dataset for cell fractions enriched for haematopoietic gene expression (myeloid progenitor (MP), osteoclast (OC), early neutrophil (EN), neutrophil (NE), macrophage (MAC)). h, Percentage of treatment-group cell fraction per Leiden cluster. i, Dot plot showing early and late osteoclastic gene expression in the OC cluster. For exact P values, see Source Data. Scale bar, 50 μm.

Comment in

References

    1. Boskey AL & Coleman R Aging and bone. J. Dent. Res 89, 1333–1348 (2010). - PMC - PubMed
    1. Chan CKF et al. Identification and specification of the mouse skeletal stem cell. Cell 160, 285–298 (2015). - PMC - PubMed
    1. Kenyon CJ The genetics of ageing. Nature 464, 504–512 (2010). - PubMed
    1. Rossi DJ, Jamieson CHM & Weissman IL Stems cells and the pathways to aging and cancer. Cell 132, 681–696 (2008). - PubMed
    1. Schmich J et al. Induction of reverse development in two marine hydrozoans. Int. J. Dev. Biol 51, 45–56 (2007). - PubMed

Publication types

Substances