. 2021 Aug;596(7873):553-557.
doi: 10.1038/s41586-021-03814-7. Epub 2021 Aug 11.

Oxytocin neurons enable social transmission of maternal behaviour

Affiliations

Oxytocin neurons enable social transmission of maternal behaviour

Ioana Carcea et al. Nature. 2021 Aug.

Abstract

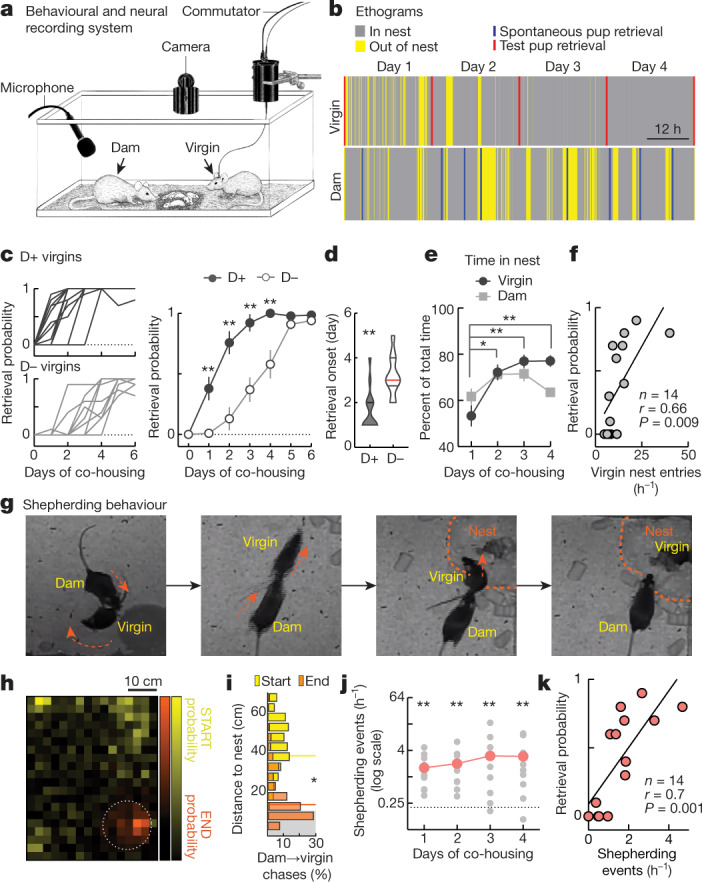
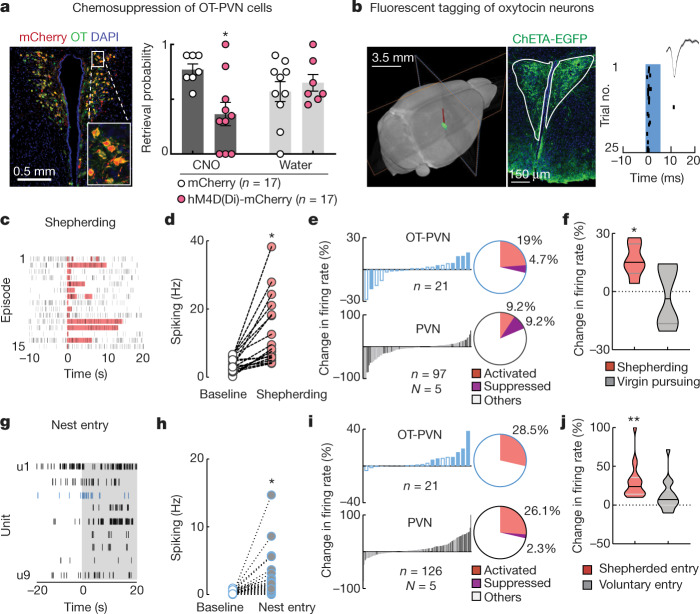
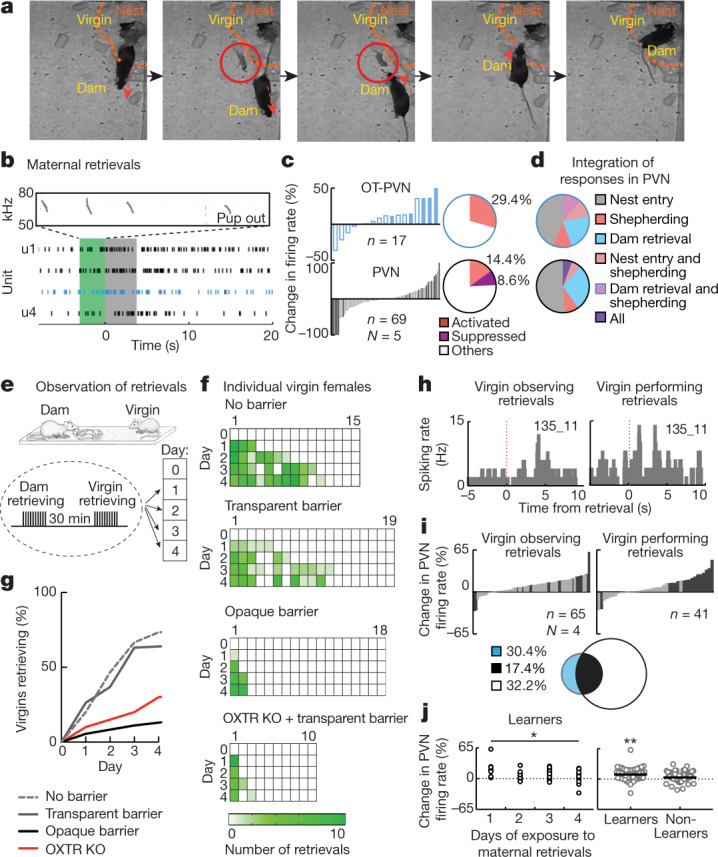
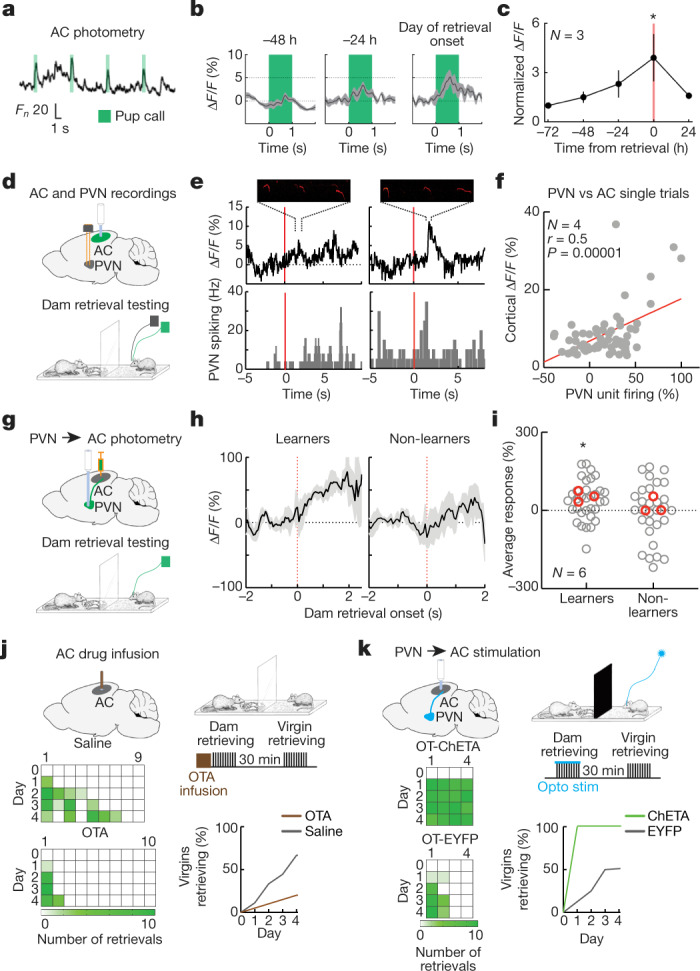
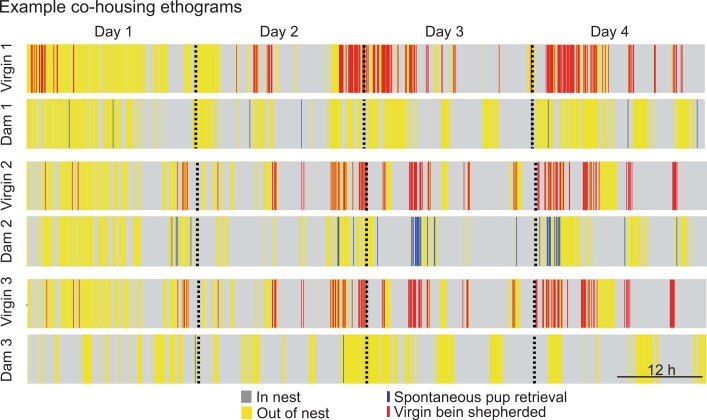
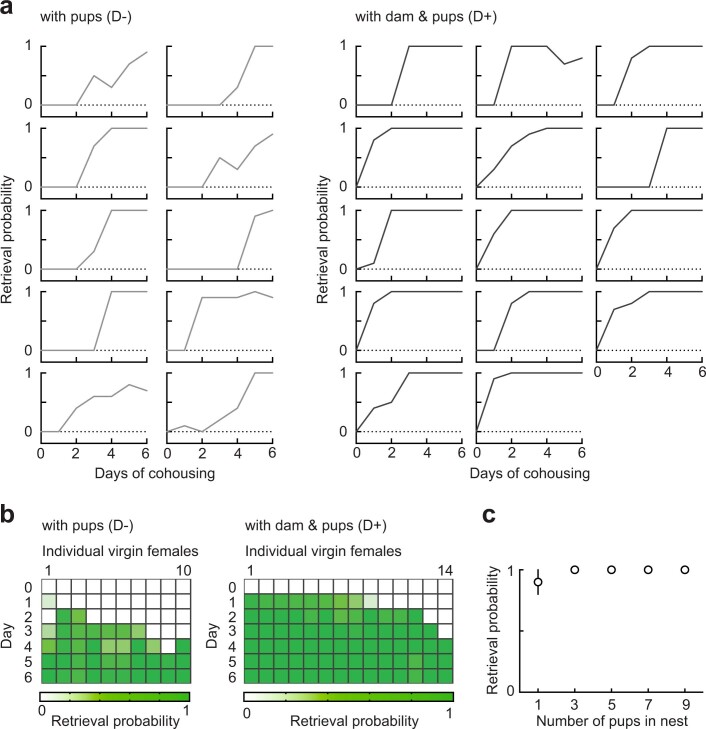
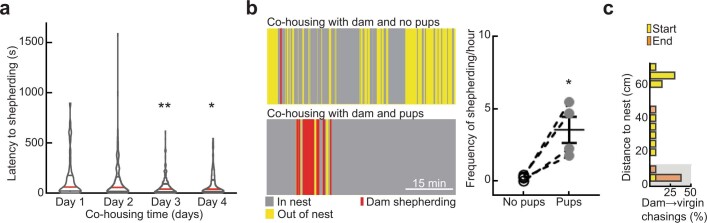
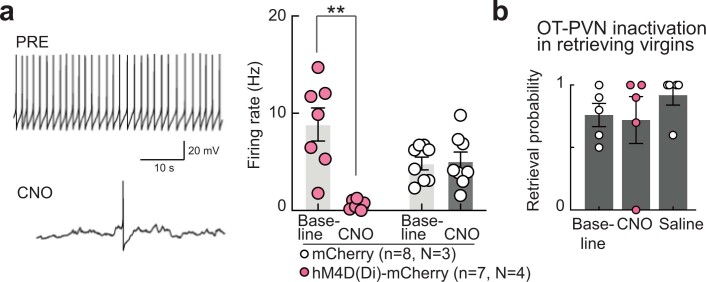
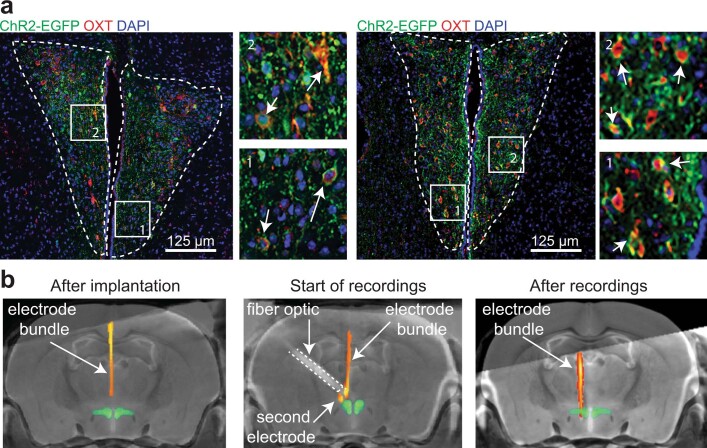
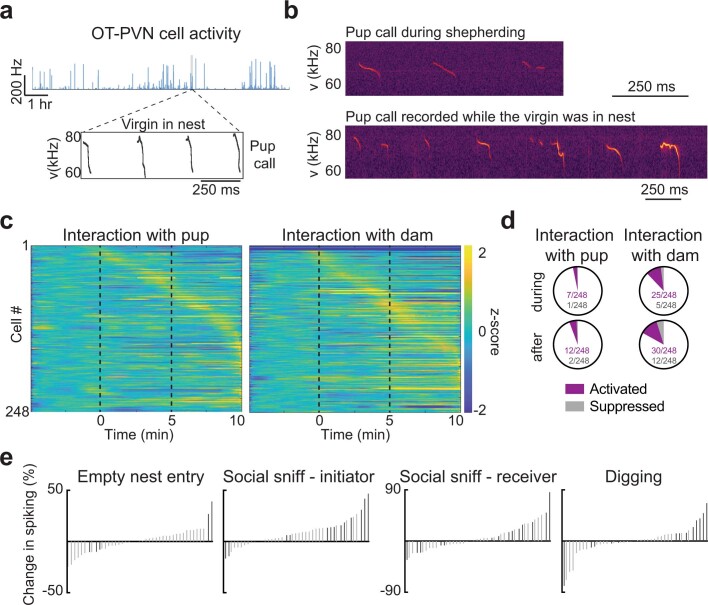
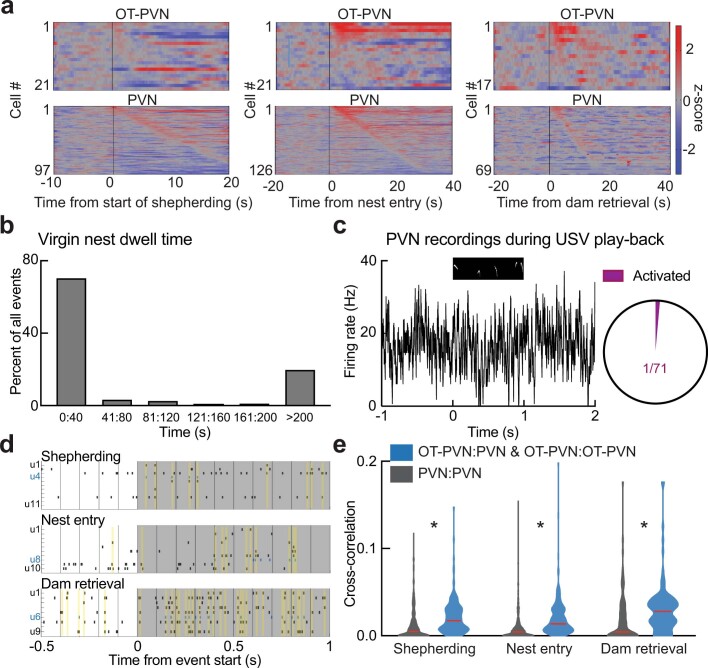
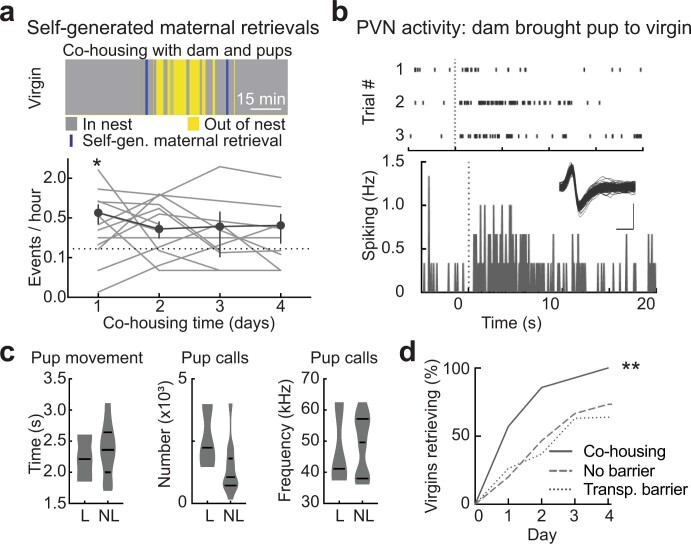
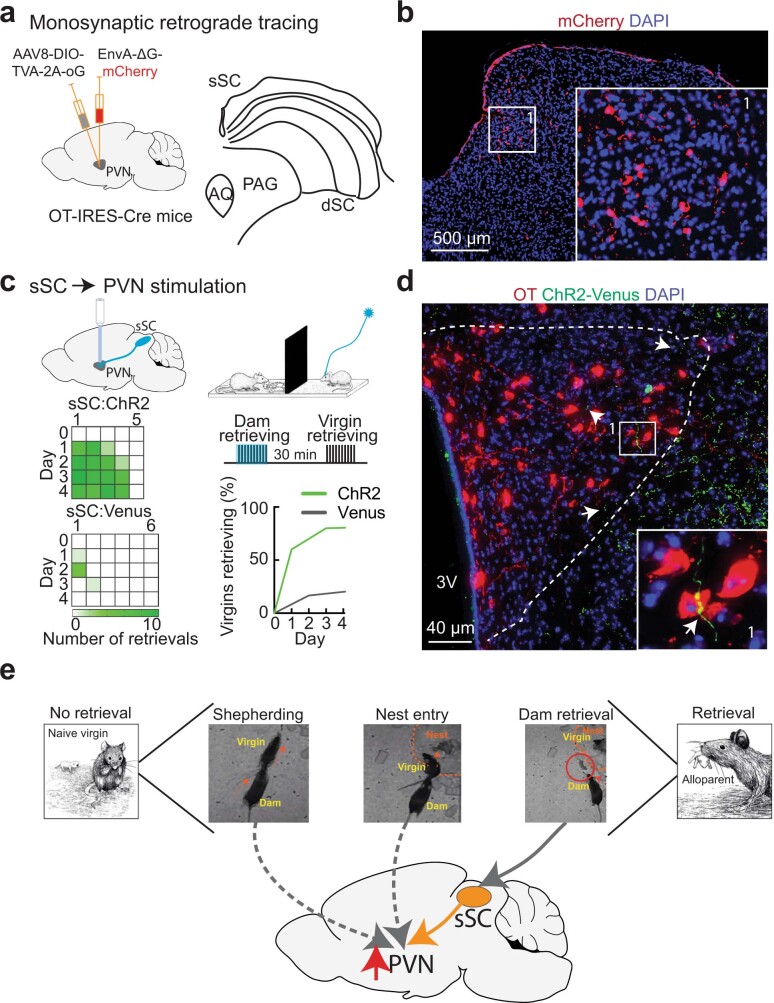
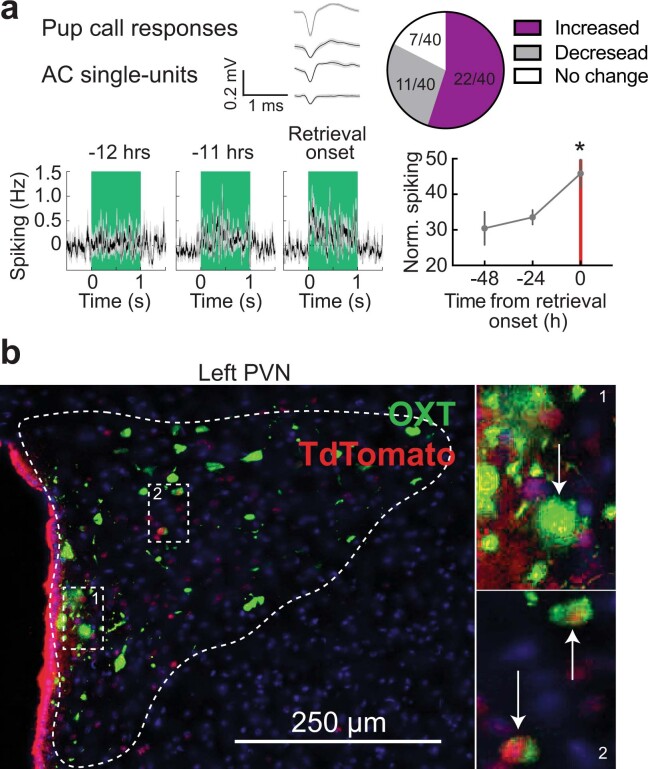
Maternal care, including by non-biological parents, is important for offspring survival1-8. Oxytocin1,2,9-15, which is released by the hypothalamic paraventricular nucleus (PVN), is a critical maternal hormone. In mice, oxytocin enables neuroplasticity in the auditory cortex for maternal recognition of pup distress15. However, it is unclear how initial parental experience promotes hypothalamic signalling and cortical plasticity for reliable maternal care. Here we continuously monitored the behaviour of female virgin mice co-housed with an experienced mother and litter. This documentary approach was synchronized with neural recordings from the virgin PVN, including oxytocin neurons. These cells were activated as virgins were enlisted in maternal care by experienced mothers, who shepherded virgins into the nest and demonstrated pup retrieval. Virgins visually observed maternal retrieval, which activated PVN oxytocin neurons and promoted alloparenting. Thus rodents can acquire maternal behaviour by social transmission, providing a mechanism for adapting the brains of adult caregivers to infant needs via endogenous oxytocin.


Conflict of interest statement

The authors declare no competing interests.

Figures

Fig. 1
Fig. 1. Dams shepherd virgins to nest.
a, System for continuous monitoring of behaviour and neural activity. b, Ethogram showing activities of co-housed dam and virgin mice over a period of four days. c, Co-housing with dam and pups led to earlier retrieval by virgins. Left, individual retrieval rates. Right, mean retrieval probability. d, Day of retrieval onset was earlier in D+ virgins. e, Time in nest for dams and co-housed virgin mice. f, Correlation between virgin nest entry during day 1 and virgin retrieval at the end of day 1. g, Illustration of shepherding behaviour; arrows, movement direction; dashed circle, nest area. h, Probabilities of dam starting (yellow) and ending (orange) chasing of a co-housed virgin, relative to nest position (circle indicates the nest, radius approximately 10 cm). i, Distances from nest of dam→virgin chases. j, Frequency of shepherding events (grey, individual dyads; red, daily averages across cages) was more frequent than dam→virgin chases in the absence of pups (0.2, indicated by dashed line). k, Correlation between shepherding during day 1 and virgin retrieval at day 1 end. Data are mean ± s.e.m.; *P < 0.05, **P < 0.01.
Fig. 2
Fig. 2. Shepherding and nest entry activate virgin PVN/OT-PVN neurons.
a, Left, DREADDi–mCherry in OT-PVN cells. Right, CNO treatment during initial co-housing reduced retrieval in DREADDi-expressing mice. b, Optically tagged OT-PVN neurons in vivo. Left, µCT image used to localize electrodes. Middle, ChETA–eGFP expression in OT-PVN neurons. Right, raster plot of photo-tagged OT-PVN neuron; inset, waveform; blue bar, light pulse. c, d, Raster plot (c) and before–after plot (d) of PVN single unit from co-housed virgin during shepherding (shading). e, Change in spiking rate during shepherding for individual units. Filled bars indicate significant changes in spiking rate. f, Units with significant rate changes during shepherding (red) fired less during virgin→dam chases (grey). g, Simultaneously recorded PVN cells including OT-PVN cell (u3) during nest entry event. Units are numbered u1–u9. h, u3 spiking during nest entry (n = 140 events). i, Firing rate during nest entry. j, Spiking rate when virgin entered nest after shepherding (red) or voluntarily (grey). Data are mean ± s.e.m.; *P < 0.05, **P < 0.01.
Fig. 3
Fig. 3. Observation of pup retrieval.
a, Illustration of spontaneous retrieval by dam; arrows, movement direction; dashed lines, nest area; red circle, dropped pup. b, Activities of simultaneously recorded virgin PVN cells including OT-PVN cell (blue) during spontaneous retrieval episode by dam. Green, pup dropped; grey, pup retrieval. Top, frequency of emitted sounds. c, Spiking rate change in virgins during spontaneous retrievals by dams. d, Heterogeneous responses (n = 35 (PVN), n = 9 (OT-PVN) units) during nest entry, shepherding, and maternal retrieval. Top, OT-PVN; bottom, PVN. e, Pup retrieval by D− virgins. f, Retrieval by D− virgins retrieval was higher after exposure to dam retrieval with or without a transparent barrier compared with an opaque barrier or with OXTR-KO virgins. g, Cumulative distributions (Kaplan–Meier) for retrieval onset. h, Example virgin PVN unit responding to both observation of maternal retrieval and self-performance of retrieval (time 0, pup retrieved). i, Change in virgin PVN firing rate for units recorded during observation of dam retrievals (blue) and self-performance (white). j, PVN unit activity increased during observation in learners (n = 65 units, N = 3 virgins) but not non-learners (n = 103 units, N = 5 virgins). *P < 0.05, **P < 0.01.
Fig. 4
Fig. 4. PVN modulation and plasticity of left auditory cortex.
a, Example photometry recording from virgin female left auditory cortex (AC). b, Change in photometry signal during co-housing in example animal. c, Summary of photometry data in AC.  d, Schematic of simultaneous auditory cortex photometry and PVN single-unit recording during retrieval observation with a transparent barrier. e, Example single-trial auditory cortex photometry (insets, pup vocalizations) and PVN spiking before (left) and after (right) virgin began retrieving. Time is zero at dam pup retrieval. f, Summary of single-trial responses during dam retrievals. g, Schematic of photometry from virgin PVN projections to left AC during transparent-barrier observations. h, Photometric responses of auditory cortex from virgin females during observation. Time is zero at dam pup retrieval. i, Single-trial (grey) and per-animal responses (red). j, Effect of OTA or saline infusion in non-co-housed virgin left auditory cortex before dam retrieval observation. k, Optogenetic stimulation (opto stim) of left auditory cortex OT-ChETA fibres during opaque-barrier testing increased virgin retrieval. Data are mean ± s.e.m.; *P < 0.05.
Extended Data Fig. 1
Extended Data Fig. 1. Behavioural ethograms from 3 pairs of animals.
Ethograms were constructed from visual analysis of continuous four-day videography by two to four independent observers. Dashed vertical lines indicate end of each day.
Extended Data Fig. 2
Extended Data Fig. 2. Pup retrieval over animals.
a, Retrieval probabilities of all virgins co-housed with just pups (D-, left) or with experienced dam and pups (D+, right). b, Summary of virign retrieval probabilities over days, color indicates retrieval success each day. c, Dam retrieval probability uniformly high across dams with different litter sizes (N=3 dams, p>0.9, Kruskal-Wallis test). Error bars, SEM.
Extended Data Fig. 3
Extended Data Fig. 3. Shepherding behaviour.
a, Average latency for dams to shepherd virgin to the nest (time 0 is virgin nest exit). Latency decreased over days of co-housing (day 1: 155.9±34 s; day 2: 136.1±17.94 s; day 3: 75.7±5.5 s; day 4: 93.9±8.5 s; n=676 events from N=9 dam-virgin pairs, p<0.0001, one-way ANOVA, Holm-Sidak’s multiple-comparison test). Red lines, medians. Error bars, SEM. b, Left, ethograms from two separate virgins, one co-housed just with dam without pups (top), the other co-housed with dam and pups (bottom). Note differences between time in nest and amount of shepherding when pups were present. Right, summary of shepherding events per hour when pups were removed vs when pups were present (‘No pups’: 0.2±0.1 events/hour; ‘Pups’: 3.5±0.9 events/hour, N=4, p=0.03, Student’s two-tailed paired t-test). Error bars, SEM. c, Locations of start (yellow) and end (orange) positions of dam→virgin chasing events without pups in the cage (N=4 dyads), relative to nest center (nest radius was ~10 cm, gray). 46.1±10.4% of dam→virgin chases ended in the nest, indicating that the frequency of these chases was significantly reduced but the direction of the virgins was comparable with or without pups (all chasing events ending in nest, p=0.9, two-sided Fisher’s exact test).
Extended Data Fig. 4
Extended Data Fig. 4. Controls for DREADDi-based impairment of oxytocin system during acquisition of pup retrieval behaviour.
a, Recordings in female mouse PVN brain slices. Left, current-clamp whole-cell recording from OT-PVN neuron expressing DREADDi-mCherry before (top) and after (bottom) CNO bath administration. Right, summary of chemogenetic suppression of OT-PVN neuronal firing in brain slices (‘hM4D(Di)-mCherry’ baseline firing rate before CNO: 8.8±1.7 Hz, after CNO: 0.6±0.1 Hz, n=7 cells from N=4 mice; ‘mCherry’ baseline firing rate before CNO: 4.8±0.6 Hz, after CNO: 5.0±0.9 Hz, n=8 cells from N=3 mice; two-way ANOVA with Sidak’s correction for multiple comparisons, p=0.0002 between baseline and CNO for hM4D(Di)-mCherry, p=0.9 between baseline and CNO for mCherry). Error bars, SEM. b, CNO in retrieving females that expressed DREADDi did not affect retrieval rates (baseline retrieval: 76.0±9.2%, N=5; CNO: 72.0±18.8%, N=5; saline: 92.0±8.0%, N=5; repeated measures ANOVA, p=0.332). Error bars, SEM.
Extended Data Fig. 5
Extended Data Fig. 5. Confirmation of opsin expression and targeting for optically tagged OT-PVN recordings.
a, Example immunostained tissue sections of PVN showing co-labeling of oxytocin peptide (red) and ChETA channelrhodopsin 2 conjugated to EGFP (green) together with DAPI labeling for cell density (blue). Insets show 2x magnified images to highlight the co-localization of red and green staining (arrows) in PVN cells. 84.8±7.2% of cells (N=6 animals) expressing ChETA also expressed oxytocin peptide. b, Verification of electrode locations in PVN with combined MRI/µCT. µCT imaging was performed after implantation and subsequently co-registered with a mouse MRI atlas to localize electrode bundles within PVN, as well as the separate fibre optic implanted for optogenetic identification of oxytocin neurons. Electrodes were then lowered at the end of each day of co-housing. Yellow/orange, µCT imaging of electrodes in situ. Images shown are from different animals.
Extended Data Fig. 6
Extended Data Fig. 6. PVN neurons in adult female virgin mice responded more robustly during interactions with dams than with pups.
a, Example of OT-PVN neuron instantaneous firing (top), synchronized with homecage behaviour (gray bar marks a nest entry episode), and with pup vocalizations (bottom), illustrates the different data streams recorded with our system. b, Example spectrograms of pup vocalizations and distress calls in home cage during shepherding and nest entry. c, Normalized (z-scored) spiking for 248 PVN neurons recorded during 5-minute interaction periods with pup (left) or a dam (right). Recordings sorted by peak activity. d, Proportion of activated (purple; z-score > 1.645, i.e. p < 0.05) and suppressed (gray, z-score < −1.645) PVN cells. During the 5-minute interaction periods, interactions with dam activated more virgin PVN cells than interactions with pups (with dam: 25/248, with pup: 7/248, p=0.001, two-sided Fisher’s exact test). After dam interactions, PVN cells continued to fire more than after interactions with pup (with dam: 30/248, with pup: 12/248, p=0.005). e, Social sniffing between the virgin and dam activated PVN neurons (9/43 neurons significantly activated while the virgin was sniffed, p=0.002; 11/43 neurons activated while the virgin sniffed the other adult, p=0.0005). A similar fraction of PVN neurons was activated during digging (8/43, p=0.005). Only a few PVN neurons were activated by entering an empty nest without pups (2/43, p=0.4). Dark bars, significantly modulated neurons. The proportion of PVN neurons activated during empty nest entry was smaller than the proportion of PVN neurons activated while being sniffed (two-sided Fisher’s exact test, p=0.04), during sniffing (p=0.01), and after entering a nest with pups (p=0.001). Fraction of cells responding during empty nest entry was also smaller than the proportion of OT-PVN neurons activated during shepherding (0.03), dam retrieval (p=0.01), and after entering a nest with pups (p=0.01).
Extended Data Fig. 7
Extended Data Fig. 7. PVN unit activity related to specific interactions with dams or pups.
a, Patterns of OT-PVN (top) and PVN (bottom) cell activity during shepherding (left; 5/21 OT-PVN neurons, Fisher’s exact test, p=0.02; 9/97 PVN neurons, p=0.001), nest entry (middle; 6/21 OT-PVN neurons, p=0.01; 33/126 PVN neurons, p=0.0001; shepherding vs voluntary entry, p=0.005, Wilcoxon signed-rank test) and dam retrieval (right; 5/17 OT-PVN neurons, p=0.02; 10/69 PVN neurons, p=0.0007). Recordings were aligned to start of interaction, and sorted by peak activity. b, Distribution of durations of time in nest for virgins after entry events. ~70% of all nest dwell times are ≤40 s. c, Left, example PSTH for PVN unit during play-back of pup distress calls (sonogram on top). Right, summary of PVN activity during pup call presentation. Almost all cells in virgin PVN were unresponsive, with only 1/71 PVN units having significant responses to pup vocalizations. d, Examples of simultaneously recorded unit spike trains aligned to onset of individual shepherding, nest entry, and dam retrieval events during co-housing. Blue, OT-PVN units. Yellow, periods of coincidental activity within 10 ms. e, Summary of average zero-lag pair correlations for each pair of simultaneously recorded units during each co-housing behaviour. Neuronal pairs including OT-PVN neurons (OT-PVN:OT-PVN and OT-PVN:PVN pairs) were more strongly correlated than PVN:PVN pairs (shepherding, n=530 pairs, p<0.0001; nest entry, n=776 pairs, p<0.0001; dam retrieval, n=278, p<0.0001; ANOVA and Tukey’s multiple-comparison test). Error bars, SEM.
Extended Data Fig. 8
Extended Data Fig. 8. Many virgins seem to learn retrieval from maternal demonstration.
a, Frequency of self-generated retrievals by dams. Top, example ethogram depicting two separate spontaneous retrievals by the dam (blue). Bottom, summary of individual dam spontaneous hourly pup retrieval rate per day (day one: 0.6±0.2 events/hour, day two: 0.3±0.1 events/hour, day three: 0.4±0.2 events/hour, day four: 0.4±0.2 events/hour, N=14). Lines, individual dam behaviour. Filled circles, daily average across animals. Dashed line, average rate of spontaneous retrieval for singly housed dams and litters without other adults (0.2±0.1 events/hour, N=5). Error bars, SEM. b, Virgin PVN responses when mother brought pups to virgin. For these animals, three separate pup delivery episodes occurred in a twenty-minute period after the second day of co-housing. On each of those occurrences, this PVN unit recorded in the virgin responded with increased spiking for several seconds until the dam returned to retrieve the pup herself. Top, raster of each of these three trials. Bottom, summary PSTH. Inset, spike waveforms; scale: 0.4 ms, 0.5 mV. c, Pup activity for non-co-housed virgins tested across transparent barrier, separated by virgins that began retrieving after observation (‘L’) and virgins that did not begin retrieving after observation (‘NL’). Left, pup movement (p=0.64, Student’s unpaired two-tailed t-test, N=16 animals: 3 learners, 13 non-learners). Middle, number of pup vocalizations (p=0.07). Right, pup call mean frequency (p=0.77). Error bars, SEM. d, Onset of retrieval behaviour was faster in co-housed virgins relative to non-co-housed virgins exposed to retrievals behind transparent barrier or with no barrier (Mantel-Cox test, p=0.004, N=48 mice total). **, p<0.01.
Extended Data Fig. 9
Extended Data Fig. 9. Superior colliculus input to PVN enhances acquisition of pup retrieval.
a, In Oxy-IRES-Cre virgins, we injected an AAV helper virus into PVN, followed two weeks later by injecting a rabies virus that carried mCherry fluorescent protein. Left, retrograde monosynaptic input tracing to OT-PVN neurons. Right, SC anatomy (AQ, aqueduct; PAG, periaqueductal gray; dSC, deep SC layers). b, We examined visual structures for mCherry expression (areas providing direct projections to OT-PVN cells). Immunohistochemistry showing mCherry+ cells (red) in the medial superficial layers of ipsilateral SC monosynaptically projecting to OT-PVN neurons. Blue, DAPI stain for cell number. Replicates from N=2 animals. c, Top, schematic of experimental design for optogenetic stimulation in PVN of fibres from ipsilateral sSC expressing ‘ChR2-Venus’ or ‘Venus’, during the ‘opaque barrier’ condition (‘Dam retrieving’ and ‘Virgin retrieving’, 10 pup retrieval trials per session; blue, optogenetic stimulation occurring during dam retrieval). Bottom left, individual performance on pup retrieval testing after each observation session. Bottom right, summary of behavioural data (Kaplan-Meier). d, Immunohistochemistry showing fibres from sSC (green, arrows) innervating PVN including near OT-PVN neurons (insert). Red, oxytocin neurons; green, Venus; blue, DAPI. 3V, third ventricle. Replicates from N=3 animals. e, Schematic of overall hypothesis connecting behavioural interactions between dam and virgin during co-housing to activation of PVN and OT-PVN neurons (red arrow).
Extended Data Fig. 10
Extended Data Fig. 10. Oxytocinergic modulation from PVN promotes plasticity of AC pup call responses.
a, Emergence of pup call responses in left auditory cortex preceded retrieval onset; from 71 units recorded in five animals, 40 units in two animals were maintained throughout co-housing (22/40 units significantly increased activity, 11/40 units significantly decreased activity, mean single-unit response across all 40 units to best pup call 48 h before retrieval onset: 30.4±4.6% increase relative to baseline, spiking 24 h before retrieval: 33.5±2.0% increase, spiking on day of first retrieval: 45.8±3.9% increase, p=0.009, one-way ANOVA, n=40 units). Gray shading on unit waveforms represents SEM. b, Immunostained tissue section of PVN showing co-labeling of oxytocin peptide (green) and GCaMP6s expressed together with TdTomato (red). Replicates from N=3 animals.

References

    1. Insel TR, Young LJ. The neurobiology of attachment. Nat. Rev. Neurosci. 2001;2:129–136. doi: 10.1038/35053579. - DOI - PubMed
    1. Dulac C, O’Connell LA, Wu Z. Neural control of maternal and paternal behaviors. Science. 2014;345:765–770. doi: 10.1126/science.1253291. - DOI - PMC - PubMed
    1. Feldman R. The neurobiology of human attachments. Trends Cogn. Sci. 2017;21:80–99. doi: 10.1016/j.tics.2016.11.007. - DOI - PubMed
    1. Opendak M, Gould E, Sullivan R. Early life adversity during the infant sensitive period for attachment: programming of behavioral neurobiology of threat processing and social behavior. Dev. Cogn. Neurosci. 2017;25:145–159. doi: 10.1016/j.dcn.2017.02.002. - DOI - PMC - PubMed
    1. Wilson, E. O. Sociobiology: The New Synthesis (Harvard Univ. Press, 1975).

Publication types