. 2021 Aug;28(8):652-661.
doi: 10.1038/s41594-021-00632-3. Epub 2021 Aug 11.

DNA interference states of the hypercompact CRISPR-CasΦ effector

Affiliations

DNA interference states of the hypercompact CRISPR-CasΦ effector

Patrick Pausch et al. Nat Struct Mol Biol. 2021 Aug.

Abstract

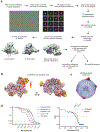
CRISPR-CasΦ, a small RNA-guided enzyme found uniquely in bacteriophages, achieves programmable DNA cutting as well as genome editing. To investigate how the hypercompact enzyme recognizes and cleaves double-stranded DNA, we determined cryo-EM structures of CasΦ (Cas12j) in pre- and post-DNA-binding states. The structures reveal a streamlined protein architecture that tightly encircles the CRISPR RNA and DNA target to capture, unwind and cleave DNA. Comparison of the pre- and post-DNA-binding states reveals how the protein rearranges for DNA cleavage upon target recognition. On the basis of these structures, we created and tested mutant forms of CasΦ that cut DNA up to 20-fold faster relative to wild type, showing how this system may be naturally attenuated to improve the fidelity of DNA interference. The structural and mechanistic insights into how CasΦ binds and cleaves DNA should allow for protein engineering for both in vitro diagnostics and genome editing.


Figures

Extended Data Fig. 1
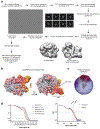
Extended Data Fig. 1. Cryo-EM data processing for CasΦ in the binary state.
a, Cryo-EM data processing schematic. b, Local resolution map for the final cryoSPARC map calculated in cryoSPARC v3.1 with FSC threshold 0.5. Figure was generated in Chimera v.1.14 using the Surface color function and Chimera map sigma level 3.67 with dust removal size 5. c, Particle orientation distribution plot. d, Left: Gold standard FSC curves for the binary complex from the final round of the refinement in cryoSPARC v.3.1. Right: Map vs model FSC plots of the final binary model refined to the LocSpiral map and plotted with the final cryoSPARC sharp experimental map.
Extended Data Fig. 2
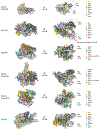
Extended Data Fig. 2. The architecture of CasΦ is similar to, but distinct from the architecture of large type V effectors.
For comparison to CasΦ (above), ternary structures of a representative set of type V effectors in the crRNA (Cas12a and Cas12i), or crRNA/tracrRNA (Cas12b, CasX and Cas14), and DNA bound states are shown. Ternary states were selected for comparison, since binary structures were not available for all effectors. Structures are shown as colored cartoons. Domains are color coded according to the legend on the right. Following models were used to prepare the figure: CasΦ binary structure (this study); Cas12a (PDB-ID: 6I1K ); Cas12b (PDB-ID: 5WTI ); CasX (PDB-ID: 6NY2 ); Cas14 (PDB-ID: 7C7L ) and Cas12i (PDB-ID: 6W5C ).
Extended Data Fig. 3
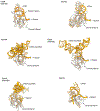
Extended Data Fig. 3. A Cas12-typical OBD domain recruits the crRNA to CasΦ.
For comparison to CasΦ (above, left), the OBD domains from representative type V effectors in the crRNA (Cas12a and Cas12i), or crRNA/tracrRNA (Cas12b, CasX and Cas14), and DNA bound states are shown. Following models were used to prepare the figure: CasΦ binary structure (this study); Cas12a (PDB-ID: 6I1K ); Cas12b (PDB-ID: 5WTI ); CasX (PDB-ID: 6NY2 ); Cas14 (PDB-ID: 7C7L ) and Cas12i (PDB-ID: 6W5C ).
Extended Data Fig. 4
Extended Data Fig. 4. Cryo-EM data processing for CasΦ in the ternary state.
a, Cryo-EM data processing schematic. b, Local resolution map for the final cryoSPARC map calculated in cryoSPARC v3.1 with FSC threshold 0.5. Figure was generated in Chimera v.1.14 using the Surface color function and Chimera map sigma level 3.71 with dust removal size 5. c, Particle orientation distribution plot. d, Left: Gold standard FSC curves for the binary complex from the final round of the refinement in cryoSPARC v.3.1. Right: Map vs model FSC plots of the final binary model refined to the LocSpiral map and plotted with the final cryoSPARC sharp experimental map.
Extended Data Fig. 5
Extended Data Fig. 5. Superhelical DNA is efficiently cut in the presence of alternative PAMs.
a, dsDNA cleavage assay in probing the ability of CasΦ to cleave linear PCR fragments (left) and supercoiled plasmid targets (right) in dependence of different PAM motifs. b, Quantified cleavage efficiencies for linear PCR fragments (left) and supercoiled plasmid targets (right) in dependence of different PAM motifs. (n = 3 independent reaction replicates; means ± SD). c, Analytical agarose gel electrophoresis images of three subsequently run independent technical replicates corresponding to the plot shown in b. Samples were processed in parallel.
Extended Data Fig. 6
Extended Data Fig. 6. Helix α7 repositions close to the NTS upon transition from the binary to the ternary state.
CasΦ in the ternary state is shown as a colored cartoon. To highlight the rearrangement of Helix α7 (arrow), the structure of CasΦ in the binary state (purple) was superimposed to the ternary state structure. For clarity, only the RecI domain of the CasΦ binary structure is shown.
Extended Data Fig. 7
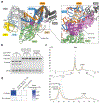
Extended Data Fig. 7. The lid-loop associates with the crRNA:TS duplex in the ternary state.
a, CasΦ in the ternary state is shown as a colored cartoon. The lid-loop element is highlighted in purple and the corresponding LocSpiral cryo-EM map around residues 610-638 is shown as a translucent surface, contoured at 12 σ. b, dsDNA cleavage assay probing the ability of WT and mutant CasΦ to cleave linear PCR fragments. Shown is the analytical agarose gel electrophoresis image of three independent reaction replicates that were processed in parallel. Analyzed time point, t = 1h. c, analytical size-exclusion chromatogram showing that the analyzed variants elute as single peaks. d, FQ-assay testing the ability of wild type and variant CasΦ to indiscriminately cut the FQ-reporter in dependence of a crRNA complementary ssDNA activator at a concentration of 2 nM. (n = 3 independent reaction replicates; means).
Extended Data Fig. 8
Extended Data Fig. 8. Cryo-EM data processing for CasΦ in the ternary state with phosphorothioate DNA and Mg2+.
a, Cryo-EM data processing schematic. b, Local resolution map for the final cryoSPARC map calculated in cryoSPARC v3.1 with FSC threshold 0.5. Figure was generated in Chimera v.1.14 using the Surface color function and Chimera map sigma level 4.75 with dust removal size 5. c, Particle orientation distribution plot. d, Left: Gold standard FSC curves for the binary complex from the final round of the refinement in cryoSPARC v.3.1. Right: Map vs model FSC plots of the final binary model refined to the LocSpiral map and plotted with the final cryoSPARC sharp experimental map.
Extended Data Fig. 9
Extended Data Fig. 9. The PAM-distal TS is single-stranded.
Above: Overview of the LocSpiral map (left panel, colored volume, contoured at 7.6 σ) and model of CasΦ (right panel) in the ternary state in presence of the phosphorothioate NTS-DNA and the magnesium cofactors (purple spheres). Below: Close up onto the DNA arrangement observed in the ternary structure. The hexagons (magenta) highlight the active site (AS).
Extended Data Fig. 10
Extended Data Fig. 10. 3D variability analysis of heterogeneous DNA states around the active site.
Shown are two 90°-rotated views of the states observed in the 3DVA for the CasΦ ternary complexes in absence (above) and presence (below) of the magnesium cofactor. Two distinct states (frame 1 and frame 20) for each mode are shown to highlight the structural heterogeneity. Purple density indicates density corresponding to dynamic DNA, not accounted for by our model.
Fig. 1:
Fig. 1:. Structure of the crRNA-bound CasΦ poised for DNA recognition.
a, Scheme illustrating the genomic locus and function of CRISPR-CasΦ. b, Above: Domain organization of CasΦ. Domain coloring is used throughout the manuscript. Purple hexagons highlight the position of the active site. Below: crRNA sequence and secondary structure. c, Cryo-EM maps of CasΦ-crRNA. The high resolution LocSpiral (colored surface), contoured at 11 σ (map level/root-mean-square deviation from zero (RMS)) and unfiltered cryoSPARC (translucent surface), contoured at 3.4 σ are shown, to highlight defined areas and flexible regions, respectively. d, Structure model of CasΦ-crRNA. e, Close-up view centered on the RuvC lid loop structure (dashed circle).
Fig. 2:
Fig. 2:. Minimal domains mediate DNA recognition by CasΦ.
a, R-loop organization scheme. b, Cryo-EM maps of CasΦ-crRNA:DNA. The LocSpiral (colored surface), contoured at 10 σ, and unfiltered cryoSPARC (translucent surface), contoured at 3.3 σ, are shown. c, Structure model of CasΦ-crRNA:DNA in two 90°-rotated orientations. d, Left: Close up view of the PAM base pairs in positions −2 (left panel), −1 (middle panel) and 0 (right panel). Amino acid side chains in proximity to the base pairs are shown as sticks. The LocSpiral map (colored surface) is shown as a translucent surface. Right: Filter binding assay testing for the ability of variant CasΦ proteins to bind DNA (n = 3 independent reaction replicates; means ± SD). Raw data are shown in Supplementary Fig. 2b. Numerical source data for panel d are available online.
Fig. 3:
Fig. 3:. DNA unwinding and target recognition activate CasΦ for DNA cutting.
a, Structural alignment of an ideal B-form DNA duplex to the PAM-proximal DNA segment of the CasΦ ternary complex. Base pairs are not shown for clarity. b, Left: Close-up views onto the PI domain and RuvC helix α13, close to the ideal B-form DNA. Right: Filter binding assay testing for the ability of variant CasΦ proteins to bind DNA. (n = 3 independent reaction replicates; means ± SD). Raw data are shown in Supplementary Fig. 2d. c, Superimposition of the binary state (orange) and ternary state (blue) highlighting the rearrangement (arrows) of RecI and RecII. Structures were aligned via the RuvC β-strands 10 and 11 to visualize the rearrangement relative to the RuvC center. d, Left: Close up view of the RecII and RuvC domains superposition highlighting the lid loop rearrangement (bold arrow). Right: Close up view of the RuvC mixed β-sheet. The peptide backbones of parallel β-strands 10 and 13, including the side chains of E606 and D394 (inset), are shown as sticks. e, Filter binding assay testing for the ability of variant CasΦ proteins to bind DNA. (n = 3 independent reaction replicates; means ± SD). Active site mutants were assayed in the presence (left panel) and absence (right panel) of the RuvC Mg2+ cofactor. Raw data are shown in Supplementary Fig. 2e,f. Numerical source data for panels b and e are available online.
Fig. 4:
Fig. 4:. Structure of CasΦ with a trapped substrate in the active site.
a, R-loop organization scheme. Asterisks indicate the positions of phosphorothioate(PS)-DNA modifications. b, Cryo-EM maps of CasΦ-crRNA:PS-DNA in presence of Mg2+. The LocSpiral (colored surface), contoured at 10 σ, and unfiltered cryoSPARC (translucent surface), contoured at 4.2 σ, are shown. c, Structure model of CasΦ-crRNA:PS-DNA + Mg2+ (cartoon). The PS-DNA nucleoside moieties are shown as sticks within the active site. Mg2+ cofactors are colored in magenta. d, Close-up view on the PS-DNA substrate and Mg2+ cofactors within the RuvC active site. The LocSpiral map (blue mesh) is shown contoured at 7 σ. e, Overview of the RuvC active site. Only amino acid side chains close to the two Mg2+ cofactors are shown for clarity. f, DNA-cleavage mechanism. Waters that contribute to the expected octahedral coordination sphere of the two magnesium cofactors are not shown.
Fig. 5:
Fig. 5:. Helix α7 of the RecI domain regulates substrate accessibility of the RuvC.
a, Close up on the nucleic acids and α7 above the RuvC active site. The bold line highlights the steric α7 barrier, blocking the TS path (arrow). Nucleic acid backbones are shown as bands. b, Detailed view of helix α7 as seen from the RuvC. Biochemically analyzed residues are shown as sticks. Arrows indicate directions of the nucleic acids. c, TS (dark blue curve) and NTS (light blue curve) cleavage efficiency of variant CasΦ. Derived reaction rate constants are shown above the X-axis. (n = 3 independent reaction replicates; means ± SD). Raw data are shown in Supplementary Fig. 7. Numerical source data for panel c are available online.
Fig. 6:
Fig. 6:. Helix α7 adjusts fidelity and can be engineered for sensitive nucleic acid detection.
a, crRNA:TS duplex base pair mismatch assay for WT (orange bars) and vCasΦ (blue bars). (n = 3 independent reaction replicates; means ± SD). Raw data are shown in Supplementary Fig. 10. b, Left: Scheme illustrating the in vitro nucleic acid detection FQ assay. Right: FQ assay for detection of 2 nM ssDNA-activator by WT and engineered CasΦ. (n = 3 independent reaction replicates; means ± SD). c, FQ-assay for detection of pico-molar ssDNA-activator concentrations by WT and nCasΦ. (n = 3 independent reaction replicates; means ± SD). d, Mismatch-FQ-assay probing the FQ-reporter cleavage in presence of activators with single (left) and double (right) mismatches. Only end-point data at time = 2 h are shown. Graphs of the full time course for the various mismatches are shown in Supplementary Figs. 11 and 12. e, Model for CasΦ mediated DNA interference. Numerical source data for panels a-d are available online.

References

    1. Barrangou R et al. CRISPR provides acquired resistance against viruses in prokaryotes. Science 315, 1709–1712 (2007). - PubMed
    1. Makarova KS et al. Evolutionary classification of CRISPR-Cas systems: a burst of class 2 and derived variants. Nat. Rev. Microbiol 18, 67–83 (2020). - PMC - PubMed
    1. Knott GJ & Doudna JA CRISPR-Cas guides the future of genetic engineering. Science 361, 866–869 (2018). - PMC - PubMed
    1. Swarts DC & Jinek M Cas9 versus Cas12a/Cpf1: Structure-function comparisons and implications for genome editing. Wiley Interdiscip. Rev. RNA e1481 (2018). - PubMed
    1. Gleditzsch D et al. PAM identification by CRISPR-Cas effector complexes: diversified mechanisms and structures. RNA Biol. 16, 504–517 (2019). - PMC - PubMed

METHODS REFERENCES

    1. Punjani A, Zhang H & Fleet DJ Non-uniform refinement: adaptive regularization improves single-particle cryo-EM reconstruction. Nat. Methods 17, 1214–1221 (2020). - PubMed
    1. Kaur S et al. Local computational methods to improve the interpretability and analysis of cryo-EM maps. Cold Spring Harbor Laboratory 2020.05.11.088013 (2020) doi:10.1101/2020.05.11.088013. - DOI - PMC - PubMed
    1. Bepler T et al. Positive-unlabeled convolutional neural networks for particle picking in cryo-electron micrographs. Nat. Methods 16, 1153–1160 (2019). - PMC - PubMed
    1. Punjani A & Fleet DJ 3D Variability Analysis: Resolving continuous flexibility and discrete heterogeneity from single particle cryo-EM. Cold Spring Harbor Laboratory 2020.04.08.032466 (2021) doi:10.1101/2020.04.08.032466. - DOI - PubMed
    1. Emsley P & Cowtan K Coot: model-building tools for molecular graphics. Acta Crystallogr. D Biol. Crystallogr 60, 2126–2132 (2004). - PubMed

Publication types

MeSH terms