. 2021 Jul 9;24(8):102832.
doi: 10.1016/j.isci.2021.102832. eCollection 2021 Aug 20.

Super-multiplex imaging of cellular dynamics and heterogeneity by integrated stimulated Raman and fluorescence microscopy

Affiliations

Super-multiplex imaging of cellular dynamics and heterogeneity by integrated stimulated Raman and fluorescence microscopy

Jingwen Shou et al. iScience. .

Abstract

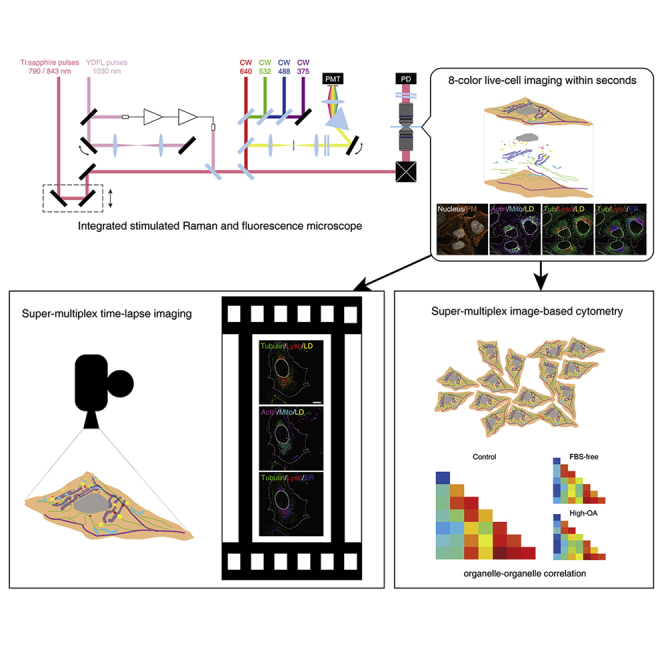
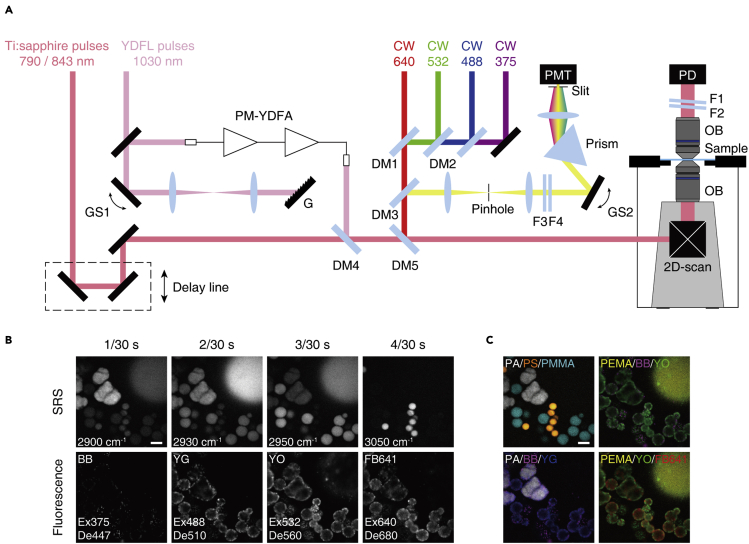
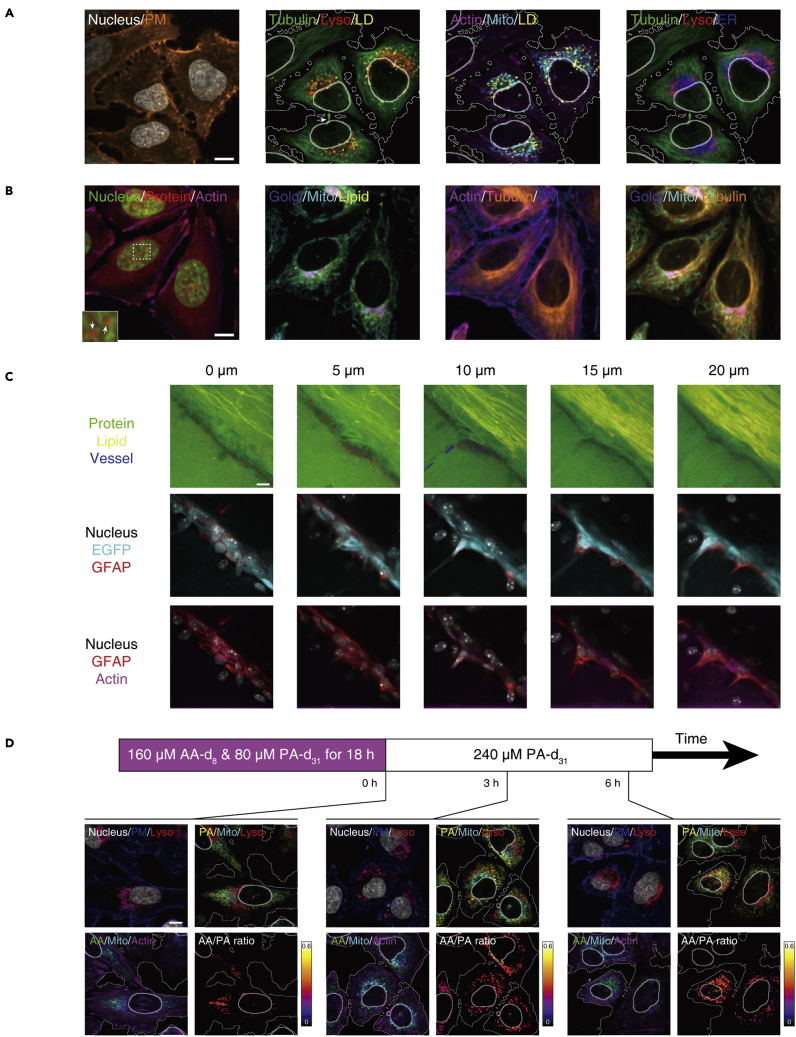
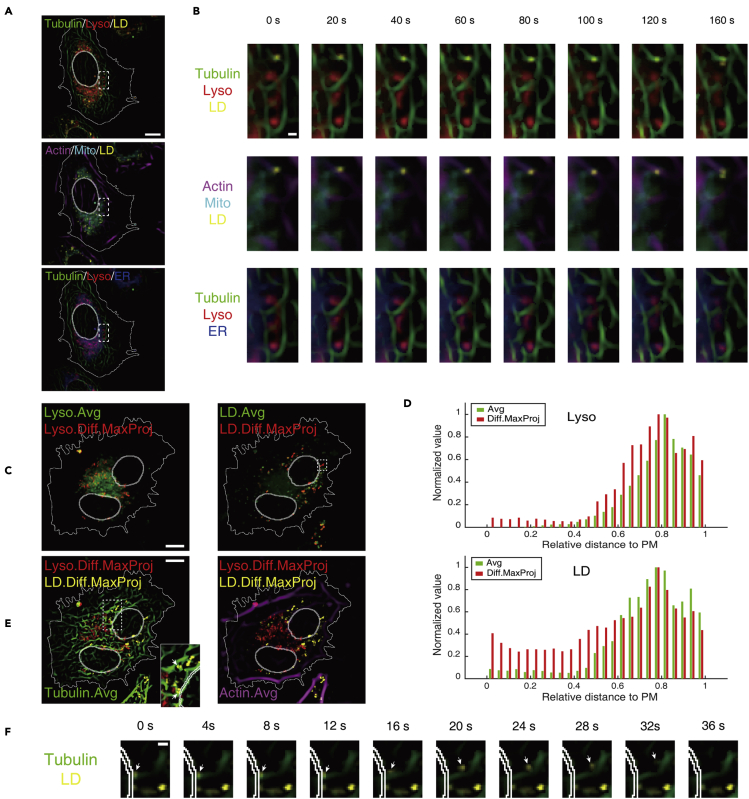
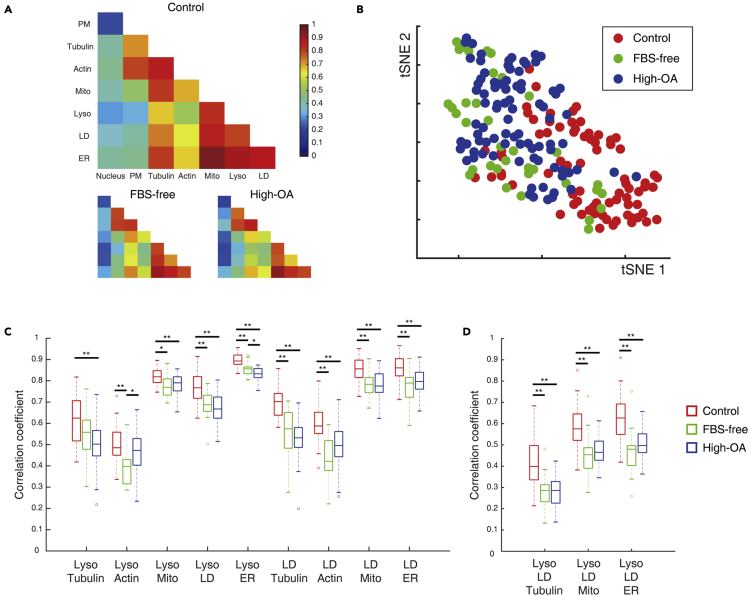
Observing multiple molecular species simultaneously with high spatiotemporal resolution is crucial for comprehensive understanding of complex, dynamic, and heterogeneous biological systems. The recently reported super-multiplex optical imaging breaks the "color barrier" of fluorescence to achieve multiplexing number over six in living systems, while its temporal resolution is limited to several minutes mainly by slow color tuning. Herein, we report integrated stimulated Raman and fluorescence microscopy with simultaneous multimodal color tunability at high speed, enabling super-multiplex imaging covering diverse molecular contrasts with temporal resolution of seconds. We highlight this technique by demonstrating super-multiplex time-lapse imaging and image-based cytometry of live cells to investigate the dynamics and cellular heterogeneity of eight intracellular components simultaneously. Our technique provides a powerful tool to elucidate spatiotemporal organization and interactions in biological systems.

Keywords: Biological sciences research methodologies; Cell biology; Optics.


Conflict of interest statement

The authors declare no competing interests.

Figures

None
Graphical abstract
Figure 1
Figure 1
Super-multiplex imaging by integrated stimulated Raman and fluorescence microscopy (A) Schematic of integrated stimulated Raman and fluorescence microscopy. The wavelength tuning of SRS and fluorescence is achieved by controlling the angles of two galvanometric scanners and the temporal modulation of continuous-wave lasers. YDFL, ytterbium doped fiber laser; CW, continuous-wave laser; PM-YDFA, two-stage polarization-maintaining ytterbium doped fiber amplifier; GS, galvanometric scanner; G, grating; DM, dichroic mirror; OB, objective lens; F, dielectric filter; PD, Si-photodiode; PMT, photomultiplier. (B) High-speed multicolor SRS and fluorescence imaging of chemical mixture. By specifying different imaging parameters for each frame, eight kinds of contrasts were observed within 133 ms. Ex, excitation wavelength in nm; De: detected central wavelength in nm. (C) Merge of decomposed SRS images and original fluorescence images from raw data in B, representing four kinds of polymers and four kinds of fluorophores. Polymer: PA, polyamide; PEMA, poly(ethyl methacrylate); PMMA, poly(methyl methacrylate); PS, polystyrene. Fluorophore: BB, Bright Blue; YG, Yellow Green; YO, Yellow Orange; FB641, Fluoresbrite 641. Scale bars, 10 μm. (See also Figure S1).
Figure 2
Figure 2
Super-multiplex imaging of biological specimens covering diverse molecular contrasts (A) 8-color organelle imaging of live HeLa cells labeled by eight kinds of organelle-targeted Raman and fluorescent probes. SRS: mitochondria (Mito), lysosomes (Lyso), lipid droplets (LD), ER fluorescence: nucleus, plasma membrane (PM), tubulin, actin. The multiplexed images acquired within 30 s display cells undergoing cytokinesis as well as the distribution of all eight kinds of organelles. The arrow indicates the position of midbody. (B) 8-color imaging of live HeLa cells including label-free SRS imaging. SRS: protein, lipid; fluorescence: nucleus, Mito, PM, Golgi apparatus, tubulin, actin. The total acquisition time was 2 s. Inset shows a magnified view of the area indicated by the dashed box. The arrows indicate the positions of nucleoli. (C) 7-color depth-resolved imaging of fixed brain tissue slice from CAG-EGFP mouse including label-free SRS imaging. SRS: protein, lipid, blood vessel; fluorescence: nucleus, EGFP driven by a ubiquitous CAG promoter, glial fibrillary acidic protein (GFAP), actin. The acquisition time of seven images at each depth was 16 s, i.e. 80 s for all five depths. (D) 7-color pulse-chase imaging of live HeLa cells including metabolic imaging. SRS: metabolites of palmitic acid-d31 (PA) and arachidonic acid-d8 (AA); fluorescence: nucleus, Mito, PM, Lyso, actin. The total acquisition time of every seven images was 2 s. The images of AA/PA ratio were calculated from the metabolite images of PA and AA. The contours of nucleus and PM were depicted with solid lines. Scale bars, 10 μm. (See also Figure S2 and S3).
Figure 3
Figure 3
Super-multiplex time-lapse organelle imaging of live cells (A and B) 8-color time-lapse organelle imaging of live HeLa cells with a temporal resolution of 20 s. (A) Micrographs at the first time point. (B) Time-lapse images in the area indicated by the dashed box in (A). (C–F) 6-color time-lapse organelle imaging of live HeLa cells with a temporal resolution of 4 s. (C) Comparison of average images and projected difference images of Lyso and LD. (D) Histograms of the normalized sum signal intensity along relative distance to PM, representing distribution analysis of average and projected difference images of Lyso and LD. (E) Simultaneous visualization of projected difference images of Lyso and LD with average images of tubulin and actin. Inset shows a magnified view of the area indicated by the dashed box. The arrows indicate the LDs oscillating in certain directions. (F) Time-lapse images in the area indicated by the dashed box in C show a continuous transport of LD along tubulin in the juxtanuclear region. The arrows indicate the positions of the transported LD. The contours of nucleus and PM were depicted with solid lines. Scale bars, 10 μm (A, C, and E), 1 μm (B and F). (See also Figures S4–S6, Videos S1 and S2).
Figure 4
Figure 4
Super-multiplex time-lapse imaging of live cells including metabolite imaging Seven kinds of molecular contrasts of live HeLa cells were observed with a temporal resolution of 2 s. (A) Micrographs at the first time point. (B) The image of AA/PA ratio at the first time point. (C) Simultaneous visualization of average image and projected difference image of PA metabolites together with average images of Mito, Lyso and actin. (D) Time-lapse images in the area indicated by the upper dashed box in A showing shortening of Mito along actin and small movement of large LD. The arrows indicate the initial positions of the mitochondria edge and the large LD. (E) Time lapse images in the area indicated by the lower dashed box in A showing fast motion of lysosome. The arrows indicate the positions of the moving lysosome. (F) Scatterplots of AA/PA ratio versus relative distance to PM, signal intensity of PA metabolites, Mito, Lyso and actin in the adjacent area. The contours of nucleus and PM were depicted with solid lines. Scale bars, 10 μm (A–C), 1 μm (D and E). (See also Figure S7, Video S3).
Figure 5
Figure 5
Single-cell analysis of cell-to-cell heterogeneity in organelle interactome by super-multiplex image-based cytometry of live cells Live HeLa cells grown in different culture conditions, i.e. control medium (control, n = 75), FBS-free medium (FBS-free, n = 36) and high oleic acid medium (high-OA, n = 86), were investigated by 8-color organelle imaging. The throughput was 2 FOV/min. (A) Matrix representation of medians of organelle correlation coefficients. (B) t-SNE plot generated from high-dimensional dataset via dimensionality reduction to show cell-to-cell heterogeneity. (C and D) Box whisker plots of different binary correlation coefficients (C) and ternary correlation coefficients (D). The line in the center of each box represents the median value, the upper and lower edges of the boxes represent the 75th and 25th quantile of the data, and the upper and lower fences represent the furthest observations within the whisker lengths. Observations beyond the whisker lengths are marked as outliers. ∗p < 0.05, ∗∗p < 0.01 (unpaired, two-tailed t test). (See also Figure S8).

Similar articles

Cited by

References

    1. Angelo M., Bendall S., Finck R., Hale M., Hitzman C., Borowsky A., Levenson R., Lowe J., Liu S., Zhao S. Multiplexed ion beam imaging of human breast tumors. Nat. Med. 2014;20:436–442. doi: 10.1038/nm.3488. - DOI - PMC - PubMed
    1. Azemtsop Matanfack G., Rüger J., Stiebing C., Schmitt M., Popp J. Imaging the invisible—bioorthogonal Raman probes for imaging of cells and tissues. J. Biophotonics. 2020;13:e202000129. doi: 10.1002/jbio.202000129. - DOI - PubMed
    1. Boutros M., Heigwer F., Laufer C. Microscopy-based high-content screening. Cell. 2015;163:1314–1325. doi: 10.1016/j.cell.2015.11.007. - DOI - PubMed
    1. Camp C., Jr., Cicerone M. Chemically sensitive bioimaging with coherent Raman scattering. Nat. Photon. 2015;9:295–305. doi: 10.1038/nphoton.2015.60. - DOI
    1. Chen W., Lemieux G., Camp C., Chang T., Ashrafi K., Cicerone M. Spectroscopic coherent Raman imaging of Caenorhabditis elegans reveals lipid particle diversity. Nat. Chem. Biol. 2020;16:1087–1095. doi: 10.1038/s41589-020-0565-2. - DOI - PMC - PubMed

LinkOut - more resources