. 2021 Jul 19;24(8):102868.
doi: 10.1016/j.isci.2021.102868. eCollection 2021 Aug 20.

Transgenic modeling of Ndr2 gene amplification reveals disturbance of hippocampus circuitry and function

Affiliations

Transgenic modeling of Ndr2 gene amplification reveals disturbance of hippocampus circuitry and function

Deniz A Madencioglu et al. iScience. .

Abstract

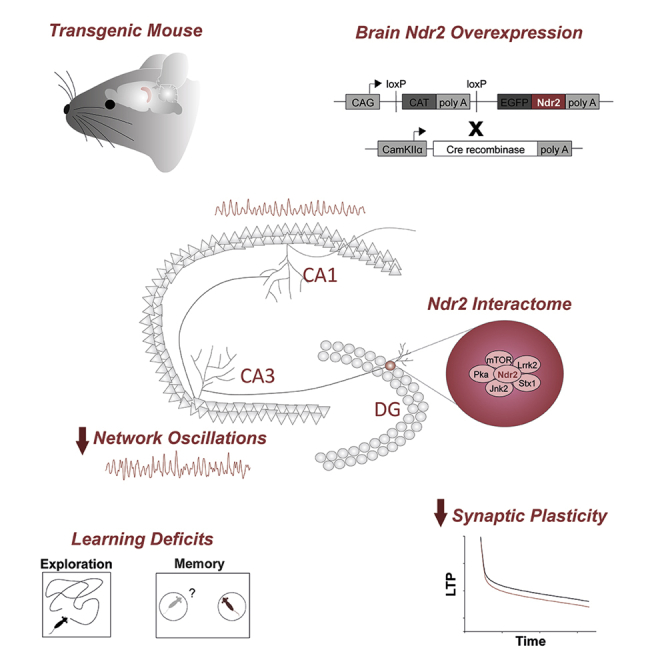
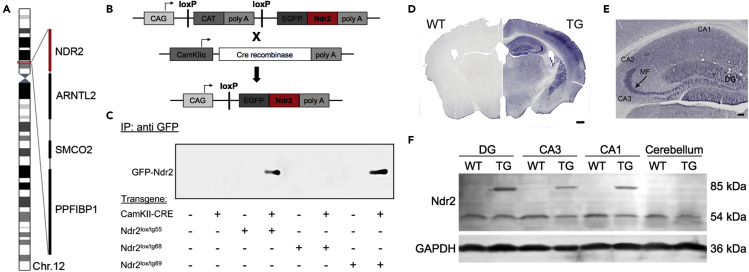
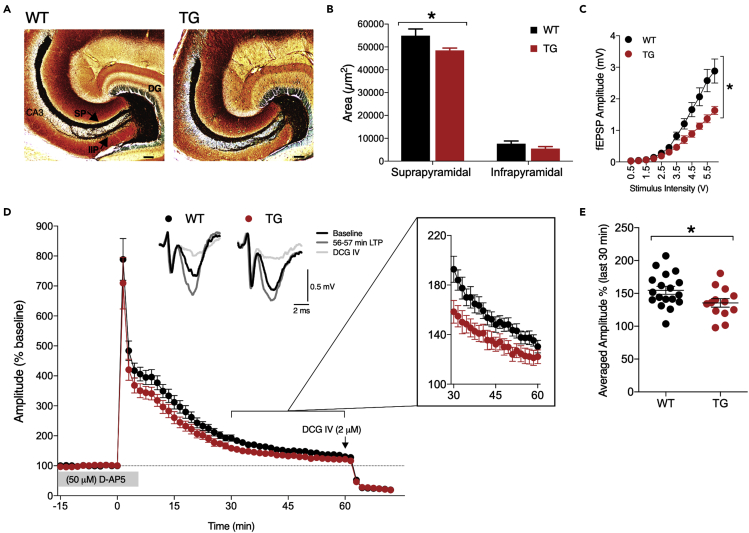
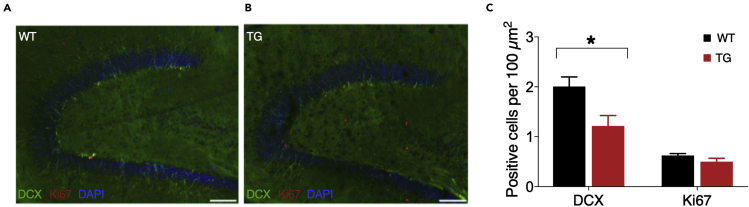
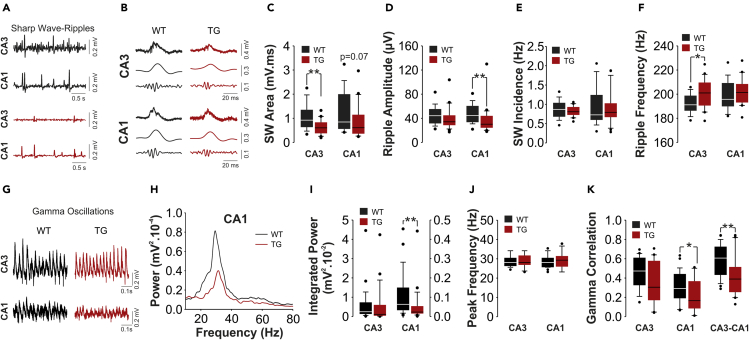
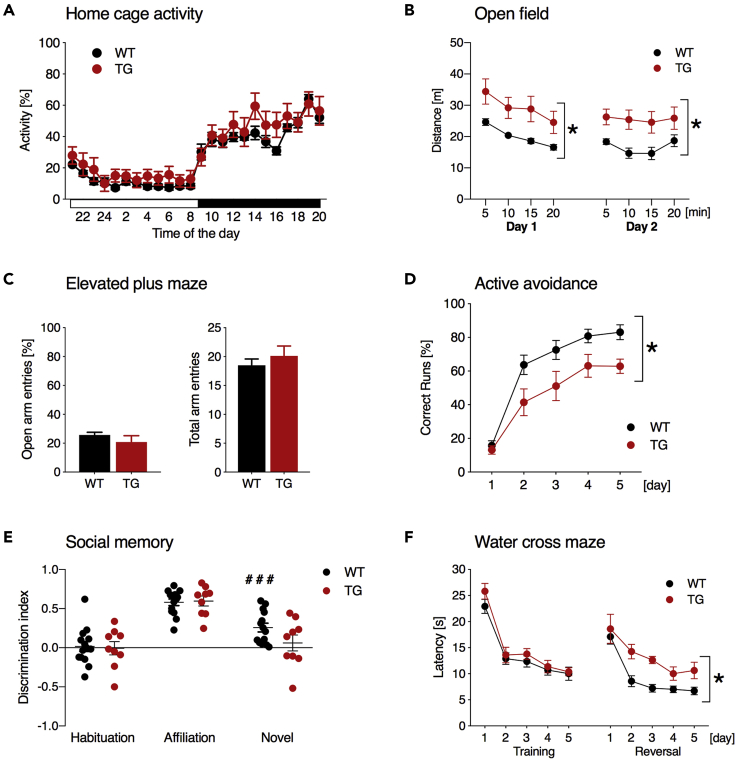
Duplications and deletions of short chromosomal fragments are increasingly recognized as the cause for rare neurodevelopmental conditions and disorders. The NDR2 gene encodes a protein kinase important for neuronal development and is part of a microduplication region on chromosome 12 that is associated with intellectual disabilities, autism, and epilepsy. We developed a conditional transgenic mouse with increased Ndr2 expression in postmigratory forebrain neurons to study the consequences of an increased gene dosage of this Hippo pathway kinase on brain circuitry and cognitive functions. Our analysis reveals reduced terminal fields and synaptic transmission of hippocampal mossy fibers, altered hippocampal network activity, and deficits in mossy fiber-dependent behaviors. Reduced doublecortin expression and protein interactome analysis indicate that transgenic Ndr2 disturbs the maturation of granule cells in the dentate gyrus. Together, our data suggest that increased expression of Ndr2 may critically contribute to the development of intellectual disabilities upon gene amplification.

Keywords: genetics; neuroscience; sensory neuroscience.


Conflict of interest statement

The authors declare no competing interests.

Figures

None
Graphical abstract
Figure 1
Figure 1
Generation and characterization of the Ndr2 overexpression in the forebrain of the transgenic mice (A) Human chromosome 12, indicating four genes on the p arm between 12:27396901-27848497:1; NDR2 (STK38L), ARNTL2, SMCO2, and PPFIBP1. (B) Our transgenic strategy comprises the generation of conditional EGFP:Ndr2-transgenic mice and their breeding with the CaMKII-alpha-Cre driver mice. (C) Immunoprecipitation of EGFP:Ndr2 shows conditional expression in the brain of two mouse lines Ndr2lox/tg55 and Ndr2lox/tg89. (D) An overview of coronal sections from WT and TG mouse brain tissues verifying the expression of the transgenic EGFP:Ndr2 in distinct regions of the brain of the TG mice by immunohistochemistry. Scale bar: 500 μm. (E) In the hippocampus, prominent labeling of MF could be observed. Moderate staining was also observed in dendritic regions of DG and CA1. DG: Dentate gyrus, CA1-2-3: Cornu Ammonis 1-2-3, Shown with arrow MF: Mossy fibers. Scale bar: 500 μm. (F) Ndr2 protein expression in the hippocampus (DG, CA3, and CA1) and cerebellum. The fusion protein could be detected at 85 kDa and through the molecular weight shift is discernible from endogenous Ndr2 in TG mice. The TG tissue sample from the cerebellum does not show a transgenic signal confirming the regional specificity of CaMKII-alpha-Cre mediated transgene activation. See also Figure S1.
Figure 2
Figure 2
Reduced MF density, diminished basal transmission, and mildly decreased late MF-LTP in TG mice (A) Representative images of the ventral DG and the MF from WT and TG mouse. Timm labeled mossy fibers are visible in black, with a pronounced suprapyramidal (SP) and discernable infra/intrapyramdial (IIP) band in both genotypes. Scale bar: 100 μm. (B) Quantification of Timm labeling revealed a reduction in the ventral suprapyramidal mossy fiber band of TG mice (WT N = 5, TG N = 9). Values are mean ± SEM;∗ indicates p < 0.05 (C) Input/output ratios were significantly reduced in the TG mice indicating a decline in baseline synaptic responses (WT N = 5 mice, n = 18 slices, TG N = 4 mice, n = 13 slices). Values are mean ± SEM; ∗, p < 0.05 (D) Samples of MF-LTP traces during baseline recordings (black line); last minutes of LTP (gray line), and after DCG IV application (light gray line). The MF-LTP was induced by HFS in the presence of 50 μM D-AP5, and 2 μM DCG IV was applied to confirm the recorded fEPSPs as MF signals. Inset figure shows the last 30 min of the MF-LTP before DCG IV application. (E) The column scatterplot of averaged fEPSP amplitudes from 30 min to 60 min after LTP induction. ∗ indicates p < 0.05 by repeated measures two-wayANOVA in A and Student’s t-test in E. See also Figures S3–S5.
Figure 3
Figure 3
Disturbed MF maturation in TG mice Expression of DCX (green) and Ki67 (red) in the vDG of a WT (A) and a TG (B) mouse. A reduced doublecortin labeling is evident along the entire extension of the DG granule cell layer. Bar, 100 μm (C) Quantification of DCX expressing cell profiles confirms the significant reduction, in the absence of a change in Ki67. Values are mean ± SEM; ∗ indicates p < 0.05 for genotype. See also Table S4.
Figure 4
Figure 4
Reduced SW-R and carbachol-induced gamma oscillations in the ventral hippocampus of TG mouse (A) Sample field potential (FP) traces simultaneously recorded from CA3 (upper trace) and CA1 (lower trace) subregions of the ventral-to-mid hippocampal slices from WT (black) and TG (red) mice. (B) A sample sharp wave-ripple (SW-R; top trace) together with low-pass-filtered SW (3–45 Hz; middle trace) and band-passfiltered ripples (120–300 Hz; bottom trace) from CA3 and CA1 subregions of WT (black) and TG (red) slices. Note the reduced SW amplitude in CA3 subregion and reduced ripple amplitude in CA1 subregions in TG slices. (C–F)(C) Summary graphs indicating a reduced SW area in the CA3 subregion of TG mice (WT: N = 5 mice, n = 22 slices; TG: N = 5 mice, n = 18 slices), (D) a reduced ripple amplitude in the CA1 subregion of TG slices, (E) no significant alterations in SW incidence in both CA3 and CA1 subregions and (F) a mild but significant increase in ripple frequency in the CA3 subregion of TG slices. (G) Sample 5 μM carbachol-induced gamma oscillation field potential (FP) traces recorded from CA3 (top) and CA1 (bottom) subregions of the ventral-to-mid hippocampal slices of WT (black) and TG (red) mouse. Note the decreased gamma oscillation strength in the CA1 subregion of the TG mouse. (H) Representative power spectra illustrating a general reduction in gamma oscillations in the CA1 subregion of a TG slice. (I and J)(I) Summary graphs indicating a significant decrease in integrated gamma power (20–60 Hz) in the ventral CA1 subregion (WT: N = 5 mice, n = 29 slices; TG: N = 5 mice, n = 23 slices) and (J) no alteration in peak gamma frequency in both CA3 and CA1 subregions of TG slices (WT: N = 5 mice, n = 29 slices; TG: N = 5 mice, n = 23 slices). (K) Summary graphs indicating a significant decrease in auto-correlation only in the CA1 subregion (WT: N = 5 mice, n = 28 slices; TG: N = 5 mice, n = 17 slices), no alteration in the CA3 subregion and a significant decrease in cross-correlation of gamma oscillations in the CA3 and CA1 subregion of the TG mice (WT: N = 5 mice, n = 29 slices; TG: N = 5 mice, n = 20 slices). All data are reported as box plots with the median value as the horizontal line. The boundary of the box closest to zero indicates the 25th percentile and the boundary of the box farthest from zero indicates the 75th percentile. Whiskers (error bars) above and below the box indicate the 90th and 10th percentiles. Data points (single dots) beyond the 5th and 95th percentiles are also displayed. ∗, ∗∗ indicate p < 0.05 and p < 0.01, respectively; Student’s ttest (C: CA3; F: CA3, CA1; K: CA1, CA3-CA1) or Mann Whitney U test (C: CA1; D: CA3, CA1; E: CA3, CA1; I: CA3, CA1; J: CA3, CA1; K: CA3).
Figure 5
Figure 5
Increased exploratory activity and learning deficits in TG mice (A) Activity in the home cage over 24 h was not different between genotypes (WT N = 10, TG N = 8). White bar on the xaxis indicates lights on and the black bar lights off. (B) TG mice showed high exploration on both days of an open field test (WT N = 7, TG N = 9). (C) Exploration of closed arms in the elevated plus maze did not differ between genotypes (WT N = 7, TG N = 8), indicating no change in anxiety. (D) Active avoidance performance of the TG mice was poor compared to the control mice as they displayed a reduced proportion of successful avoidance responses at the end of the training (WT N = 7, TG N = 7). (E) WT (N = 14) and TG mice (N = 9) showed no preference for either side of the three-compartment test system during habituation and both similarly preferred the side with a mouse during the testing of social affiliation behavior. However, social memory in a three-compartment test was impaired in TG mice, which did not display any preference for the novel interaction mouse. (F) In a water cross maze task, the average latency of finding the platform decreased over time during the training and reversal learning, yet TG mice exhibited higher latencies during reversal (WT N = 10, TG N = 8). Values are mean ± SEM.; ∗p < 0.05 between TG and WT; ###p < 0.001 compared to chance level.

Similar articles

Cited by

References

    1. Albrecht A., Caliskan G., Oitzl M.S., Heinemann U., Stork O. Long-lasting increase of corticosterone after fear memory reactivation: anxiolytic effects and network activity modulation in the ventral hippocampus. Neuropsychopharmacology. 2013;38:386–394. doi: 10.1038/npp.2012.192. - DOI - PMC - PubMed
    1. Albrecht A., Stork O. Are NCAM deficient mice an animal model for schizophrenia? Front. Behav.Neurosci. 2012;6:43. doi: 10.3389/fnbeh.2012.00043. - DOI - PMC - PubMed
    1. Albrecht A., Thiere M., Bergado-Acosta J.R., Poranzke J., Muller B., Stork O. Circadian modulation of anxiety: a role for somatostatin in the amygdala. PLoS One. 2013;8:e84668. doi: 10.1371/journal.pone.0084668. - DOI - PMC - PubMed
    1. Andres-Alonso M., Ammar M.R., Butnaru I., Gomes G.M., Acuña Sanhueza G., Raman R., Yuanxiang P., Borgmeyer M., Lopez-Rojas J., Raza S.A. SIPA1L2 controls trafficking and local signaling of TrkB-containing amphisomes at presynaptic terminals. Nat. Commun. 2019;10:5448. doi: 10.1038/s41467-019-13224-z. - DOI - PMC - PubMed
    1. Arruda-Carvalho M., Restivo L., Guskjolen A., Epp J.R., Elgersma Y., Josselyn S.A., Frankland P.W. Conditional deletion of -CaMKII impairs integration of adult-generated granule cells into dentate gyrus circuits and hippocampus-dependent learning. J. Neurosci. 2014;34:11919–11928. doi: 10.1523/JNEUROSCI.0652-14.2014. - DOI - PMC - PubMed

LinkOut - more resources