. 2021 Sep;35(3):192-212.
doi: 10.1080/01677063.2021.1941946. Epub 2021 Aug 12.

Expression of the foraging gene in adult Drosophila melanogaster

Affiliations

Expression of the foraging gene in adult Drosophila melanogaster

Aaron M Allen et al. J Neurogenet. 2021 Sep.

Abstract

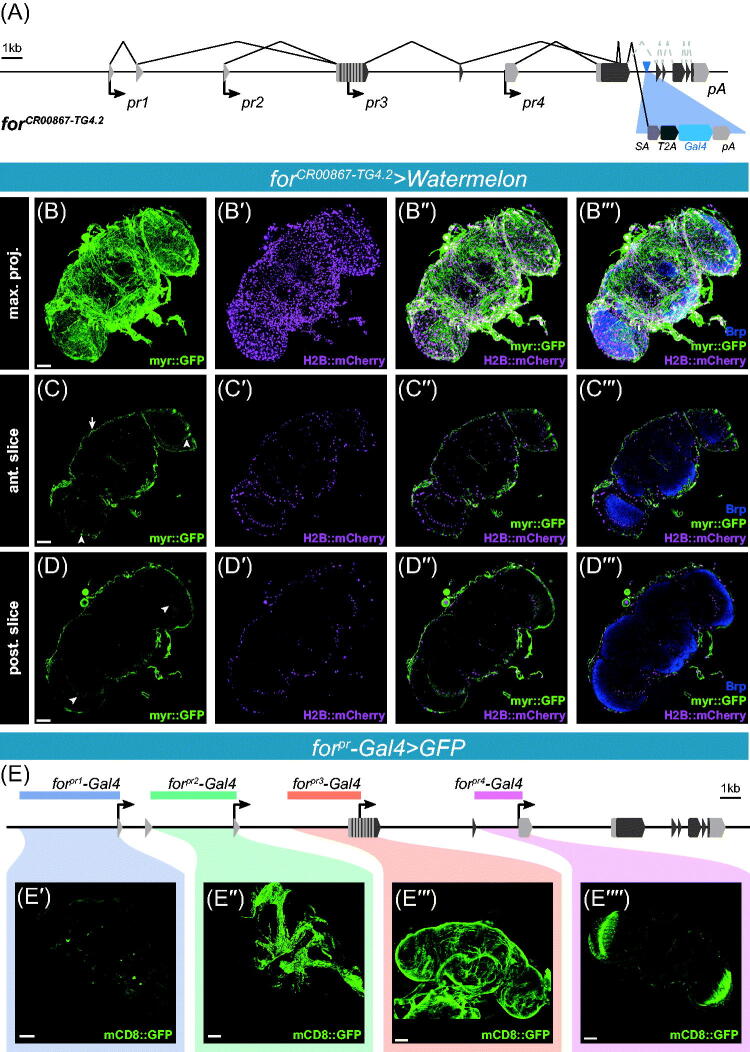
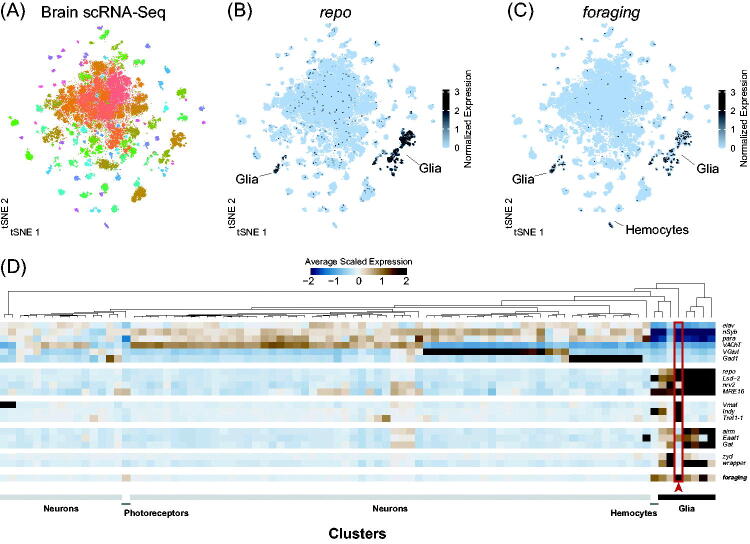
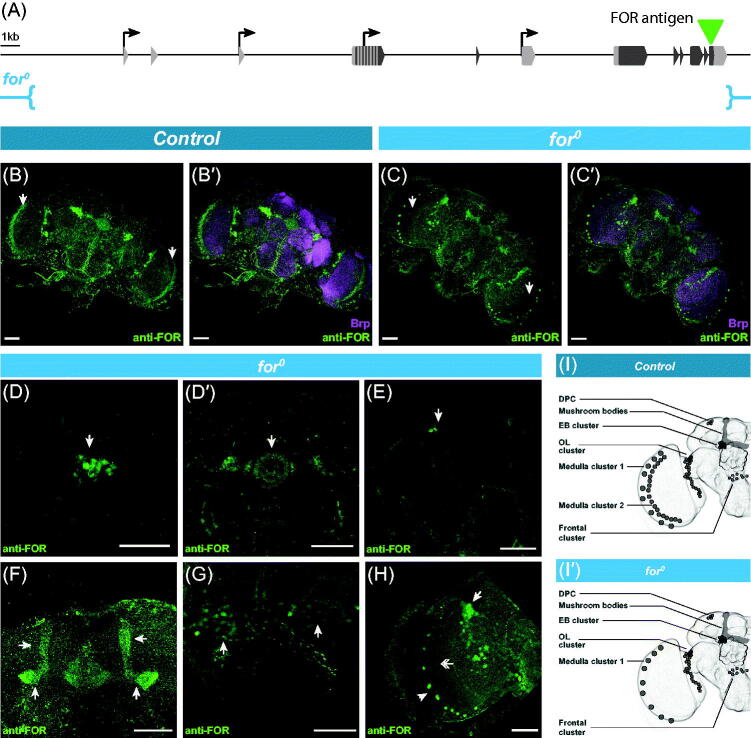
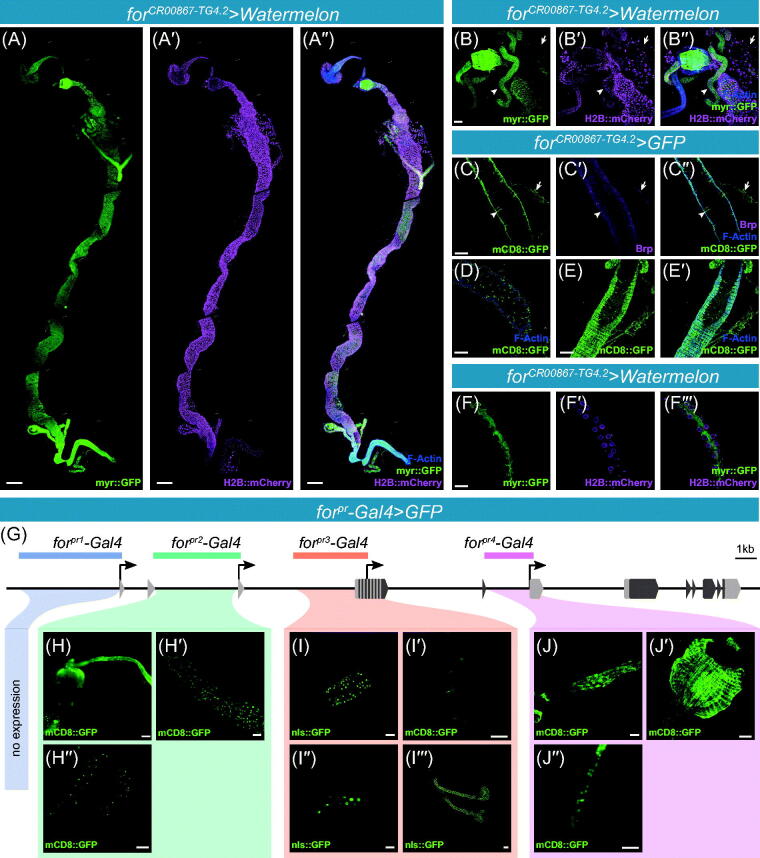
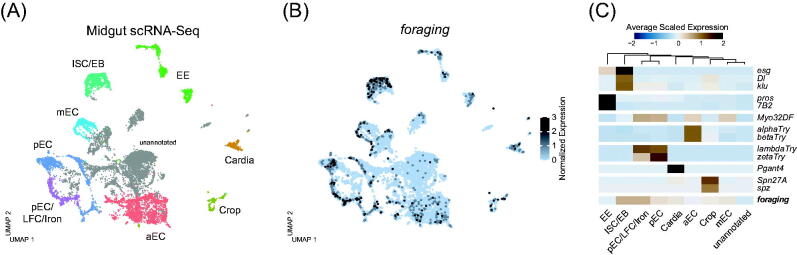
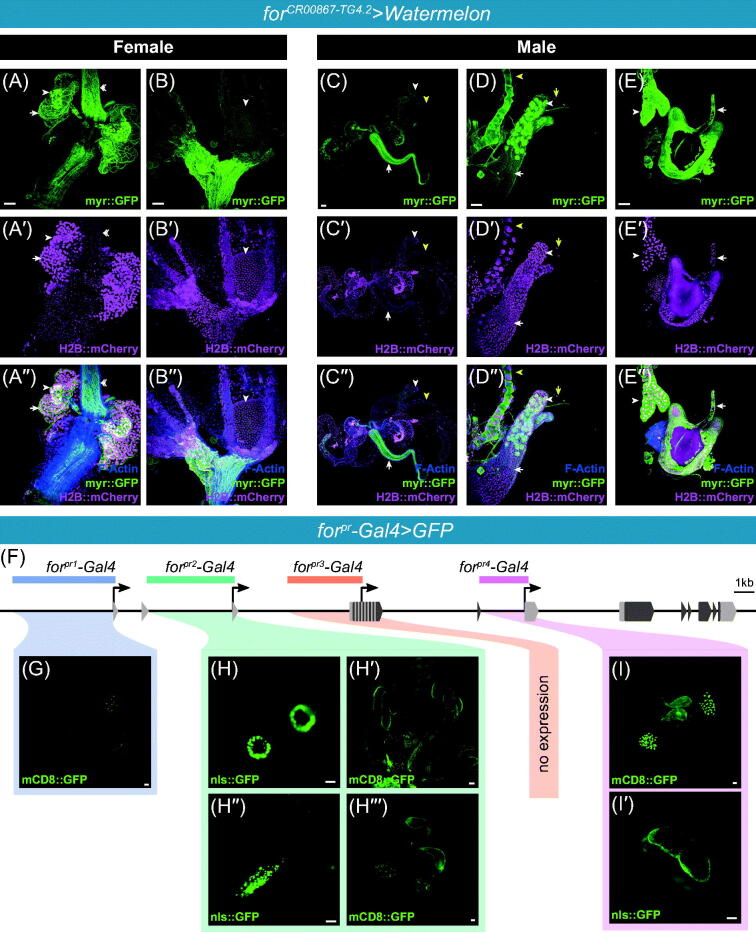
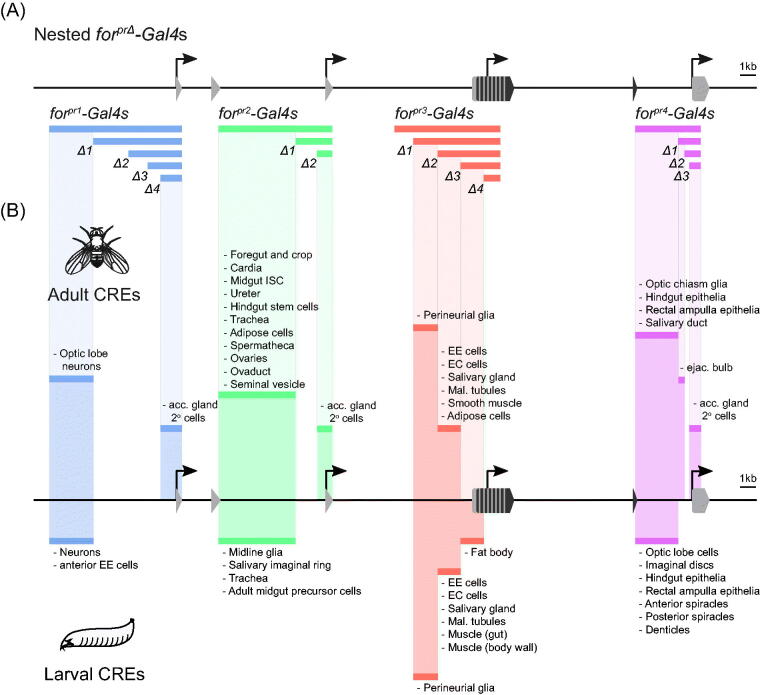
The foraging gene in Drosophila melanogaster, which encodes a cGMP-dependent protein kinase, is a highly conserved, complex gene with multiple pleiotropic behavioral and physiological functions in both the larval and adult fly. Adult foraging expression is less well characterized than in the larva. We characterized foraging expression in the brain, gastric system, and reproductive systems using a T2A-Gal4 gene-trap allele. In the brain, foraging expression appears to be restricted to multiple sub-types of glia. This glial-specific cellular localization of foraging was supported by single-cell transcriptomic atlases of the adult brain. foraging is extensively expressed in most cell types in the gastric and reproductive systems. We then mapped multiple cis-regulatory elements responsible for parts of the observed expression patterns by a nested cloned promoter-Gal4 analysis. The mapped cis-regulatory elements were consistently modular when comparing the larval and adult expression patterns. These new data using the T2A-Gal4 gene-trap and cloned foraging promoter fusion GAL4's are discussed with respect to previous work using an anti-FOR antibody, which we show here to be non-specific. Future studies of foraging's function will consider roles for glial subtypes and peripheral tissues (gastric and reproductive systems) in foraging's pleiotropic behavioral and physiological effects.

Keywords: Drosophila melanogaster; cis-regulatory element; expression; foraging gene; pleiotropy; promoter analysis.


Conflict of interest statement

The authors report no conflict of interest.

Figures

Figure 1.
Figure 1.
(A) Schematic of the forCR00867-TG4.2 CRIMIC allele in the foraging locus. UTR regions are depicted with grey boxes and coding sequences are depicted with black boxes. Splicing patterns are depicted above the locus. The four transcription start sites are depicted below the locus, pr1–4. The CRIMIC element is inserted in the first intron after the first common coding exon (blue triangle). The splice acceptor sequence (SA) is designed to trap the endogenous transcription of foraging. The self-cleaving T2A sequence then allows for the translation of the Gal4 coding sequence into a separate peptide. (pA – poly adenylation site). (B–B′′′) Maximal projections of the forCR00867-TG4.2 CRIMIC allele driving UAS-Watermelon in the adult brain. Membrane bound GFP in green (B), nuclear mCherry in magenta (B′), membrane and nuclear merged (B′′), membrane and nuclear merged with Bruchpilot (nc82) in blue (B′′′). (C–C′′′) A single section in the anterior of the adult brain of the forCR00867-TG4.2 CRIMIC allele driving UAS-Watermelon. Arrow denotes surface glia expression. Arrow heads in the optic lobes depict the cells with morphology consistent with outer chiasm glia. (D–D′′′) A single section in the posterior of the adult brain of the forCR00867-TG4.2 CRIMIC allele driving UAS-Watermelon. Arrowheads in the optic lobes depict the cells with morphology consistent with inner chiasm glia. (E–E′′′′) Schematic of the foraging locus depicting regions of cloned forpr-Gal4s (E). forpr1-Gal4 driven GFP expression in neurons innervating the optic lobe (E′). forpr2-Gal4 driven expression in the trachea and air sacs (E′′). forpr3-Gal4 driven expression in the perineurial surface glia (E′′′). forpr4-Gal4 driven expression in the outer optic chiasm glia (E′′′′). Scale bars = 50 µm. [Please refer to the online version for colors.]
Figure 2.
Figure 2.
(A) t-SNE plot of single-cell RNA sequencing from the adult brain (data from Davie et al., 2018). Each point represents the transcriptome of a single cell. Cells are clustered based on similarity of gene expression. Distinct cell types are represented by different colors. (B) Expression of the glial specific transcription factor repo in the single-cell brain atlas. repo expression is restricted to only a few clusters of cells. Cells are color coded according to the level of normalized expression. (C) Expression of foraging in the single cell brain atlas. foraging expression is restricted to a few clusters, most of which were also repo positive, and one was Hml positive. (D) Heatmap showing the average scaled expression of neuronal and glial marker genes across each cell cluster (colors in A). Neurons are marked by the pan-neuronal markers elav, nSyb, para, as well as the neurotransmitter specific genes VAChT (Acetylcholine), VGlut (Glutamate), and Gad1 (GABA). Glia are marked by repo, MRE16, nrv2, Lsd-2. The genes Vmat, Indy, and Tret1-1 label perineurial glia (among other things). alrm, Gat, and Eaat1 label astrocyte-like glia. zyd labels cortex glia and ensheathing glia, and wapper labels tract cortex glia. foraging is enriched in all the glia clusters, as well as the Hml expressing hemocyte cluster. [Please refer to the online version for colors.]
Figure 3.
Figure 3.
(A) Schematic of the foraging gene (as in Figure 1(A)). The 120bp (40aa) antigenic region used to generate the polyclonal anti-FOR antibody is depicted with a green arrowhead (described in Belay et al., 2007). The for0 genetic deletion (described in Allen et al., 2017) and its break points (in blue) are depicted below. (B) Maximal projection of anti-FOR antibody staining in control animals of late pupal brains (4 days post-puparium formation). Arrows in optic lobes indicating cells with morphology consistent with outer optic chiasm glia. Neuropil visualised with anti-Brp (B′). (C) Maximal projection of anti-FOR antibody staining in for0 null mutant (described in Allen et al., 2017) animals of late pupal brains (4 days post-puparium formation). Arrows in optic lobes indicating lack of expression in cells with morphology consistent with outer optic chiasm glia. Neuropil visualized with anti-Brp (C′). (D–H) Magnification of anti-FOR positive clusters in the for0 null mutant. Immunoreactivity in the ellipsoid body cluster, EB cluster (arrow, D) and its projections into the ellipsoid body (arrow, D′). Staining was also seen in the 4 cells of the dorsal posterior cluster, DPC (arrow, E). Staining in the mushroom bodies (arrow, F). Staining in the frontal cluster (arrow, G). Staining in the optic lobe cluster, OL cluster (arrow, H), medulla cluster 1 (arrowhead, H), and absent in medulla cluster 2 (double arrow, H). (I–I′) Schematics of anti-FOR expression patterns in control and for0 null mutant animals. Expression in the for0 null mutant was the same as control except for the lack of medulla cluster 2. Scale bars = 50 µm. [Please refer to the online version for colors.]
Figure 4.
Figure 4.
(-A″) Maximal projections of the forCR00867-TG4.2 CRIMIC allele driving UAS-Watermelon in the adult gut. Membrane bound GFP in green (A), nuclear mCherry in magenta (A′), membrane and nuclear merged with F-actin (A′′). Scale bar = 200 µm. (B–B′′) Maximal projections of forCR00867-TG4.2 driving UAS-Watermelon in the cardia and other tissues. Membrane bound GFP in green (B), nuclear mCherry in magenta (B′), membrane and nuclear merged with F-actin in blue (B′′). White arrow heads indicating the salivary gland. White arrows indicating the Malpighian tubules. (C–C′′′) Single section of forCR00867-TG4.2 driving UAS-mCD8::GFP in the anterior midgut. GFP expression can be seen in the enteroendocrine (EE) cells and the muscle (C). EE cells can be identified by the expression of Brp (C′), and muscles with F-actin (C′′). White arrowhead indicating an example of co-expression of GFP and Brp (C′′′). (D) Single section of forCR00867-TG4.2 driving UAS-mCD8::GFP in the intestinal stem cells of the midgut. (E–E′) Subsection of forCR00867-TG4.2 driving UAS-mCD8::GFP in the visceral muscle of the midgut. (F–F′′′) Maximal projections of forCR00867-TG4.2 driving UAS-Watermelon in the Malpighian tubules. (G) Schematic of the of the foraging locus depicting regions of cloned forpr-Gal4s. (H–H′′) forpr2-Gal4 driven expression in the gastric system. Expression was seen in the foregut and cardia (G), as well as the midgut intestinal stem cells (G′), and the Malpighian stem cells in the ureter (G′′). I–I′′′. forpr3-Gal4 driven expression in the gastric system. Expression was seen in middle midgut enterocytes (H), anterior EE cells (H′), distal segment of the Malpighian tubules (H′′), and the salivary glands (H′′′). J–J′. forpr4-Gal4 driven expression in the gastric system. Expression was seen in epithelia of the hindgut (I), the ampulla (I′), and the salivary duct (I′′). B–J. Scale bars = 50 µm. [Please refer to the online version for colors.]
Figure 5.
Figure 5.
(A) UMAP plot of single-cell RNA sequencing from the adult midgut (data from Hung et al., 2020). Each point represents the transcriptome of a single cell. Cells are clustered based on similarity of gene expression. Distinct cell types are represented by different colors. EE: enteroendocrine cells; ISC: intestinal stem cells; EB: enteroblasts; LFC: large flat cells; Iron: iron cells; aEC: anterior enterocytes; mEC: middle enterocytes; pEC: posterion enterocytes. (B) Expression of foraging in the single-cell midgut Atlas. Cells are color coded according to the level of normalized expression. (C) Heatmap showing the average scaled expression of cell type marker genes across each cell cluster. Initialisms are defined in A. foraging is most enriched in the ISC/EB and pEC/LFC/Iron clusters. EE cells are marked by pros and 7B2. ISC/EB are marked by esg, Dl, and klu. All ECs are marked by Myo32DF, and the anterior to posterior access is delineated by a series of trypsin coding genes (alphaTry, betaTry, lambdaTry, zetaTry, among others). The cardia is marked by Pgant4, and the crop by Spn27A and spz. [Please refer to the online version for colors.]
Figure 6.
Figure 6.
(A–E′′′) forCR00867-TG4.2 CRIMIC allele driving UAS-Watermelon in female and male reproductive systems with membrane bound GFP in green (A–E), nuclear mCherry in magenta (A′–E′), membrane and nuclear merged with F-actin in blue (A′′–E′′). (A–A′′) Maximal projections of expression in the female reproductive system; uterus, spermatheca (white arrowhead), and common oviduct (white double arrowhead) of the female reproductive system. Expression was also seen in the spermatheca associated fat (white arrow) and smooth muscle. (B–B′′) Maximal projections of expression in the female reproductive system; ovarioles and lateral oviducts. Expression was seen in the common and lateral oviducts, epithelial sheath surrounding the ovariole, and follicle cells (arrowhead). (C–C′′) Maximal projections of expression in the male reproductive system. Expression was seen throughout; ejaculatory duct (white arrow), seminal vesicles, testis, and accessory glands (white arrowhead). Other tissues are also present (Malpighian tubules – yellow arrowhead). (D–D′′) Magnification of the accessory gland. Primary cells indicated with white arrow, and secondary cells indicated with white arrowhead. Other tissues are also present (Malpighian tubules – yellow arrowhead, trachea – yellow arrow). (E–E′′) Magnification of the ejaculatory bulb. Lower ejaculatory duct (white arrow) and fat tissue (white arrowhead) are indicated. (F) Schematic of the foraging locus depicting regions of cloned forpr-Gal4s. G. forpr1-Gal4 driven GFP expression in the male reproductive system. (H) forpr2-Gal4 driven expression in the spermatheca. (H′) forpr2-Gal4 driven expression in the ovaries. H′′. forpr2-Gal4 driven expression in the oviduct. (H′′′) forpr2-Gal4 driven expression in the male reproductive system. (I) forpr4-Gal4 driven expression in the male reproductive system. (I′) forpr4-Gal4 driven expression in the ejaculatory bulb. Scale bars = 50 µm. [Please refer to the online version for colors.]
Figure 7.
Figure 7.
(A). Schematic of cloned regions for the nested forpr-Gal4s. The 5′-end of the foraging locus is depicted with regions corresponding to the 4 original forpr-Gal4s, and the 13 newly generated nested forprΔ-Gal4s are below the locus, each numbered according to ranked size (e.g. forpr1Δ1-Gal4, forpr1Δ2-Gal4, etc.). These regions were cloned into a gypsy insulated Gal4 vector and inserted into attP2 landing site with φC31 integration. (B) Mapped cis-regulatory elements (CREs) in the adult (depicted above the locus) and larval (depicted below the locus) D. melanogaster. CREs were mapped along the locus by comparing the expression patterns of the 17 nested cloned forpr-Gal4s.

Similar articles

Cited by

References

    1. Allen, A. M., Anreiter, I., Neville, M. C., & Sokolowski, M. B. (2017). Feeding-related traits are affected by dosage of the foraging gene in Drosophila melanogaster. Genetics, 205(2), 761–773. doi:10.1534/genetics.116.197939 - DOI - PMC - PubMed
    1. Allen, A. M., Anreiter, I., Vesterberg, A., Douglas, S. J., & Sokolowski, M. B. (2018). Pleiotropy of the Drosophila melanogaster foraging gene on larval feeding-related traits. Journal of Neurogenetics, 32(3), 1–11. doi:10.1080/01677063.2018.1500572 - DOI - PMC - PubMed
    1. Allen, A. M., Neville, M. C., Birtles, S., Croset, V., Treiber, C. D., Waddell, S., & Goodwin, S. F. (2020). A single-cell transcriptomic atlas of the adult Drosophila ventral nerve cord. eLife, 9. doi:10.7554/eLife.54074 - DOI - PMC - PubMed
    1. Alwash, N., Allen, A. M., Sokolowski, M. B., & Levine, J. D. (2021). The Drosophila melanogaster foraging gene affects social networks. Journal of Neurogenetics. 10.1080/01677063.2021.1936517 - DOI - PubMed
    1. Anreiter, I., & Sokolowski, M. B. (2019). The foraging gene and its behavioral effects: Pleiotropy and plasticity. Annual Review of Genetics, 53(1), 373–392. doi:10.1146/annurev-genet-112618-043536 - DOI - PubMed

MeSH terms

Substances

LinkOut - more resources