

doi: 10.1161/CIRCRESAHA.120.318271.
Epub 2021 Aug 12.
Dach1 Extends Artery Networks and Protects Against Cardiac Injury
Affiliations
- PMID: 34383559
- PMCID: PMC8448957
- DOI: 10.1161/CIRCRESAHA.120.318271
Item in Clipboard
Dach1 Extends Artery Networks and Protects Against Cardiac Injury
Circ Res.
.
Abstract
[Figure: see text].
Keywords: cell differentiation; coronary artery disease; endothelial cells; myocardial infarction; retina.
Figures

A) Dach1OE transgenic mouse line. B) Confocal image of an ApjCreER;Dach1OE mouse heart (e15.5) immunostained for EGFP to assess recombination rate in the transgenic line. C) Dach1 immunostaining in Dach1OE hearts. D) Experimental strategy in E-I. E) E15.5 hearts imaged on the right lateral side show an increase in CX40 staining in Dach1OE capillaries (arrowheads). F) Quantification of the percent heart area immunostained by CX40 (n=6 control, n=4 Dach1OE; Mann-Whitney test; Holm-Sidak adjusted p-value from testing three hypotheses). G) Quantification of primary artery diameters in e15.5 hearts (n=6 control, n=4 Dach1OE, Mann-Whitney test; Holm-Sidak adjusted p-value from testing three hypotheses). H) Erg immunostaining e15.5 heart sections. I) Quantification of endothelial density (n=3 control, n=3 Dach1OE, Mann-Whitney test; Holm-Sidak adjusted p-value from testing three hypotheses). AO= Aorta, CA= Coronary Artery, Cap= Capillary S= Septum, RV= Right Ventricle. Scale bar= 400 μM in B), E) (whole heart), and H). Scale bar= 200μM in E) (boxed area). Scale bar= 100μM in E) highest magnification. Scale bar= 50μM in C). All data represent mean+-SD.

A) Experimental strategy in B-E. B) Right lateral view of e17.5 hearts. Arrowheads indicate extra artery branches. Boxed regions show the scale of extra CX40+ vessels and the normal capillary bed morphology in Dach1OE. C-E) Quantification of the total length (C) (n=7 control, n=10 Dach1OE; Mann-Whitney test; Holm-Sidak adjusted p-value from testing three hypotheses) and number of branch points (D) (n=7 control, n=10 Dach1OE; Mann-Whitney test; Holm-Sidak adjusted p-value from testing three hypotheses) in the CX40+ vessel network, and primary coronary artery diameters (E) in e17.5 hearts (n=7 control, n=9 Dach1OE, Mann-Whitney test; Holm-Sidak adjusted p-value from testing three hypotheses). F) Experimental strategy in G-J. G) CX40 immunostaining of the ventral surface of postnatal hearts shows increased branching in Dach1OE. H and I) Quantification of the total length (H) and branch points (I) of CX40+ vessels, and J) measurement of main coronary artery diameters in postnatal hearts (n=7 control, n=6 Dach1OE, Mann-Whitney test; Holm-Sidak adjusted p-value from testing three hypotheses). K) Experimental strategy to generate artery specific Dach1OE expression using Cx40CreER. L) CX40 immunostaining of control and CX40CreER;Dach1OE hearts. M and N) Quantification of CX40+ area (M) and artery diameter (N) (n=5 control, n=6 Dach1OE, Mann-Whitney test; Holm-Sidak adjusted p-value from testing two hypotheses). AO= Aorta, CA= Coronary Artery. Scale bar= 500μM in G). Scale bar= 400μM in B) (entire heart) and L). Scale bar= 200μM in B) (boxed region). All data represent mean+-SD.

A) Dosing strategy for retina vasculature analysis. B) Retinas from Dach1OE pups contained increased number of CX40+ vessel branches (arrowheads) and artery-vein crossing (asterisks). Right panels show insets indicated by dashed boxes. C) The total length of all CX40+ vessels per retina was greater in Dach1OE (n=6 control, n=5 Dach1OE, Mann-Whitney test; Holm-Sidak adjusted p-value from testing two hypotheses). D and E) Image (D, arrowheads) and quantification (E) of artery-vein crossovers in Dach1OE retinas (n=5 control, n=5 Dach1OE, Mann-Whitney test; Holm-Sidak adjusted p-value from testing two hypotheses). F) Experimental strategy in G-L. (G-L) Images (G, H, J, and K) and quantification (I and L) of control or Dach1OE cells in retinas from the indicated ages. Boxed regions highlight the tip and capillary cells (G and H) or artery (J and K) where there was a differential localization of control and Dach1OE cells. (I: n=1020 control, n=767 Dach1OE, Chi-square test; L: n=1708 control, n=540 Dach1OE, Chi-square test). A= Artery, V= Vein, Cap=Capillary. Scale bar= 400μM in B), G), H), J), and K) (full view). Scale bar= 200μM in D), B) (close up). Scale bar= 100μM in G), H), J), and K) (close up). all data are mean+-SD.

A) Littermate e15.5 embryos expressing ApjCreER with either Rosa26tdTomato or Rosa26Dach1OE were FACS sorted to isolate coronary endothelial cells for single cell sequencing. B) UMAP projections of data showed 8 endothelial cell clusters. C) The genes that define each cluster are plotted with their relative expression in each cluster. Boxed region highlights Art1 and Art2 signature genes, which are similar but with increased expression in Art2. Differential gene expression between clusters was found using the Wilcoxon Rank Sum Test. D) UMAP plot showing that cells from both genotypes overlapped; Dach1OE did not produce a new subtype. E) UMAP plots with both genotypes combined showing cell cycle stage using the CellCycleScoring function in seurat. F) Percent of cells in each cluster for both genotypes. G) Scaled expression of the Dach1OE transgene, Dach1, and select artery markers.

A) Calculating an artery score for each cell (see methods) revealed that Dach1OE shifted the total distribution of cells to a higher artery score (control= 1975 cells, Dach1OE= 2149 cells, Mann-Whitney test). (B) Within each individual cluster, only the Art1 and Art2 clusters had significant shifts in artery score. (post-hoc Bonferroni multiple comparison test following two way ANOVA) C) Cell trajectories (solid line) from either genotype inferred using Monocle3. D) CytoTRACE differentiation scores for each cell displayed on the UMAP plot. E) CytoTRACE scored calculated for controls cells (one way ANOVA). F) CytoTRACE scores were lower (more differentiated) for Cap5G1 and Art1in Dach1OE (post-hoc Bonferroni multiple comparison test following two way ANOVA). G) Apj, the enhancer/promoter used to drive Cre, is expressed in all endothelial cells except arteries. H) The lineage traces from ApjCreER (tdTomato or Dach1OE-EGFP) are later expressed in the arterial endothelial cells. I) Graphs showing the percent of cells in each indicated cluster in analogous coronary endothelial cell scRNAseq datasets from indicated embryonic days (e). J) Model for cell differentiation trajectory during coronary artery development and the proposed influence of Dach1. Box plots are mean+-SD.
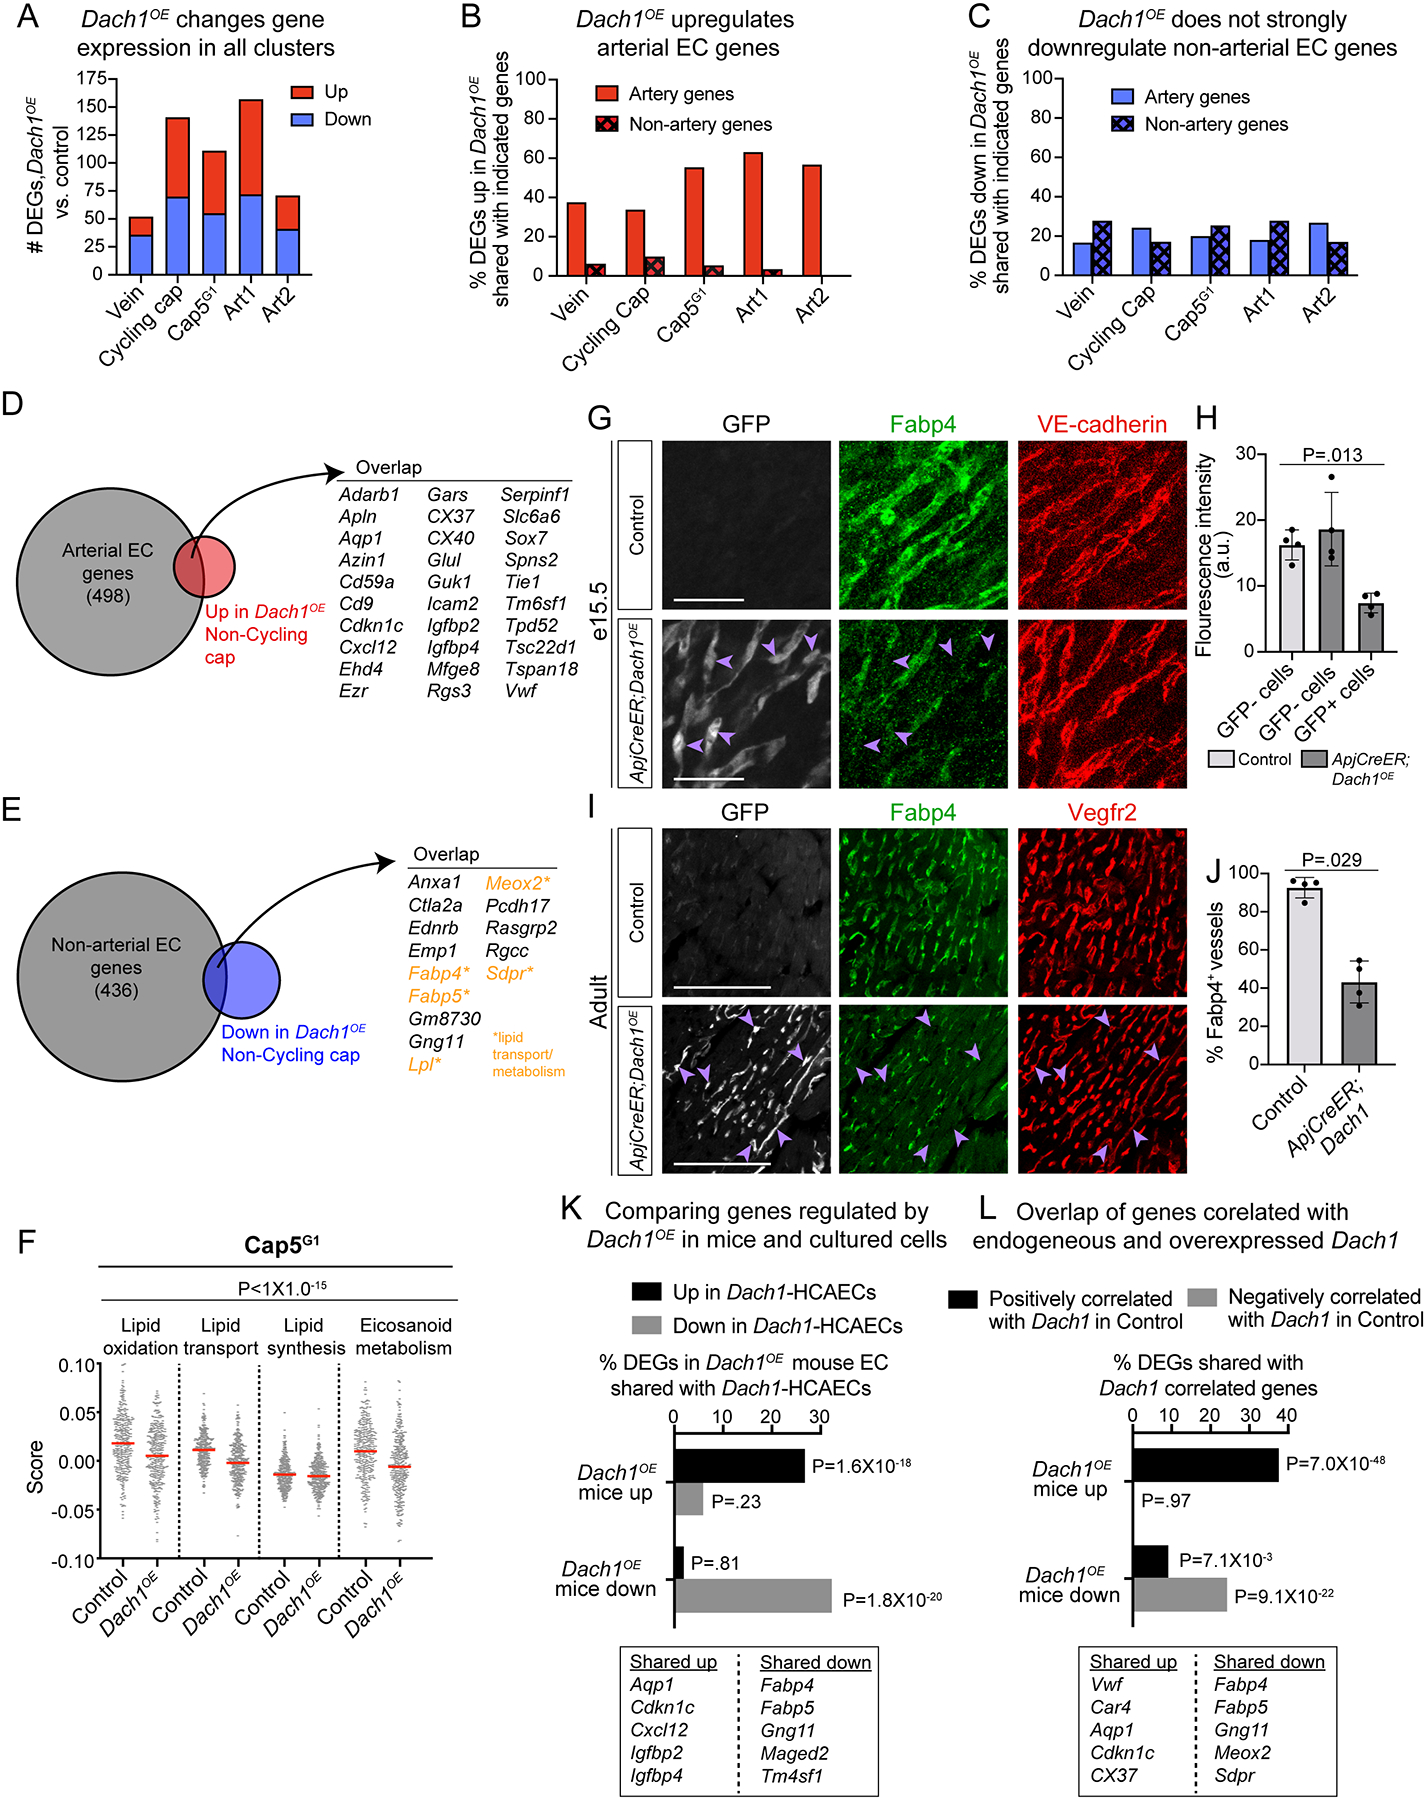
A) The number of differentially expressed genes (DEGs) when separately comparing control and Dach1OE cells from each cluster. B and C) Genes that are either positively or negatively enriched in control artery clusters we identified and termed “artery genes” and “non-artery genes”, respectively. DEGs that were either up- or down-regulated by Dach1OE in each cluster were then compared to these lists. Upregulated DEGs in Dach1OE have strong overlap with artery genes (B) while downregulated DEGs in Dach1OE have less overlap with non-artery genes (C). D and E) Venn diagrams showing overlap of artery (D) and non-artery (E) genes with DEGs either up- or down-regulated by Dach1OE in non-cycling capillary. F) Cell scores generated for select lipid pathways (see methods) showed a reduction in Dach1OE Cap5G1 (2 way ANOVA, p-value represents genotype factor). G-J) Validation of decreased Fabp4 in Dach1OE cells using immunofluorescence on hearts at e15.5 (n=4 per group, Kruskal-Wallis test). (G and H) or adult stages (n=4 control, n=4 Dach1OE, Mann-Whitney test). (I and J). Purple arrowheads show GFP+Fabp4− cells in (G) and (I). K) DEGs shared between endothelial cells experiencing Dach1 overexpression in either developing mouse hearts (Dach1OE) or primary cell culture (Dach1-HCAECs) (hypergeometric test). L) Overlap between mouse Dach1OE DEGs and genes that are positively or negatively correlated with endogenous Dach1 in scRNAseq data from control hearts (hypergeometric test). Scale bar= 50μM in G). Scale bar= 100μM in I). Red bar= mean in (F), data represent mean +-SD in (H and J).

A) Survival curve during 4-weeks post-MI. (n=30 control, n=32 Dach1OE; Log-rank test) B) Percent ejection fraction at the indicated time points (n=29 control, n=30 Dach1OE; above graph: mixed effect model above (p-value represents genotype factor); individual comparisons: Holm-Sidak adjusted p-values). C) Hematoxylin & Eosin staining on representative hearts. Arrow highlight an example of a mid-myocardial scar. D) Percent of total myocardium stained with Masson’s Trichrome in sections from three levels posterior to the ligation (n=13 control, n=29 Dach1OE; Mixed effect model, p-value represents genotype factor). E) Quantification of scarring pattern. F) The width of the myocardium at 360 angles around the heart. In the left ventricle where the infarct was induced, Dach1OE better preserved myocardial thickness when compared to controls. Lines are averages of each group while shading indicates S.D. (n=13 control and n=29 Dach1OE; Mixed effect model, p-value represents genotype factor) G and H) Smooth muscle actin (SMA) staining in sections from uninjured (G) (n=5 control, n=5 Dach1OE; Mann-Whitney test) and post-MI hearts (H) (n=12 control, n=29 Dach1OE; One-way ANOVA) with quantification of SMA density. I and J) Isolectin perfusion 2 hours (n=5 control, n=4 Dach1OE; Mann-Whitney test) or 5 days (n=5 control, n=7 Dach1OE; Mann-Whitney test) after MI, asterisks indicate stitch location. Arrows show perfused vessels connecting from perfused regions into the infarct zone in Dach1OE. Scale bar=1mm in (C), (I), (J). Scale bar= 500μm in (G). Scale bar= 250 in (H). Error bars show mean+-SD.
Comment in
-
DACH1-Driven Arterialization: Angiogenic Therapy for Ischemic Heart Disease?Circ Res. 2021 Sep 17;129(7):717-719. doi: 10.1161/CIRCRESAHA.121.319982. Epub 2021 Sep 16. Circ Res. 2021. PMID: 34529452 No abstract available.
References
-
- Taimeh Z, Loughran J, Birks EJ, Bolli R. Vascular endothelial growth factor in heart failure. Nat Rev Cardiol. 2013;10:519–530. - PubMed
Publication types
MeSH terms
Substances
Grants and funding
LinkOut - more resources
Full Text Sources
Medical
Molecular Biology Databases
