. 2021 Aug;129(8):87003.
doi: 10.1289/EHP8795. Epub 2021 Aug 12.

Multi- and Transgenerational Outcomes of an Exposure to a Mixture of Endocrine-Disrupting Chemicals (EDCs) on Puberty and Maternal Behavior in the Female Rat

Affiliations

Multi- and Transgenerational Outcomes of an Exposure to a Mixture of Endocrine-Disrupting Chemicals (EDCs) on Puberty and Maternal Behavior in the Female Rat

David López-Rodríguez et al. Environ Health Perspect. 2021 Aug.

Abstract

Background: The effects of endocrine-disrupting chemicals (EDCs) on fertility and reproductive development represent a rising concern in modern societies. Although the neuroendocrine control of sexual maturation is a major target of EDCs, little is known about the potential role of the hypothalamus in puberty and ovulation disruption transmitted across generations.

Objectives: We hypothesized that developmental exposure to an environmentally relevant dose of EDC mixture could induce multi- and/or transgenerational alterations of sexual maturation and maternal care in female rats through epigenetic reprograming of the hypothalamus. We investigated the transmission of a disrupted reproductive phenotype via the maternal germline or via nongenomic mechanisms involving maternal care.

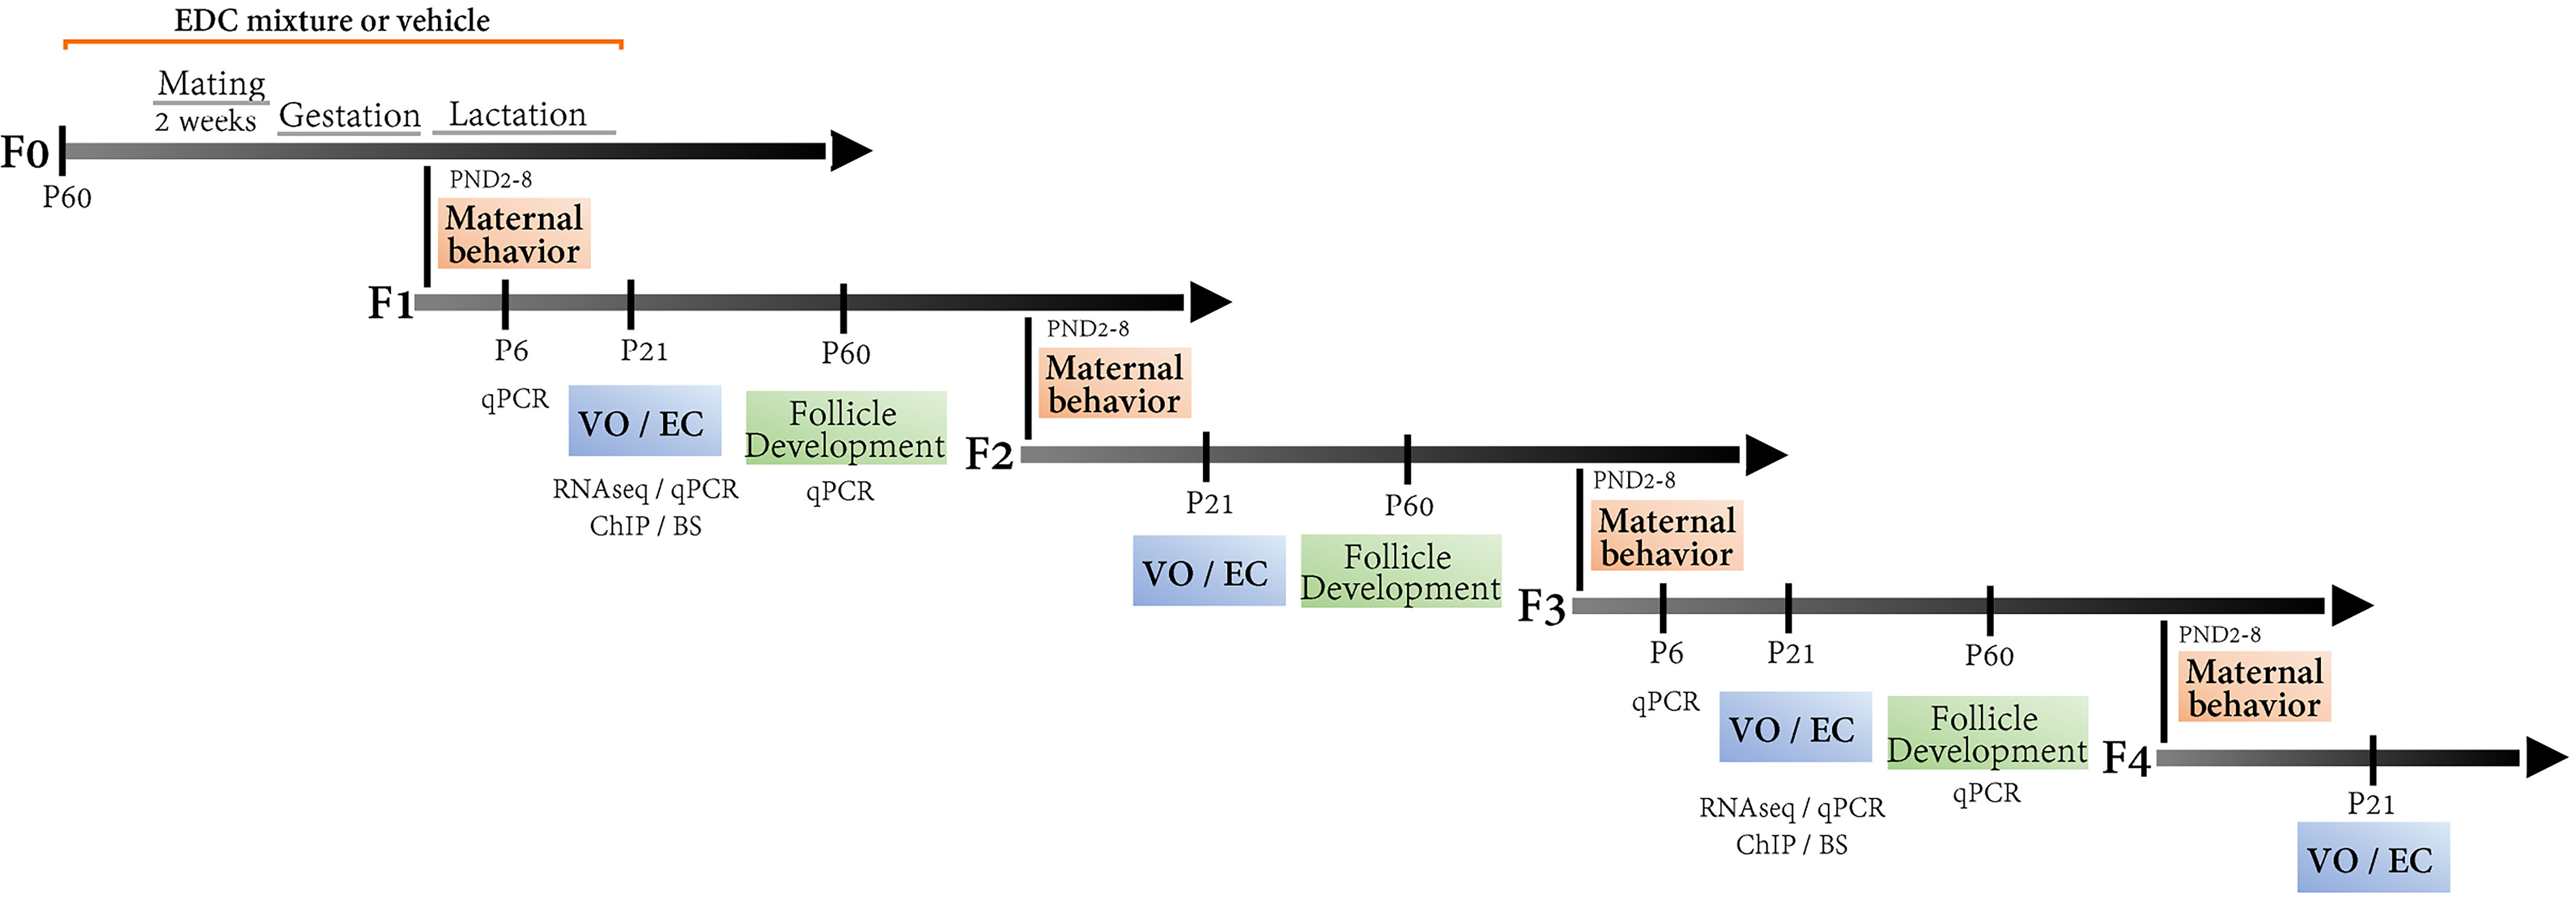
Methods: Adult female Wistar rats were exposed prior to and during gestation and until the end of lactation to a mixture of the following 13 EDCs: di-n-butyl phthalate (DnBP), di(2-ethylhexyl) phthalate (DEHP), bisphenol A (BPA), vinclozolin, prochloraz, procymidone, linuron, epoxynaxole, dichlorodiphenyldichloroethylene, octyl methoxynimmate, 4-methylbenzylidene camphor (4-MBC), butylparaben, and acetaminophen. Perinatally exposed offspring (F1) were mated with unexposed males to generate germ cell (F2) and transgenerationally exposed (F3 and F4) females. Sexual maturation, maternal behavior, and hypothalamic targets of exposure were studied across generations.

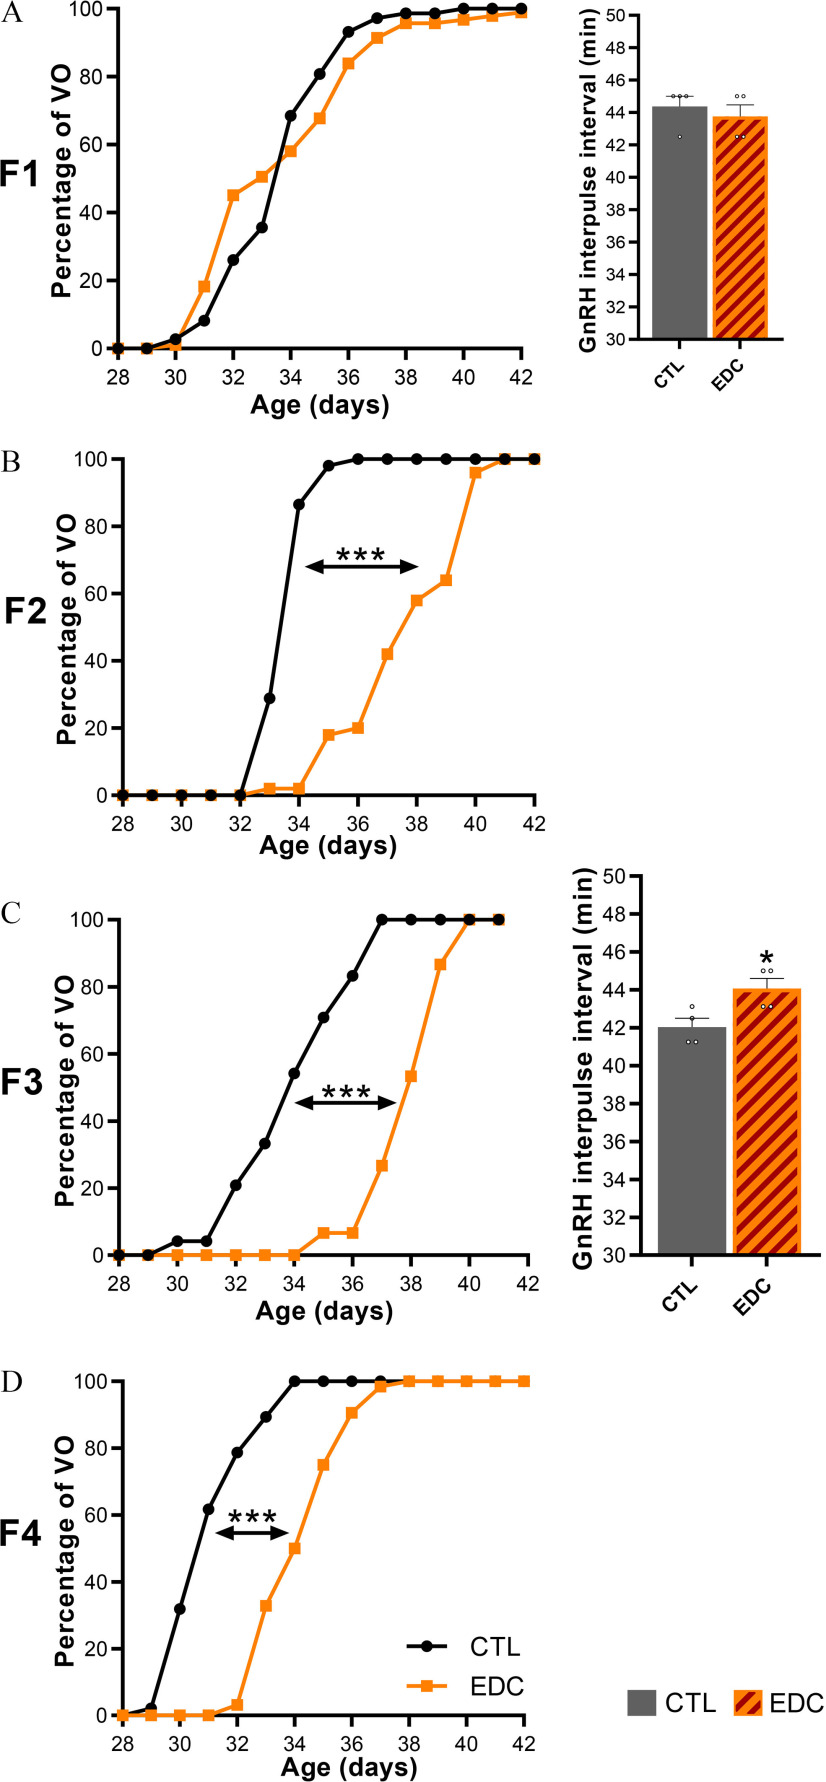
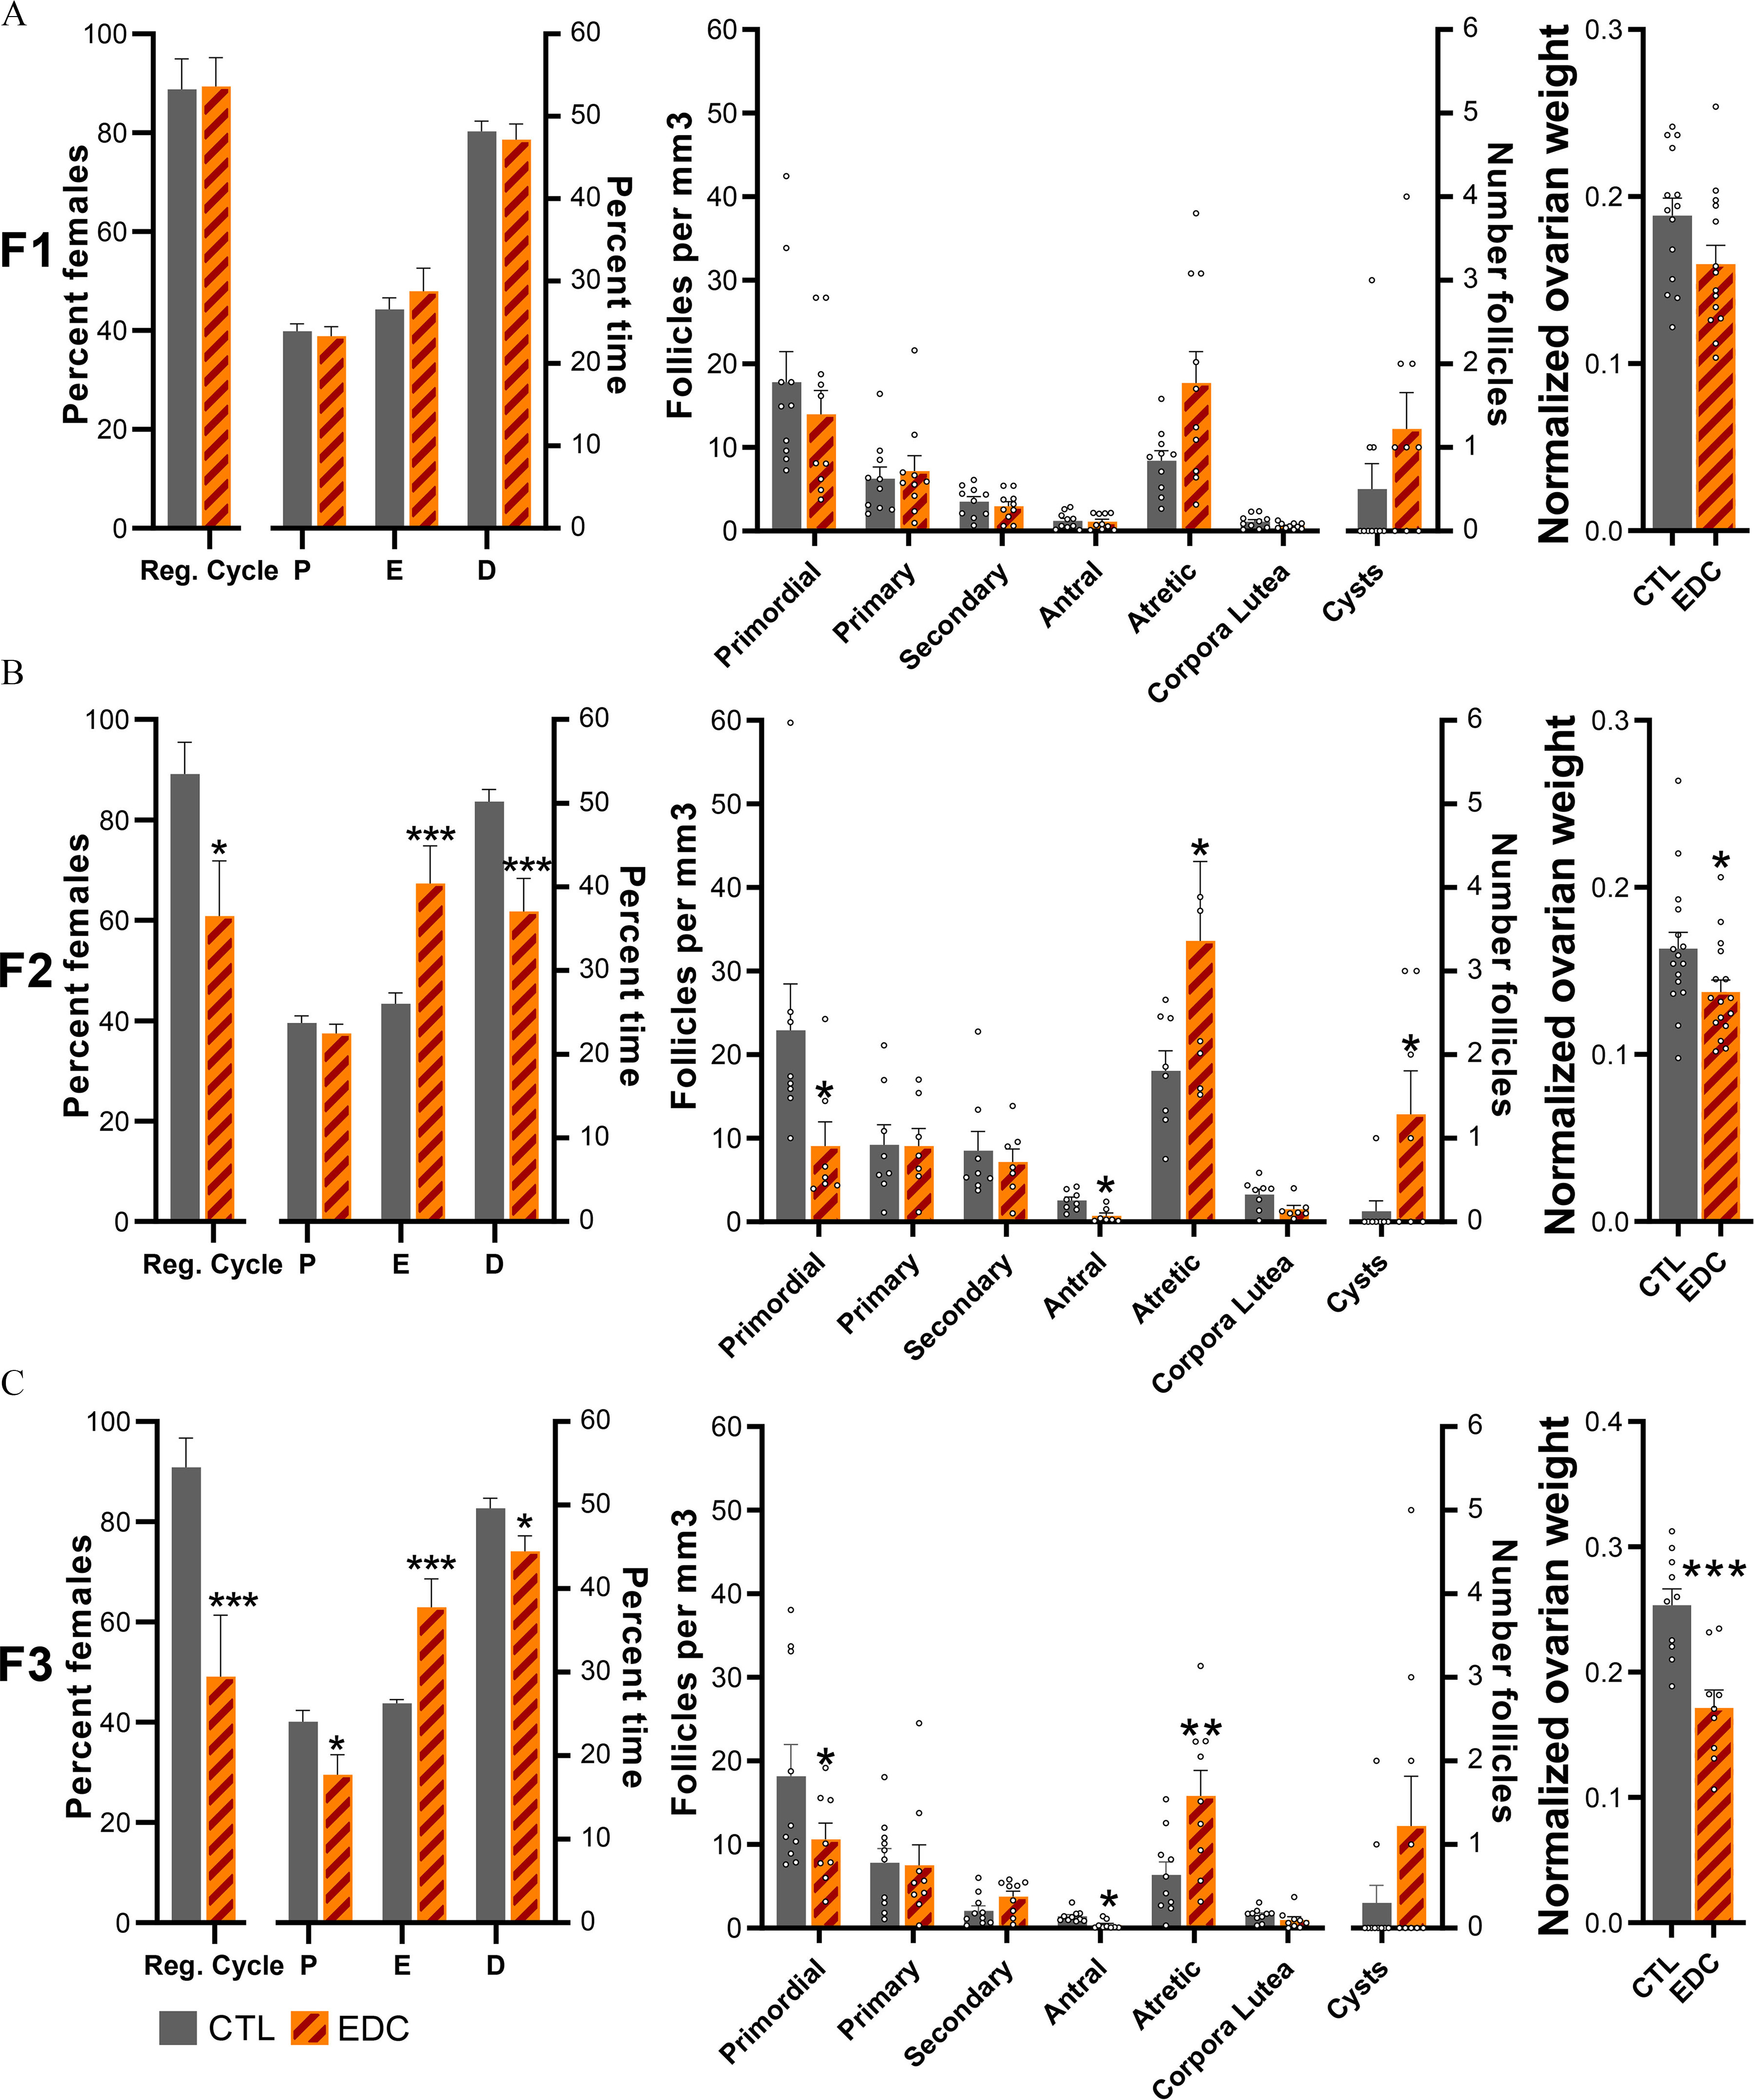
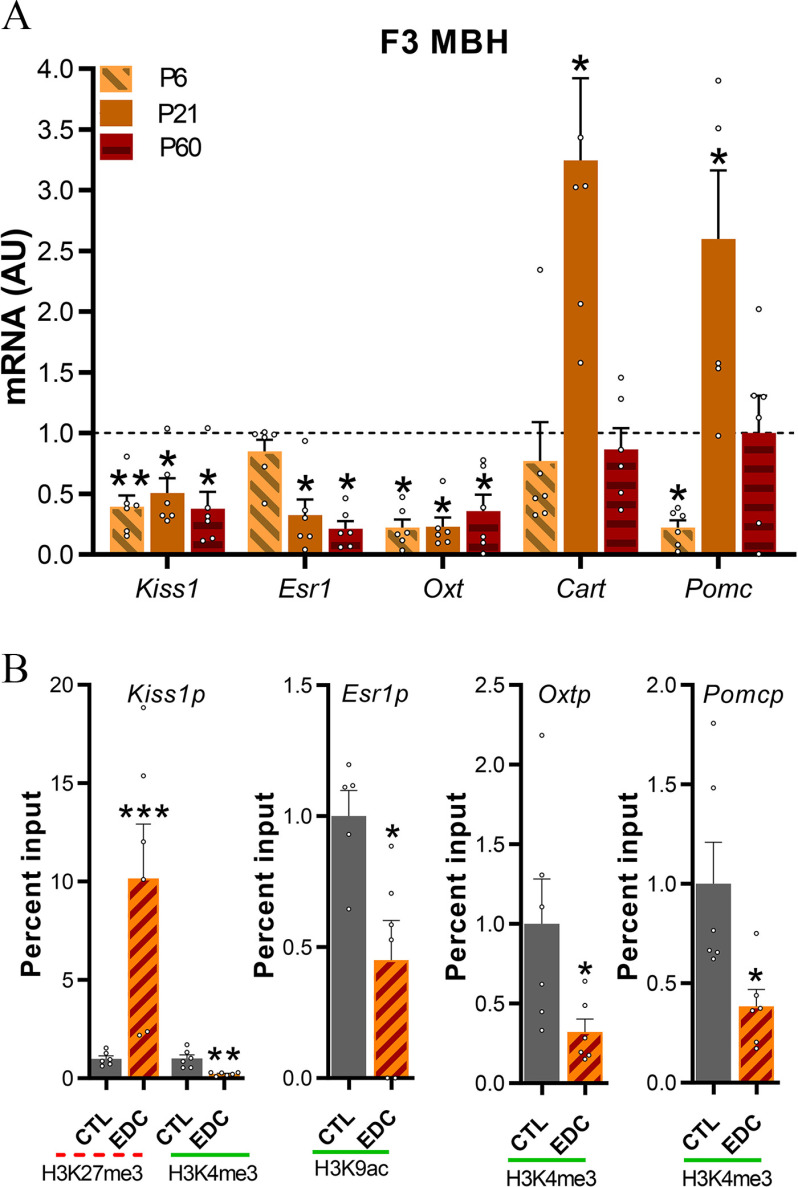
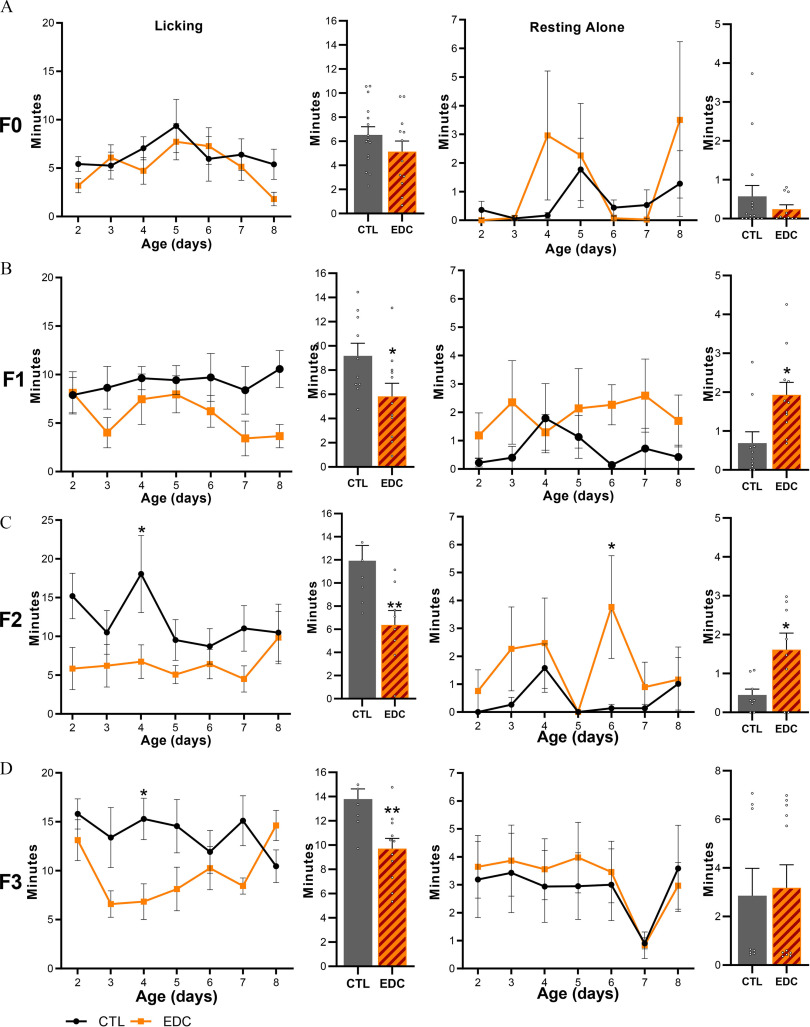
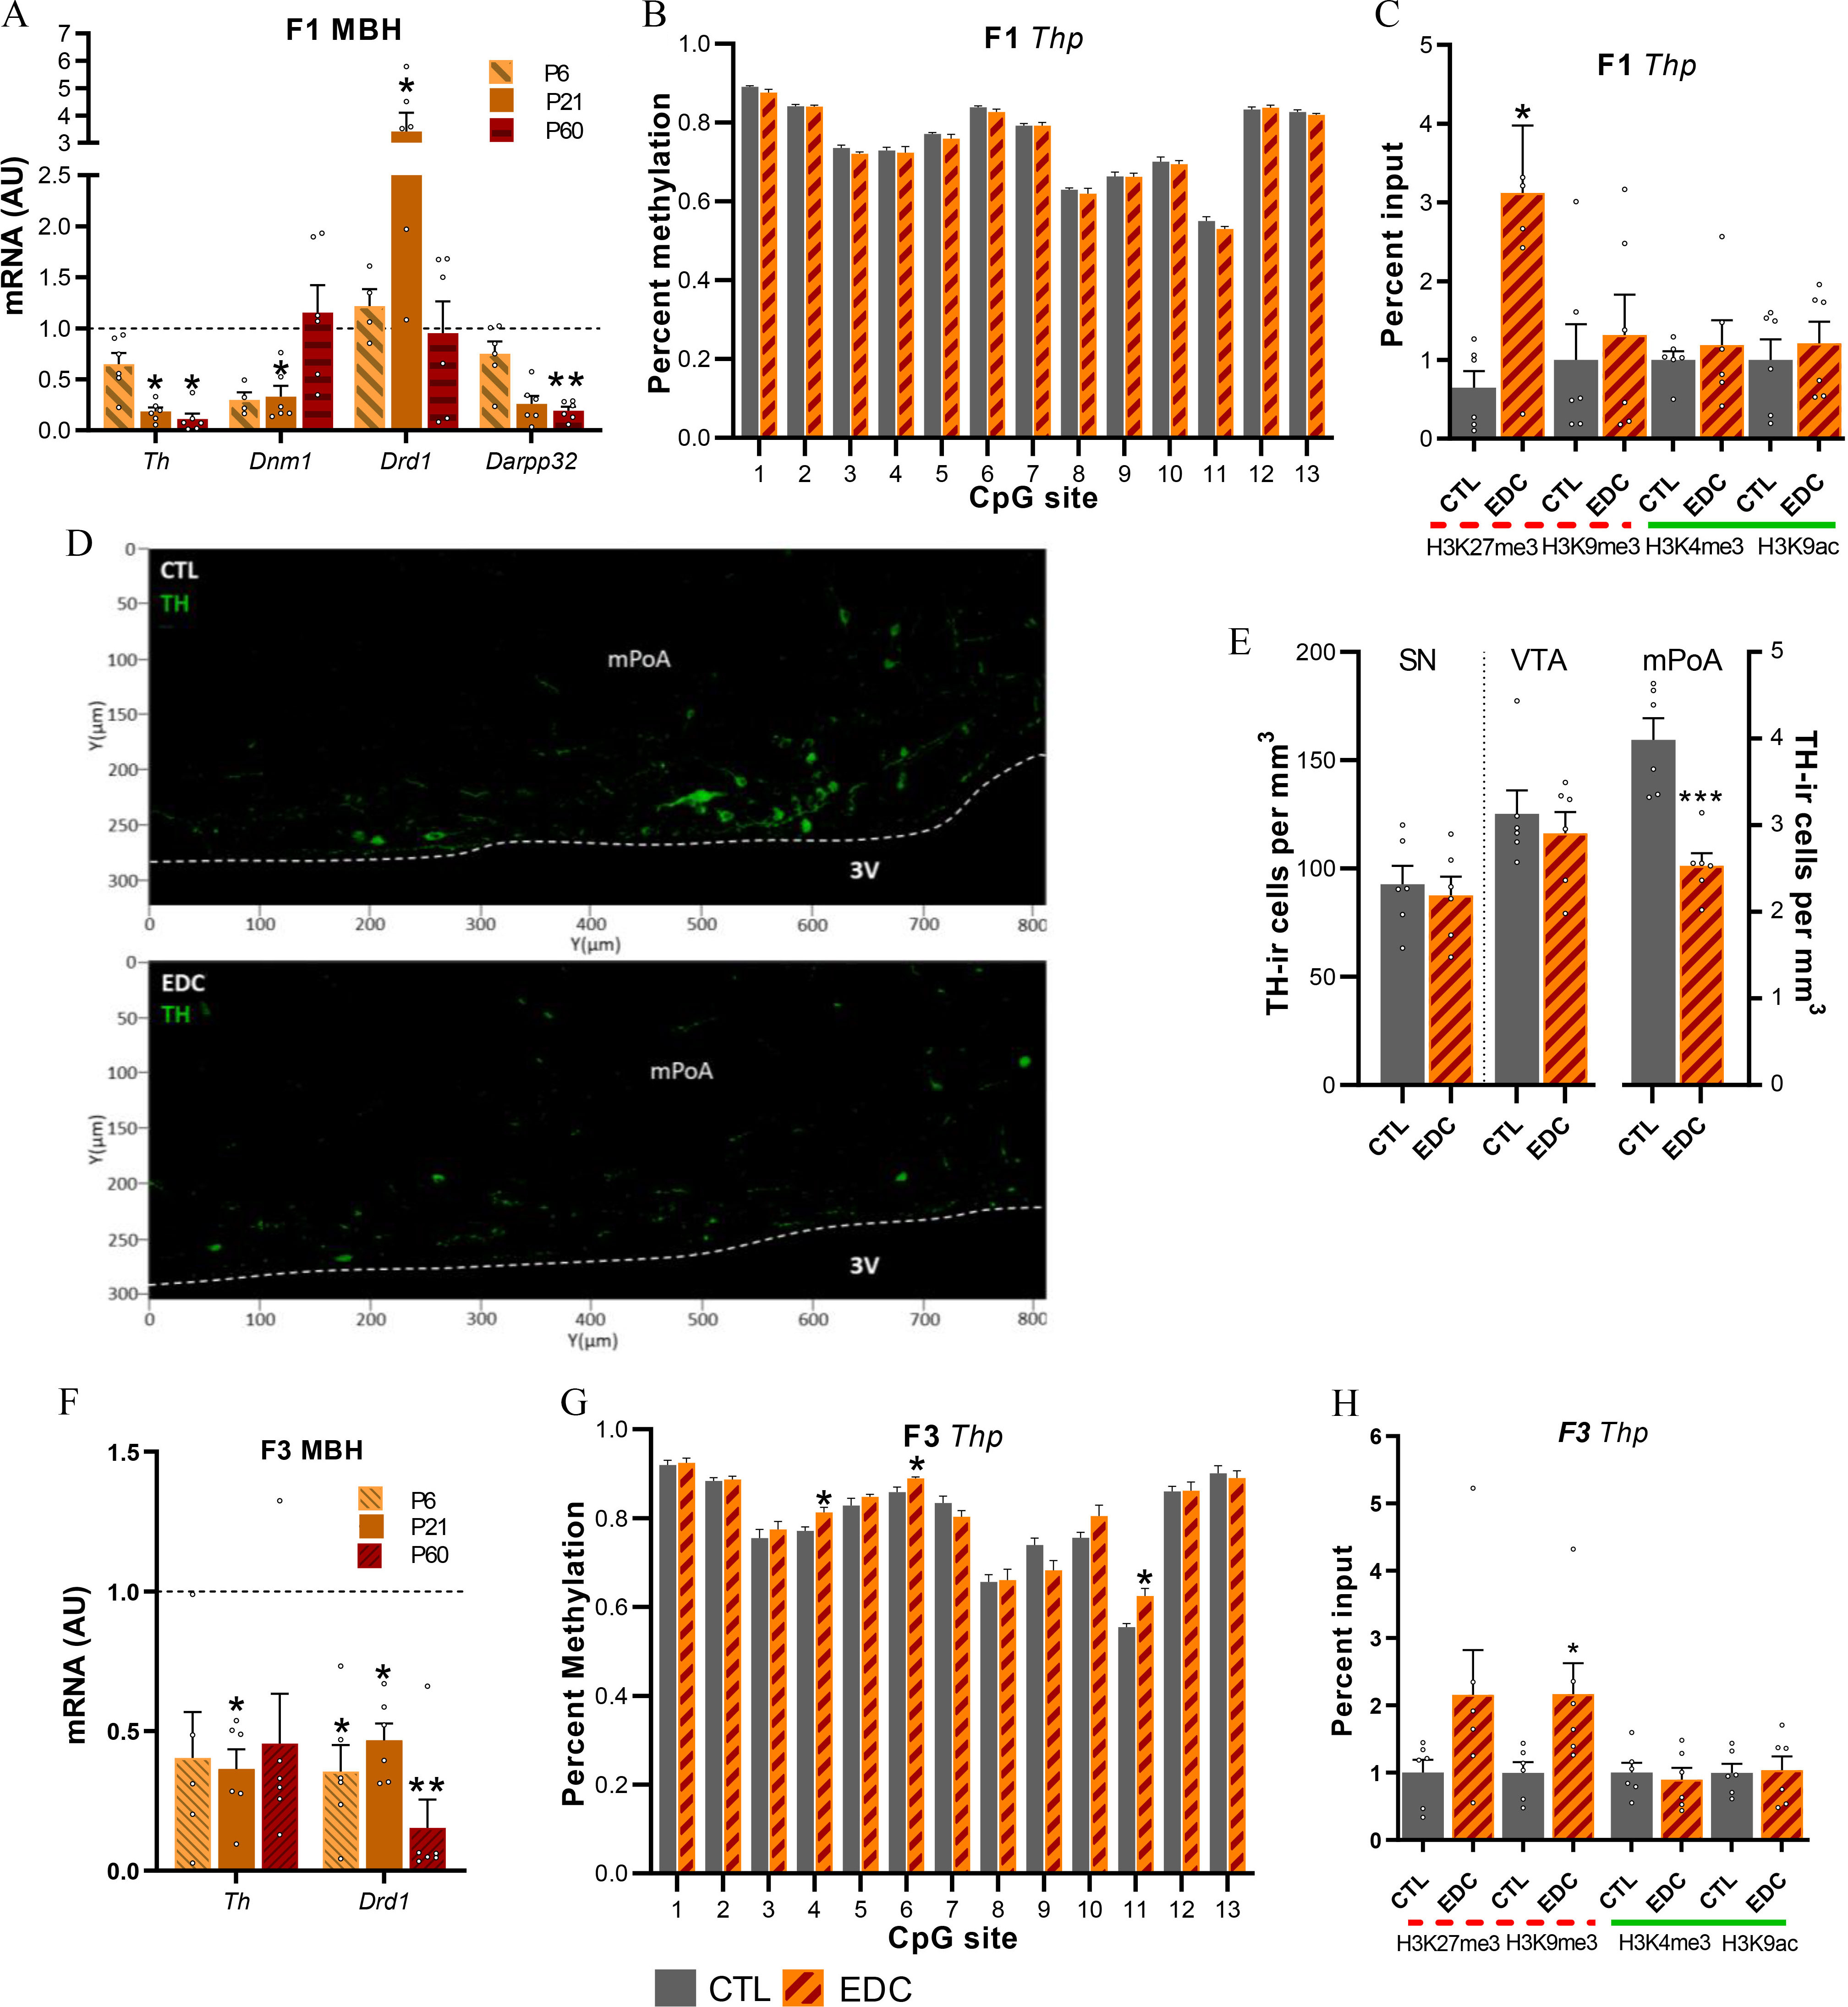
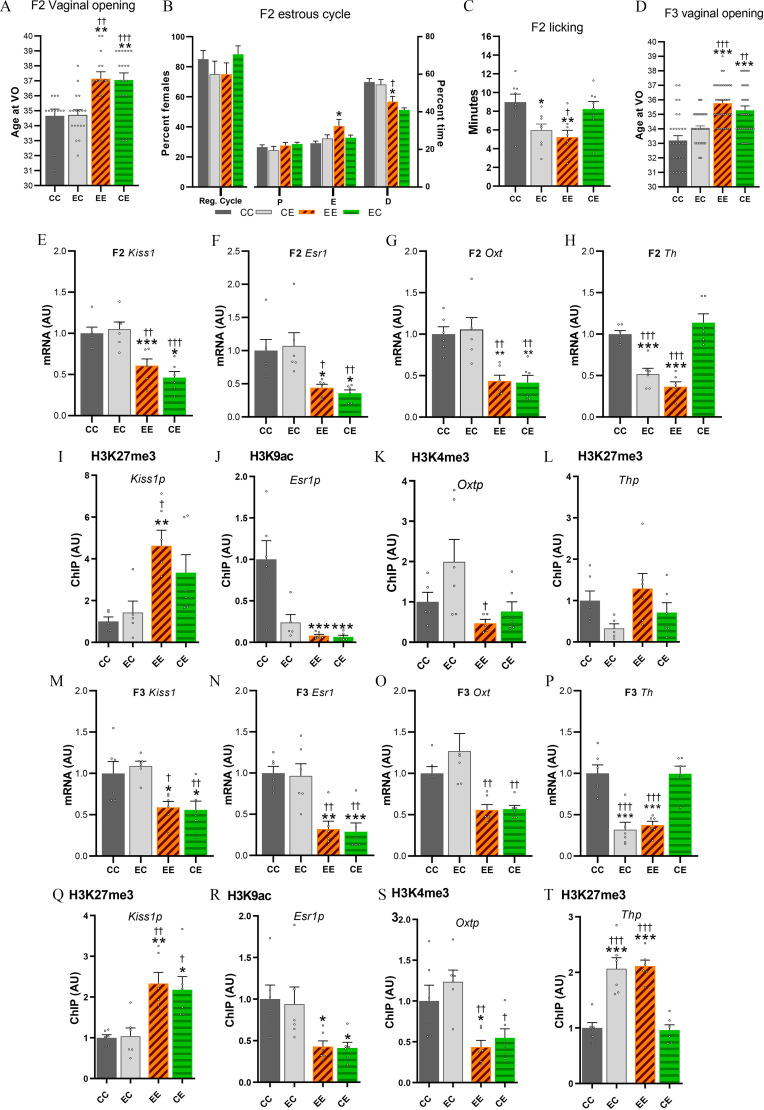
Results: Germ cell (F2) and transgenerationally (F3) EDC-exposed females, but not F1, displayed delayed pubertal onset and altered folliculogenesis. We reported a transgenerational alteration of key hypothalamic genes controlling puberty and ovulation (Kiss1, Esr1, and Oxt), and we identified the hypothalamic polycomb group of epigenetic repressors as actors of this mechanism. Furthermore, we found a multigenerational reduction of maternal behavior (F1-F3) induced by a loss in hypothalamic dopaminergic signaling. Using a cross-fostering paradigm, we identified that the reduction in maternal phenotype was normalized in EDC-exposed pups raised by unexposed dams, but no reversal of the pubertal phenotype was achieved.

Discussion: Rats developmentally exposed to an EDC mixture exhibited multi- and transgenerational disruption of sexual maturation and maternal care via hypothalamic epigenetic reprogramming. These results raise concerns about the impact of EDC mixtures on future generations. https://doi.org/10.1289/EHP8795.


Figures

Figure 1 is a flowchart having five steps. Step 1: Uppercase f 0: Endocrine Disrupting Chemicals mixture or vehicle, including 2 weeks of mating, gestation, and lactation. Step 2: Uppercase f 1: Postnatal days 2-8 Maternal behavior. In infant, quantitative polymerase chain reaction took place, In prepubertal, vaginal opening or Estrous cycle, including ribonucleic acid sequencing or quantitative polymerase chain reaction chromatin immunoprecipitation or B S took place and in adult, follicle development, including quantitative polymerase chain reaction took place. Step 3: Uppercase f 2: Postnatal days 2-8 Maternal behavior. In prepubertal, vaginal opening or Estrous cycle took place and in adult, follicle development took place. Step 4: Uppercase f 3: Postnatal days 2-8 Maternal behavior. In infant, quantitative polymerase chain reaction took place, in prepubertal, vaginal opening or Estrous cycle, including ribonucleic acid sequencing or quantitative polymerase chain reaction chromatin immunoprecipitation or B S took place and in adult, follicle development, including quantitative polymerase chain reaction took place. Step 5: Uppercase f 4: Postnatal days 2-8 Maternal behavior. In prepubertal, vaginal opening or Estrous cycle took place.
Figure 1.
Multi- and transgenerational design of an EDC mixture exposure on maternal behavior and sexual maturation via the female lineage. Adult female rats (F0) were exposed to a mixture of 13 EDCs at relevant exposure concentrations starting 2 wk before mating and until the end of lactation. Mating was carried out for period of 2 wk. Depending on the day of pregnancy during mating, adult females were exposed for a total of 49–56 d, which spanned the period before, during, and after gestation. The four subsequent generations were evaluated for sexual maturation (VO, GnRH interval interpulse, estrous cycle, and folliculogenesis) and maternal behavior (from P2 to P8). Massive parallel RNA sequencing was carried out using hypothalamic (MBH-PoA) explants from the F1 and F3 generation to decipher direct (F1) vs. transgenerational (F3) target genes of the EDC mixture exposure, followed by qPCR validation at three time points, P6, 21, and 60. Target genes were studied for histone posttranslational modifications and DNA methylation using chromatin immunoprecipitation (ChIP) and bisulfite sequencing (BS), respectively. Note: EC, estrus cycle; EDC, endocrine-disrupting chemical; VO, vaginal opening.
Figures 2a and 2c each are a set of one line graph and one bar graph. The line graph plots uppercase f 1 and uppercase f 3, percentage of vaginal opening, ranging from 0 to 100 in increments of 20 (y-axis) across age (days), ranging from 28 to 42 in increments of 2 (x-axis) for control and endocrine disrupting chemicals. The bar graph plots gonadotrophin releasing hormone interpulse interval (minute), ranging from 30 to 50 in increments of 2 (y-axis) across control and endocrine disrupting chemicals (x-axis), respectively. Figures 2b and 2d are line graphs, plotting uppercase f 2 and uppercase f 4, percentage of vaginal opening, ranging from 0 to 100 in increments of 20 (y-axis) across age (days), ranging from 28 to 42 in increments of 2 (x-axis) for control and endocrine disrupting chemicals, respectively.
Figure 2.
Pubertal timing (VO) and GnRH interpulse interval across generations (F1–F4 generation) after exposure to EDC mixture or vehicle (F0 generation). (A–D, left) Cumulative percentage of female rats reaching VO in F1 (n=5156/group), F2 (n=5052/group), F3 (n=1524/group) or F4 (n=4764/group). Samples originate from 15 litters per group per generation. Data were analyzed with Student’s t-test using the average of the day at vaginal opening as variable. (A and C, right). GnRH interpulse interval was measured in F1 and F3 females at P20 ex vivo. Hypothalamic explants were incubated individually, and sequential sampling was carried out every 7.5 min for 4 h followed by radioimmunoassay for GnRH (n=4/group). Sample originates from four different litters per group per generation. Data were analyzed using Student’s t-test. Bars represent mean±SEM (*p<0.05, ***p<0.001 vs. CTL). Summary data are reported in Table S3. Note: CTL, control; EDC, endocrine-disrupting chemical; SEM, standard error of the mean; VO, vaginal opening.
Figures 3a, 3b, and 3c each are a set of two clustered bar graph and one bar graph. The first clustered bar graph plots uppercase f 1, uppercase f 2, and uppercase f 3 percent of females, ranging from 0 to 100 in increments of 20 (left y-axis) and precent time, ranging from 0 to 60 in increments of 10 (right y-axis) across regular cycle, proestrus, estrus, and diestrus (x-axis) for control and endocrine disrupting chemicals. The second clustered bar graph plots follicles per cubic millimeter, ranging from 0 to 60 in increments of 10 (left y-axis) across number follicles, ranging from 0 to 6 in unit increments (right y-axis) across primordial, primary, secondary, antral, atretic, corpora lutea, and cysts (x-axis). The bar graph plots normalized ovarian weight, ranging from 0.0 to 0.3 in increments of 0.09 (y-axis) across control and endocrine disrupting chemicals (x-axis), respectively.
Figure 3.
Estrous cycle, ovarian follicle development, and ovarian weight across generation (F1–F3 generation) of female rats exposed to EDC mixture or vehicle (F0 generation). (A–C, left) Percentage of females showing regular cycle and average time spent in each stage of the estrous cycle in F1 (n=20/group), F2 (n=15/group), or F3 (n=1415/group) animals. Samples originate from eight different litters per group per generation. Data were analyzed using a two-way ANOVA (A–C, middle). Average number of ovarian follicles, corporal lutea, and cysts per cubic millimeter in F1, F2, and F3 females at P60 (n=910/group). Samples originate from eight different litters per group per generation. Data were analyzed using a two-way ANOVA (A–C, right). Normalized ovarian weight (ovarian weight per body weight in grams) measured at P60 in F1 (n=14/group), F2 (n=16/group), and F3 (n=910/group) females. Samples originate from eight different litters per group per generation. Data was analyzed using Student’s t-test. Bars represent mean±SEM (*p<0.05, **p<0.01, ***p<0.001 vs. CTL). Summary data are reported in Table S3. Note: ANOVA, analysis of variance; CTL, control; D, diestrus; E, estrus; EDC, endocrine-disrupting chemical; P, proestrus; Reg. cycle, regular cycle; SEM, standard error of the mean.
Figure 4a is a clustered bar graph titled uppercase f 3 mediobasal hypothalamus, plotting messenger ribonucleic acid (arbitrary units), ranging from 0.0 to 4.0 in increments of 0.5 (y-axis) across Kiss1 E s r1, O x t, Cart and P o m c (x-axis) for infant, prepubertal, and adult. Figure 4b is a set of four bar graphs, plotting percent input, ranging from 0 to 20 in increments of 5; 0.0 to 1.5 in increments of 0.5; 0.0 to 2.5 in increments of 0.5; and 0.0 to 2.0 in increments of 0.5 (y-axis) across H3K27m e3 and H3K4 m e 3, including control and endocrine disrupting chemicals; H3K9a c, including control and endocrine disrupting chemicals, H3K4m e3, including control and endocrine disrupting chemicals; and H3K4m e3, including control and endocrine disrupting chemicals (x-axis) for Kiss1p Esr1p, O x t p, and P o m c p, respectively.
Figure 4.
Kiss1, Esr1, Oxt, Cart, and Pomc mRNA expression and promoter chromatin state in F3 females ancestrally exposed to EDC mixture or vehicle. (A) Expression of Kiss1 Esr1, Oxt, Cart, and Pomc mRNA in the MBH-PoA of infant (P6), prepubertal (P21), and adult (P60) female rats as determined by qPCR (n=6/group). Samples originated from six different litters per group. RNA expression data were normalized by dividing each individual value by the average of the control group at every time point. (B) Abundance of the TrxG-dependent activating marks H3K4me3 and H3K9ac and the PcG-dependent repressive mark H3K27me3 at the Kiss1, Esr1, Oxt, and Pomc promoter in the prepubertal MBH-PoA of females ancestrally exposed to a mixture of EDC (F3 generation), as measured by ChIP (n=6/group). EDC data was normalized to control. Samples originated from six different litters per group. Dotted red lines represent repressive histone modifications (H3K27me3). Green solid lines represent activatory histone modifications (H3K27me3 and H3K9ac). Bars represent mean±SEM (*p<0.05, **p<0.01, ***p<0.001 vs. CTL, Student’s t-test). Summary data are reported in Table S3. Note: AU, arbitrary units; ChIP, chromatin immunoprecipitation; EDC, endocrine-disrupting chemicals; Oxt, oxytocin; SEM, standard error of the mean; Th, tyrosine hydroxylase.
Figures 5a, 5b, 5c, and 5d each are a set of two line graphs and two bar graph. The first line graph titled licking plots uppercase f 0, uppercase f 1, uppercase f 2, uppercase f 3 minutes, ranging from 0 to 20 in increments of 5, 0 to 20 in increments of 5, 0 to 25 in increments of 5, and 0 to 20 in increments of 5 (y-axis) across age (days), ranging from 2 to 8 in unit increments (x-axis) for control and endocrine disrupting chemicals, respectively. The second line graph titled resting alone plots minutes, ranging from 0 to 7 in unit increments (y-axis) across age (days), ranging from 2 to 8 in unit increments (x-axis), respectively. The first bar graph, plotting minutes, ranging from 0 to 16 in unit increments (y-axis) across control and endocrine disrupting chemicals, respectively. The second bar graph plots minutes, ranging from 0 to 5 in unit increments, 0 to 5 in unit increments, 0 to 5 in unit increments, 0 to 8 in increments of 2 (y-axis) across control and endocrine disrupting chemicals, respectively.
Figure 5.
Maternal behavior displayed by female rats exposed to a mixture of EDC throughout four generations. (A–D, left) Time spent by dams displaying licking and grooming behavior toward pups after direct (F0 generation, n=15/group), in utero, and through lactation (F1 generation, n=1011/group, obtained from 5 different litters per group), germ-cell (F2 generation, n=11/group obtained from 5 different litters per group) or ancestral (F3 generation, n=11/group, obtained from 5 different litters per group) exposure to an EDC mixture or vehicle from P2 to 8. Bar graphs show pooled time spent licking and grooming from P2–8. (A–D, right). Time spent by dams resting alone outside the nest not being involved in maternal care in F0–F3 females. Bar graphs show pooled time spent resting alone from P2–8. Plotted lines represent average time±SEM (*p<0.05 vs. CTL, two-way ANOVA followed by Sidak’s multiple comparisons test). Summary data are reported in Table S3. Note: ANOVA, analysis of variance; CTL, control; EDC, endocrine-disrupting chemical; SEM, standard error of the mean.
Figure 6a is a clustered bar graph titled uppercase f 3 mediobasal hypothalamus, plotting messenger ribonucleic acid (arbitrary units), ranging from 0.0 to 2.5 in increments of 0.5 and 3 to 7 in unit increments (y-axis) across T h, D n m1 m D r d1, and Darp p32 (x-axis) for infant, prepubertal, and adult. Figure 6b is a clustered bar graph titled uppercase f 1 T h p, plotting percent methylation, ranging from 0.0 to 1.0 in increments of 0.2 (y-axis) across C p G sites, ranging from 1 to 13 in unit increments (x-axis). Figure 6c is a bar graph titled uppercase f 1 T h p, plotting percent input, ranging from 0 to 5 in unit increments (y-axis) across H3K27m e3, H3K9m e3, H3K4m e3, and H3K9a c, including control and endocrine disrupting chemicals. Figure 6d is a set of two line graphs, plotting uppercase y (micrometer), ranging from 300 to 0 in decrements of 50 (y-axis) across y (micrometer), ranging from 0 to 800 in increments of 100 (x-axis) for control, T H, mPoA, and third ventricle; and Endocrine Disrupting Chemicals, T H, mPoA, and third ventricle, respectively. Figure 6e is a bar graph, plotting T H-ir cells per cubic millimeter, ranging from 0 to 200 in increments of 50 (left y-axis) and T H-ir cells per cubic millimeter, ranging from 0 to 5 in unit increments (right y-axis) across control, endocrine disrupting chemicals, control, endocrine disrupting chemicals, control, and endocrine disrupting chemicals for S N, V T A, and mPoA. Figure 6f is a clustered bar graph titled uppercase f 3 mediobasal hypothalamus, plotting messenger ribonucleic acid (arbitrary units), ranging from 0.0 to 1.5 in increments of 0.5 (y-axis) across T H and D r d1 (x-axis) for infant, prepubertal, and adult. Figure 6g is a clustered bar graph titled uppercase f 3 T h p, plotting percent methylation, ranging from 0.0 to 1.0 in increments 0.2 (y-axis) across C p G site, ranging from 1 to 13 in unit increments (x-axis) for control and endocrine disrupting chemicals. Figure 6h is a bar graph titled uppercase f 3 T h p, plotting percent input, ranging from 0 to 6 in unit increments (y-axis) across H3K27m e3, H3K9m e3, H3K4m e3, and H3K9a c, including control and endocrine disrupting chemicals.
Figure 6.
Dopaminergic signaling proteins, mRNA expression and chromatin state in the female rat in utero (F1 generation) and ancestrally (F3 generation) exposed to EDC mixture or vehicle. (A) Expression of Th, Dnm1, Drd1, and Darpp32 mRNA in the MBH-PoA of infant (P6), prepubertal (P21) and adult (P60) F1 female as determined by qPCR (n=6/group). Samples originates from six different litters per group. RNA expression data were normalized by dividing each individual value by the control group average value at every time point. (B) Methylation state at 13 CpG sites of the Th gene promoter from MBH-PoA explants of F1 females at P21 (n=6/group). Samples originates from six different litters per group. (C) Abundance of the TrxG-dependent activating marks H3K4me3 and H3K9ac and the PcG-dependent repressive mark H3K27me3 and H3K9me3 at the Th promoter in the prepubertal MBH-PoA of F1 females, as measured by ChIP (n=6/group). Samples originate from 6 different litters per group. (D) Abundance of Th-immunoreactive cells (green) within the mPoA of F1 prepubertal female rats. (E) Quantification of Th immunoreactivity in the SN, VTA, and mPoA of F1 females. Bars represent mean number of cells per cubic millimeter±SEM; (F) Expression of Th and Drd1 mRNA in the MBH-PoA of infant (P6), prepubertal (P21), and adult (P60) F3 females (n=6/group). Samples originates from 6 different litters per group. (G) Methylation state at 13 CpG sites of the Th gene promoter from MBH-PoA explants of F3 females at P2 (n=6/group) Samples originates from six different litters per group. (H) Abundance of H3K4me3, H3K9ac, H3K27me3, and H3K9me3 histone posttranslational modifications at the Th promoter in the prepubertal MBH-PoA of F3 females, as measured by ChIP (n=6/group). Dotted red lines represent repressive histone modifications (H3K27me3 and H3K9me3). Green solid lines represent activatory histone modifications (H3K27me3 and H3K9ac). EDC data from panels A, C, F, and H were normalized to control data. Samples originates from six different litters per group. Bars represent mean±SEM (*p<0.05, **p<0.01, ***p<0.001 vs. CTL). Data was analyzed using either two-way ANOVA (6A), followed by Sidak’s multiple comparisons test or Student’s t-test (6B–H). Summary data are reported in Table S3. Note: 3V, third ventricle; ANOVA, analysis of variance; AU, arbitrary units; ChIP, chromatin immunoprecipitation; CTL, control; EDC, endocrine-disrupting chemical; SN, substantia nigra; Th, tyrosine hydroxylase; VTA, ventral tegmental area.
Figures 7a, 7c, and 7d are bar graphs titled uppercase f 2 vaginal opening, uppercase f 2 licking, and uppercase f 3 vaginal opening, plotting age at vaginal opening, ranging from 30 to 40 in unit increments; minutes, ranging from 0 to 16 in increments of 2; and age at vaginal opening, ranging from 30 to 40 in unit increments (y-axis) across C C, E C, E E, and C E (x-axis). Figure 7b is a clustered bar graph titled uppercase f 2 estrous cycle, plotting percent females, ranging from 0 to 100 in increments of 20 (left y-axis) across precent time, ranging from 0 to 80 in increments of 20 (right y-axis) across regular cycle, proestrus, estrus, and diestrus (x-axis) for C C, E C, E E, and E C. Figure 7e is a set of bar graphs, titled H3K27m e3, plotting messenger ribonucleic acid (arbitrary units), ranging from 0.0 to 2.0 in increments of 0.5 and chromatin immunoprecipitation (arbitrary units), ranging from 0 to 8 in increments of 2 (y-axis) across C C, E C, E E, and C E (x-axis) for uppercase f 2 kiss1 and kiss1p, respectively. Figure 7f is a set of bar graphs, titled H3K9a c, plotting messenger ribonucleic acid (arbitrary units), ranging from 0.0 to 2.5 in increments of 0.5 and chromatin immunoprecipitation (arbitrary units), ranging from 0.0 to 2.0 in increments of 0.5 (y-axis) across C C, E C, E E, and C E (x-axis) for uppercase f 2 E s r1 and E s r1p, respectively. Figure 7g is a set of bar graphs, titled H3K4me3, plotting messenger ribonucleic acid (arbitrary units), ranging from 0.0 to 2.0 in increments of 0.5 and chromatin immunoprecipitation (arbitrary units), ranging from 0 to 4 in unit increments (y-axis) across C C, E C, E E, and C E (x-axis) for uppercase f 2 O x t and O x t p, respectively. Figure 7h is a set of bar graphs, titled H3K27m e3, plotting messenger ribonucleic acid (arbitrary units), ranging from 0.0 to 2.0 in increments of 0.5 and chromatin immunoprecipitation (arbitrary units), ranging from 0 to 4 in unit increments (y-axis) across C C, E C, E E, and C E (x-axis) for uppercase f 2 T h and T h p, respectively. Figure 7i is a set of bar graphs, titled H3K27m e3, plotting messenger ribonucleic acid (arbitrary units), ranging from 0.0 to 2.0 in increments of 0.5 and chromatin immunoprecipitation (arbitrary units), ranging 0 to 4 in unit increments (y-axis) across C C, E C, E E, and C E (x-axis) for uppercase f 3 kiss1 and kiss1p, respectively. Figure 7j is a set of bar graphs, titled H3K9a c, plotting messenger ribonucleic acid (arbitrary units), ranging from 0.0 to 2.0 in increments of 0.5 and chromatin immunoprecipitation (arbitrary units), ranging from 0.0 to 2.0 in increments of 0.5 (y-axis) across C C, E C, E E, and C E (x-axis) for uppercase f 3 E s r1 and E s r1p, respectively. Figure 7k is a set of bar graphs, titled H3K4m e3, plotting messenger ribonucleic acid (arbitrary units), ranging from 0.0 to 2.0 in increments of 0.5 and chromatin immunoprecipitation (arbitrary units), ranging from 0.0 in increments of 2 (y-axis) across C C, E C, E E, and C E (x-axis) for uppercase f 3 O x t and O x t p, respectively. Figure 7l is a set of bar graphs, titled H3K27m e3, plotting messenger ribonucleic acid (arbitrary units), ranging from 0.0 to 2.0 in increments of 0.5 and chromatin immunoprecipitation (arbitrary units), ranging from 0 to 3 in unit increments (y-axis) across C C, E C, E E, and C E (x-axis) for uppercase f 3 T h and T h p, respectively.
Figure 7.
Sexual maturation and mRNA expression data in cross-fostered F2 offspring. (A) Average age at vaginal opening of cross-fostered germ cell (F2) EDC-exposed pups or controls raised by either in utero EDC-exposed dams or controls (n=1219/group). Samples originates from 6–12 F1 generation litters per group. (B) Percentage of cross-fostered females having regular cycle and time spent in each stage of the estrous cycle (n=10/group). (C) Time spent by cross-fostered F2 dams displaying licking and grooming (n=8/group). (D) Average age at VO in F3 females (n=10/group). Samples originates from 610 litters. (E–H and M–P) Expression of Kiss1, Esr1, Oxt, and Th mRNA in the MBH-PoA of cross-fostered F2 and F3 pups at P21, as determined by qPCR (n=6/group). Samples originates from six litters. Data from the CE, EC, and EE groups were normalized to the CC group. (I–L and Q–T) Abundance of the TrxG-dependent activating marks H3K4me3, H3K9ac, or the PcG-dependent repressive mark H3K27me3 at the Kiss1, Esr1, Oxt, and Th promoter in the prepubertal MBH-PoA of cross-fostered F2 and F3 females, as measured by ChIP (n=6/group). Samples originates from six litters. Summary data are reported in Table S4. Bars represent mean±SEM (*p<0.05, **p<0.01, ***p<0.001 vs. CC; †p<0.05, ††p<0.01, †††p<0.001 vs. CE, one-way ANOVA). Note: ANOVA, analysis of variance; CC, control pup raised by control dam; CE, germ-cell EDC-exposed pup raised by control dam; ChIP, chromatin immunoprecipitation; D, diestrus; E, estrus; EC, control pup raised by in utero EDC-exposed dam; EDC, endocrine-disrupting chemical; EE, germ-cell EDC-exposed pup raised by in utero EDC-exposed dam; Oxt, oxytocin; P, proestrus; Reg. cycle, regular cycle; SEM, standard error of the mean; Th, tyrosine hydroxylase; VO, vaginal opening.

Comment in

Similar articles

Cited by

References

    1. Adewale HB, Jefferson WN, Newbold RR, Patisaul HB. 2009. Neonatal bisphenol-A exposure alters rat reproductive development and ovarian morphology without impairing activation of gonadotropin-releasing hormone neurons. Biol Reprod 81(4):690–699, PMID: 19535786, 10.1095/biolreprod.109.078261. - DOI - PMC - PubMed
    1. Aksglaede L, Sørensen K, Petersen JH, Skakkebaek NE, Juul A. 2009. Recent decline in age at breast development: the Copenhagen Puberty Study. Pediatrics 123(5):e932–e939, PMID: 19403485, 10.1542/peds.2008-2491. - DOI - PubMed
    1. Arambula SE, Belcher SM, Planchart A, Turner SD, Patisaul HB. 2016. Impact of low dose oral exposure to bisphenol A (BPA) on the neonatal rat hypothalamic and hippocampal transcriptome: a CLARITY-BPA Consortium study. Endocrinology 157(10):3856–3872, PMID: 27571134, 10.1210/en.2016-1339. - DOI - PMC - PubMed
    1. Axelstad M, Christiansen S, Boberg J, Scholze M, Jacobsen PR, Isling LK, et al. . 2014. Mixtures of endocrine-disrupting contaminants induce adverse developmental effects in preweaning rats. Reproduction 147(4):489–501, PMID: 24298046, 10.1530/REP-13-0447. - DOI - PubMed
    1. Berger A, Ziv-Gal A, Cudiamat J, Wang W, Zhou C, Flaws JA. 2016. The effects of in utero bisphenol A exposure on the ovaries in multiple generations of mice. Reprod Toxicol 60:39–52, PMID: 26746108, 10.1016/j.reprotox.2015.12.004. - DOI - PMC - PubMed

Publication types

Substances