Comparative Study
. 2021 Aug 12;19(8):e3001336.
doi: 10.1371/journal.pbio.3001336. eCollection 2021 Aug.

Global and national trends, gaps, and opportunities in documenting and monitoring species distributions

Affiliations
Comparative Study

Global and national trends, gaps, and opportunities in documenting and monitoring species distributions

Ruth Y Oliver et al. PLoS Biol. .

Abstract

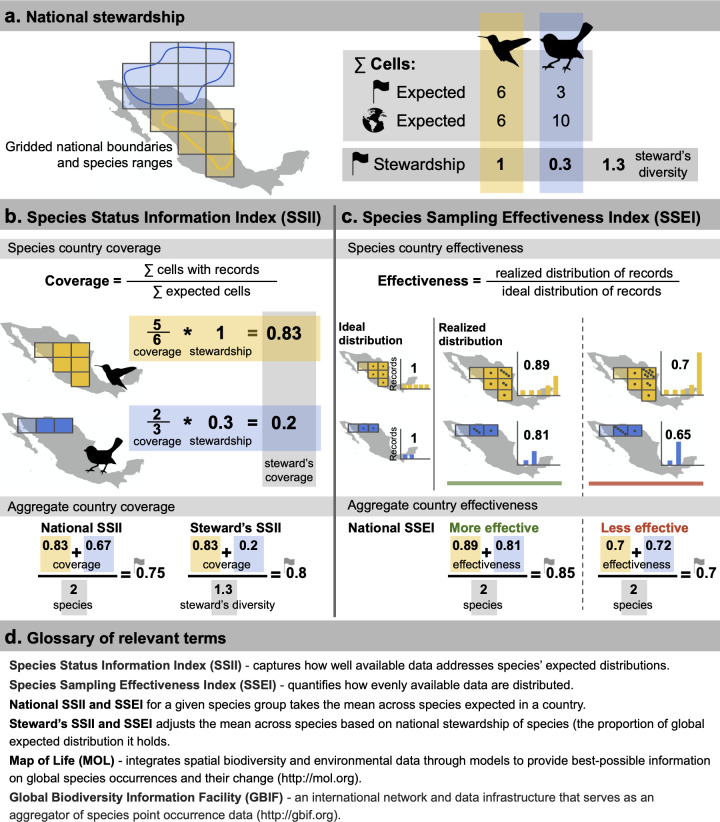
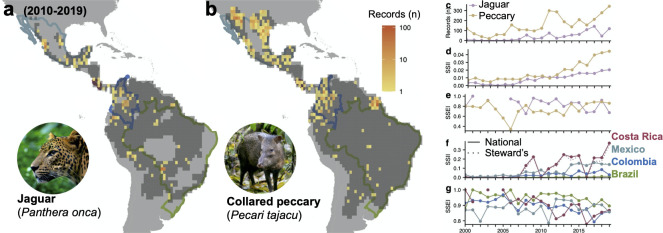
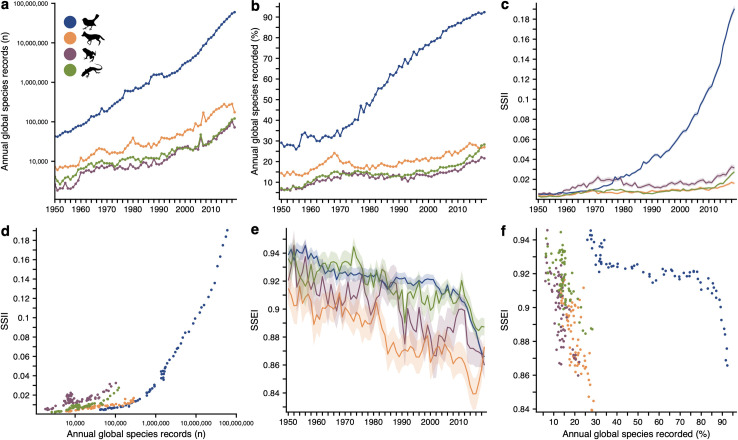
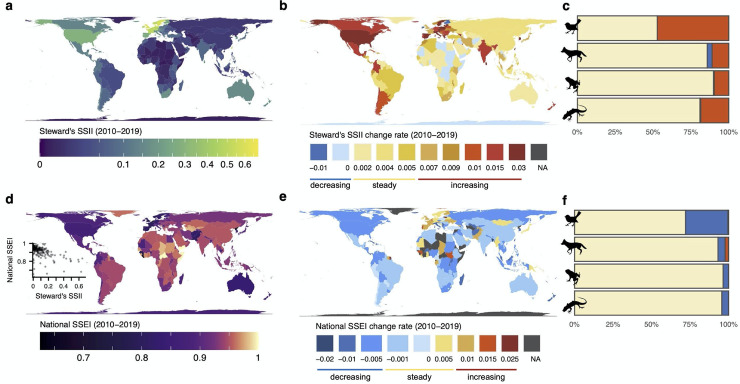
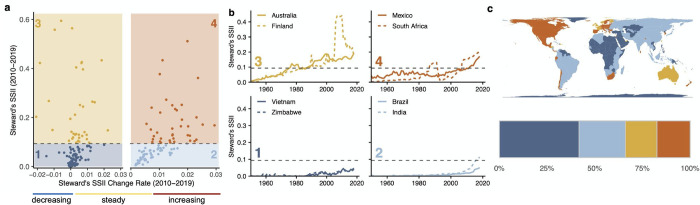
Conserving and managing biodiversity in the face of ongoing global change requires sufficient evidence to assess status and trends of species distributions. Here, we propose novel indicators of biodiversity data coverage and sampling effectiveness and analyze national trajectories in closing spatiotemporal knowledge gaps for terrestrial vertebrates (1950 to 2019). Despite a rapid rise in data coverage, particularly in the last 2 decades, strong geographic and taxonomic biases persist. For some taxa and regions, a tremendous growth in records failed to directly translate into newfound knowledge due to a sharp decline in sampling effectiveness. However, we found that a nation's coverage was stronger for species for which it holds greater stewardship. As countries under the post-2020 Global Biodiversity Framework renew their commitments to an improved, rigorous biodiversity knowledge base, our findings highlight opportunities for international collaboration to close critical information gaps.


Conflict of interest statement

The authors have declared that no competing interests exist.

Figures

Fig 1
Fig 1. SSII and SSEI metrics of biodiversity data coverage and effectiveness.
The metrics are illustrated for 2 hypothetical species with geographic range delineated by binary (e.g., expert range) maps and are assessed for an example 110-km equal-area grid. (a) National stewardship of species is calculated based on the relative portion of species’ ranges falling inside a country. (b) At the species level, the SSII is given as the proportion of cells expected occupied with records in a given year. In this hypothetical example, coverage is 0.83 and 0.67 for species where 5 out of 6 and 2 out 3 expected grid cells have data. Steward’s SSII adjusts this coverage by their respective national stewardship (0.83 and 0.2). Species-level SSII can be aggregated to the national level via 2 formulations. National SSII for a given taxonomic group takes the mean coverage across all species expected in a country (0.75). Steward’s SSII adjusts the mean coverage across species by their respective national stewardship (0.8). (c) SSEI compares the entropy of the realized distribution of records to that of the ideal distribution (see Text A in S1 File), where uneven sampling (lower SSEI) is considered less effective than more even sampling (higher SSEI). National SSEI takes the mean across all species expected in a country. (d) Glossary of relevant terms. Artwork from plylopics.org (see Text A in S1 File). GBIF, Global Biodiversity Information Facility; MOL, Map of Life; SSEI, Species Sampling Effectiveness Index; SSII, Species Status Information Index.
Fig 2
Fig 2. Species and national example patterns and trends.
SSII and SSEI trends illustrated for 2 species, the jaguar (Panthera onca) and collared peccary (Pecari tajacu). (a, b) The expected occupied cells are shown in dark gray, and total number of records collected 2010–2019 in color. (c–e) Species-level time series of the total number of records (c), Global SSII for the whole species range (i.e., all countries with expected range) (d), and Global SSEI (e) across their expected range. (f, g) Resulting National and Steward’s SSII (f) and SSEI (g) for 4 countries. Photographs from Wikimedia (see Text A in S1 File). National boundaries from gadm.org. Numerical values available in Tables A and B in S1 File. The data underlying this figure may be found in https://mol.org/indicators/coverage and https://github.com/MapofLife/biodiversity-data-gaps. SSEI, Species Sampling Effectiveness Index; SSII, Species Status Information Index.
Fig 3
Fig 3. Global trends data coverage and sampling effectiveness across 4 terrestrial vertebrate groups.
(a–c) Trends in total annual record counts (a), percentage of expected species recorded (b), and the Global SSII (c). Global SSII is based on data coverage across species’ ranges without consideration of national boundaries. Alternatively, Global SSII for a species is the sum of Steward’s SSII across the nations where it is expected to occur. (d) Relationship between annual total record counts and Global SSII. (e) Trends in Global SSEI. (f) Relationship between percentage of expected species recorded and Global SSEI. (c, e) Lines and shading represent means and 95% confidence intervals across species within classes. (d, f) Relationships are shown over the past 70 years (1950–2019). Colors in a–f indicate birds (blue), mammals (orange), amphibians (purple), and reptiles (green). Artwork from phylopics.org (see Text A in S1 File). The data underlying this figure may be found in https://mol.org/indicators/coverage and https://github.com/MapofLife/biodiversity-data-gaps. SSEI, Species Sampling Effectiveness Index; SSII, Species Status Information Index.
Fig 4
Fig 4. National patterns and trends in spatial biodiversity data coverage and sampling effectiveness.
(a, d) Mean Steward’s SSII (a) and National SSEI (d) over the previous decade (2010–2019) averaged across terrestrial vertebrates; the relationship between data coverage and sampling effectiveness is shown as inset. (b, e) Change rate in Steward’s SSII (b) and National SSEI (e) over the previous decade. Maximum values for each color bin are labeled below each map. (c, f) Percentage of nations with no significant (p < 0.01) trends (beige) and significant decreasing (blue) or increasing (red) trends in Steward’s SSII (c) and SSEI (f) over the previous decade for birds, mammals, amphibians, and reptiles. Artwork from phylopics.org (see Text A in S1 File). National boundaries from gadm.org. The data underlying this figure may be found in https://mol.org/indicators/coverage and https://github.com/MapofLife/biodiversity-data-gaps. SSEI, Species Sampling Effectiveness Index; SSII, Species Status Information Index.
Fig 5
Fig 5. Typologies of nations’ data coverage and trends.
(a) Mean values and change rates in Steward’s SSII over the previous decade (2010–2019). Horizontal dashed line represents the global mean of Steward’s SSII. Left panels show nations with no significant or decreasing trends in coverage. Right panels show nations with significant (p < 0.01) increasing trends in coverage. We categorized nations into the following 4 main types based on Steward’s SSII status and trends over the previous decade: (1) coverage less than the global mean with no or decreasing trend (2010–2019) (42% of nations); (2) coverage less than the global mean with an increasing trend (24%); (3) coverage greater than the global mean with no or decreasing trend (17%); and (4) coverage greater than the global mean with an increasing trend (17%). (b) Example time series for nations within each type. (c) National assignment to quadrants. Bar plot shows percentages of nations within each quadrant. National boundaries from gadm.org. The data underlying this figure may be found in https://mol.org/indicators/coverage and https://github.com/MapofLife/biodiversity-data-gaps. SSII, Species Status Information Index.

References

    1. Bonebrake TC, Brown CJ, Bell JD, Blanchard JL, Chauvenet A, Champion C, et al.. Managing consequences of climate-driven species redistribution requires integration of ecology, conservation and social science. Biol Rev. 2018;93(1):284–305. doi: 10.1111/brv.12344 - DOI - PubMed
    1. Pecl GT, Araújo MB, Bell JD, Blanchard J, Bonebrake TC, Chen I-C, et al.. Biodiversity redistribution under climate change: Impacts on ecosystems and human well-being. Science. 2017Mar31;355(6332):eaai9214. doi: 10.1126/science.aai9214 - DOI - PubMed
    1. Díaz S, Zafra-Calvo N, Purvis A, Verburg PH, Obura D, Leadley P, et al.. Set ambitious goals for biodiversity and sustainability. Science. 2020Oct23;370(6515):411–3. doi: 10.1126/science.abe1530 - DOI - PubMed
    1. Jung M, Arnell A, de Lamo X, García-Rangel S, Lewis M, Mark J, et al.. Areas of global importance for terrestrial biodiversity, carbon, and water [Internet]. Ecology; 2020Apr [cited 2020 Oct 22]. Available from: http://biorxiv.org/lookup/doi/10.1101/2020.04.16.021444 - DOI
    1. Leclère D, Obersteiner M, Barrett M, Butchart SHM, Chaudhary A, De Palma A, et al.. Bending the curve of terrestrial biodiversity needs an integrated strategy. Nature. 2020Sep;585(7826):551–6. doi: 10.1038/s41586-020-2705-y - DOI - PubMed

Publication types