

Household Transmission of Severe Acute Respiratory Syndrome Coronavirus 2 in the United States: Living Density, Viral Load, and Disproportionate Impact on Communities of Color
- PMID: 34383889
- PMCID: PMC8436395
- DOI: 10.1093/cid/ciab701
Household Transmission of Severe Acute Respiratory Syndrome Coronavirus 2 in the United States: Living Density, Viral Load, and Disproportionate Impact on Communities of Color
Abstract
Background: Households are hot spots for severe acute respiratory syndrome coronavirus 2 transmission.
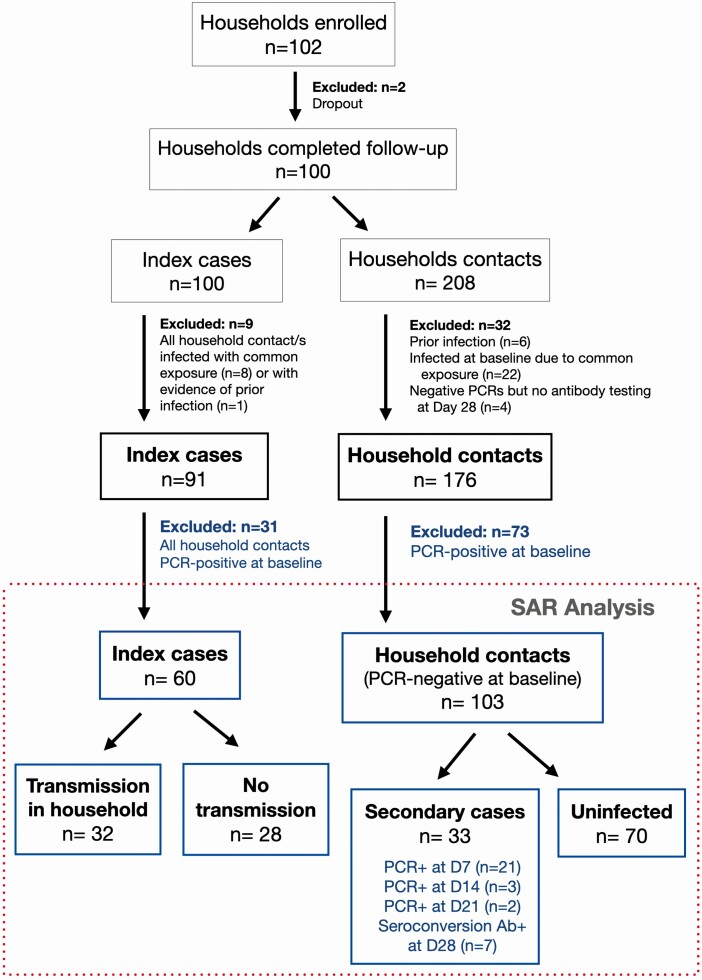
Methods: This prospective study enrolled 100 coronavirus disease 2019 (COVID-19) cases and 208 of their household members in North Carolina though October 2020, including 44% who identified as Hispanic or non-White. Households were enrolled a median of 6 days from symptom onset in the index case. Incident secondary cases within the household were detected using quantitative polymerase chain reaction of weekly nasal swabs (days 7, 14, 21) or by seroconversion at day 28.
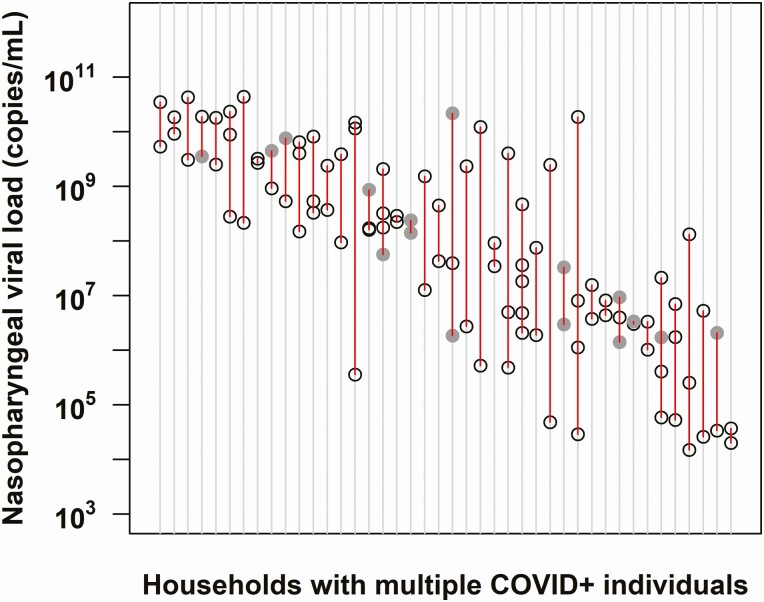
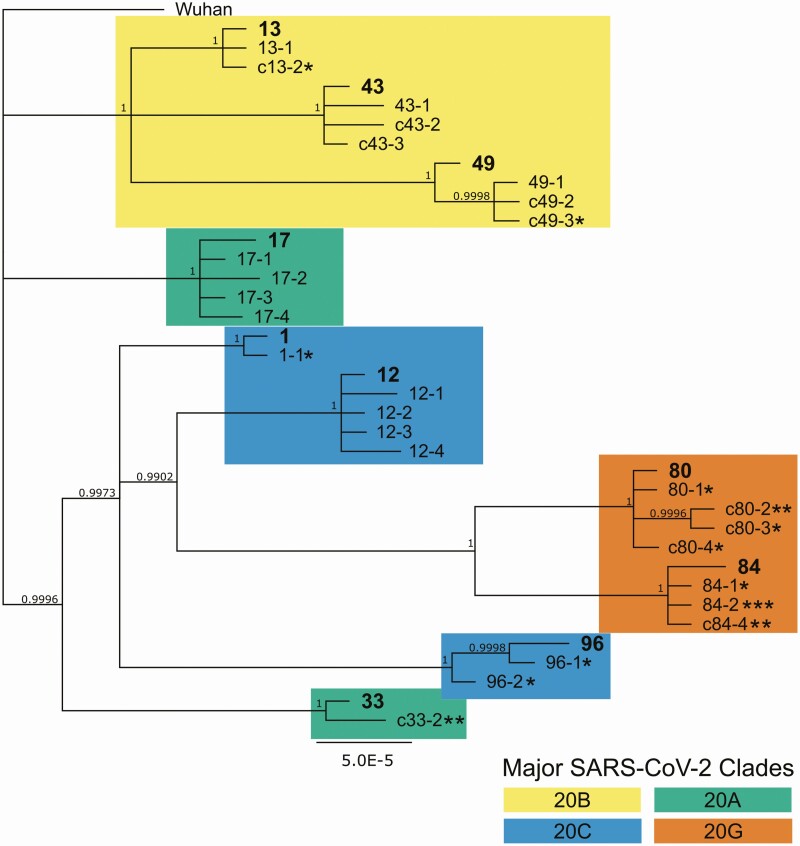
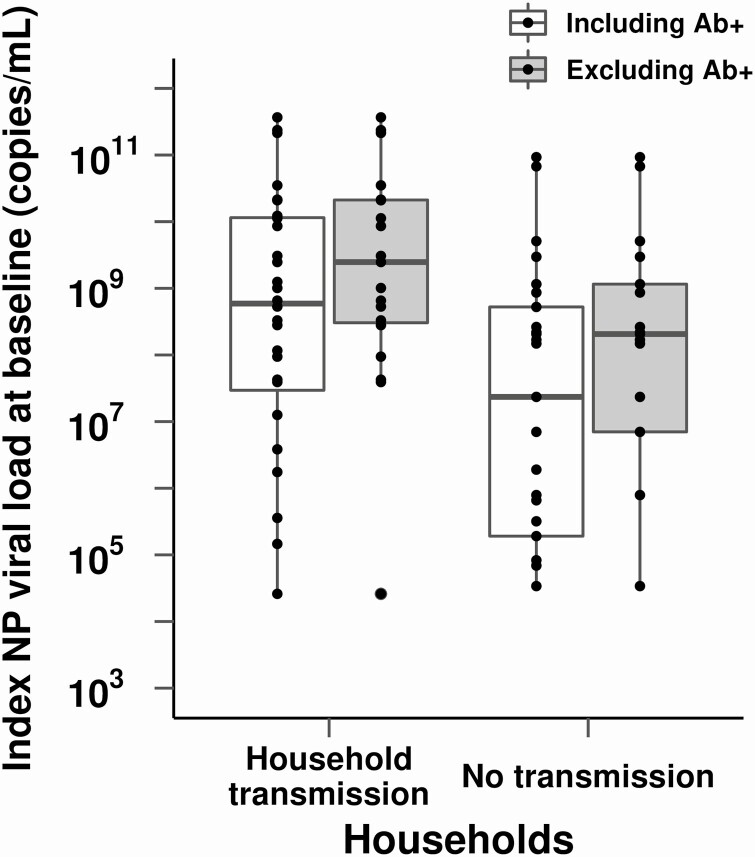
Results: Excluding 73 household contacts who were PCR-positive at baseline, the secondary attack rate (SAR) among household contacts was 32% (33 of 103; 95% confidence interval [CI], 22%-44%). The majority of cases occurred by day 7, with later cases confirmed as household-acquired by viral sequencing. Infected persons in the same household had similar nasopharyngeal viral loads (intraclass correlation coefficient = 0.45; 95% CI, .23-.62). Households with secondary transmission had index cases with a median viral load that was 1.4 log10 higher than those without transmission (P = .03), as well as higher living density (more than 3 persons occupying fewer than 6 rooms; odds ratio, 3.3; 95% CI, 1.02-10.9). Minority households were more likely to experience high living density and had a higher risk of incident infection than did White households (SAR, 51% vs 19%; P = .01).
Conclusions: Household crowding in the context of high-inoculum infections may amplify the spread of COVID-19, potentially contributing to disproportionate impact on communities of color.
Keywords: SARS-CoV-2; household transmission; living density; secondary attack rate; viral load.
© The Author(s) 2021. Published by Oxford University Press for the Infectious Diseases Society of America. All rights reserved. For permissions, e-mail: journals.permissions@oup.com.
Figures
Update of
-
High household transmission of SARS-CoV-2 in the United States: living density, viral load, and disproportionate impact on communities of color.medRxiv [Preprint]. 2021 Mar 12:2021.03.10.21253173. doi: 10.1101/2021.03.10.21253173. medRxiv. 2021. Update in: Clin Infect Dis. 2022 May 30;74(10):1776-1785. doi: 10.1093/cid/ciab701. PMID: 33758871 Free PMC article. Updated. Preprint.
References
-
- Report of the WHO-China Joint Commission on Coronavirus Disease 2019 (COVID-19). Available at: https://www.who.int/docs/default-source/coronaviruse/who-china-joint-mis.... Accessed 16 February 2021.
-
- Centers for Disease Control and Prevention. Public health guidance for community-related exposure. 2020. Available at: https://www.cdc.gov/coronavirus/2019-ncov/php/public-health-recommendati.... Accessed 16 February 2021.
-
- He X, Lau EHY, Wu P, et al. Temporal dynamics in viral shedding and transmissibility of COVID-19. Nat Med 2020; 26:672–5. - PubMed
-
- Tindale LC, Stockdale JE, Coombe M, et al. Evidence for transmission of COVID-19 prior to symptom onset. Elife 2020; 9. doi: 10.7554/eLife.57149. - DOI - PMC - PubMed
-
- Benefield AE, Skrip LA, Clement A, Althouse RA, Chang S, Althouse BM. SARS-CoV-2 viral load peaks prior to symptom onset: a systematic review and individual-pooled analysis of coronavirus viral load from 66 studies. bioRxiv [Preprint]. 2020. Available from: http://medrxiv.org/lookup/doi/10.1101/2020.09.28.20202028. - DOI
Publication types
MeSH terms
Grants and funding
LinkOut - more resources
Full Text Sources
Other Literature Sources
Medical
Miscellaneous
