. 2021 Sep;35(9):e21802.
doi: 10.1096/fj.202100563R.

Zfhx3 modulates retinal sensitivity and circadian responses to light

Affiliations

Zfhx3 modulates retinal sensitivity and circadian responses to light

Steven Hughes et al. FASEB J. 2021 Sep.

Abstract

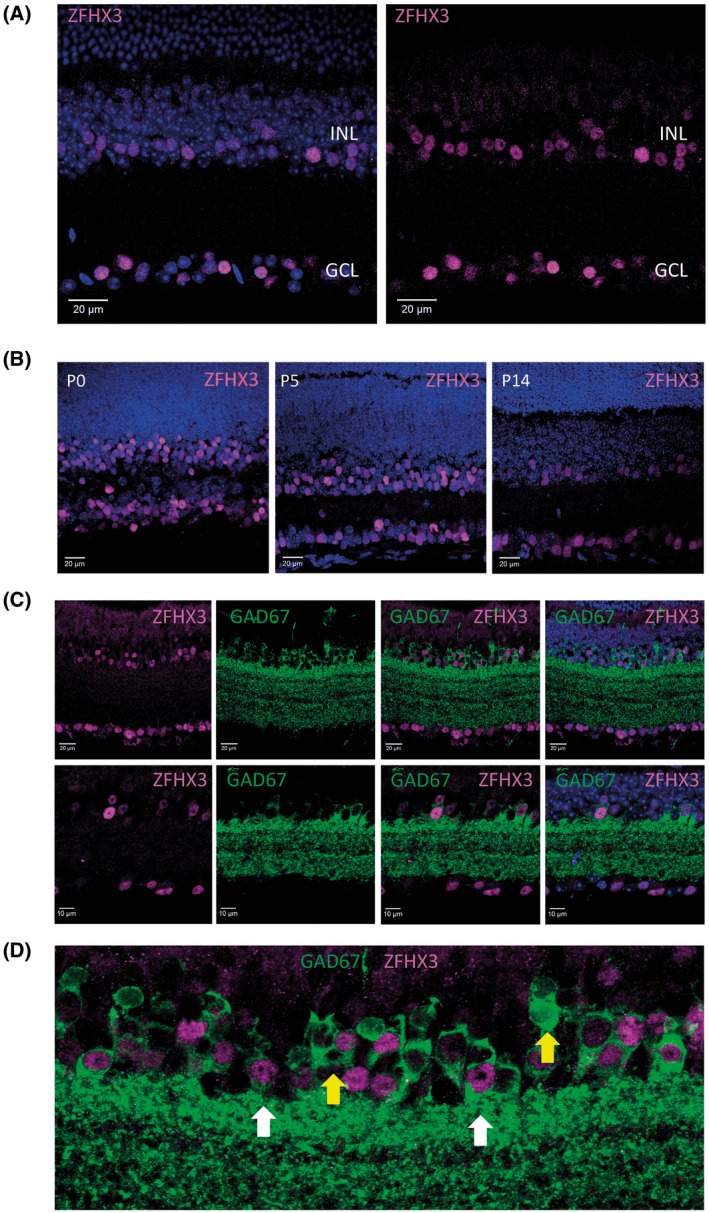
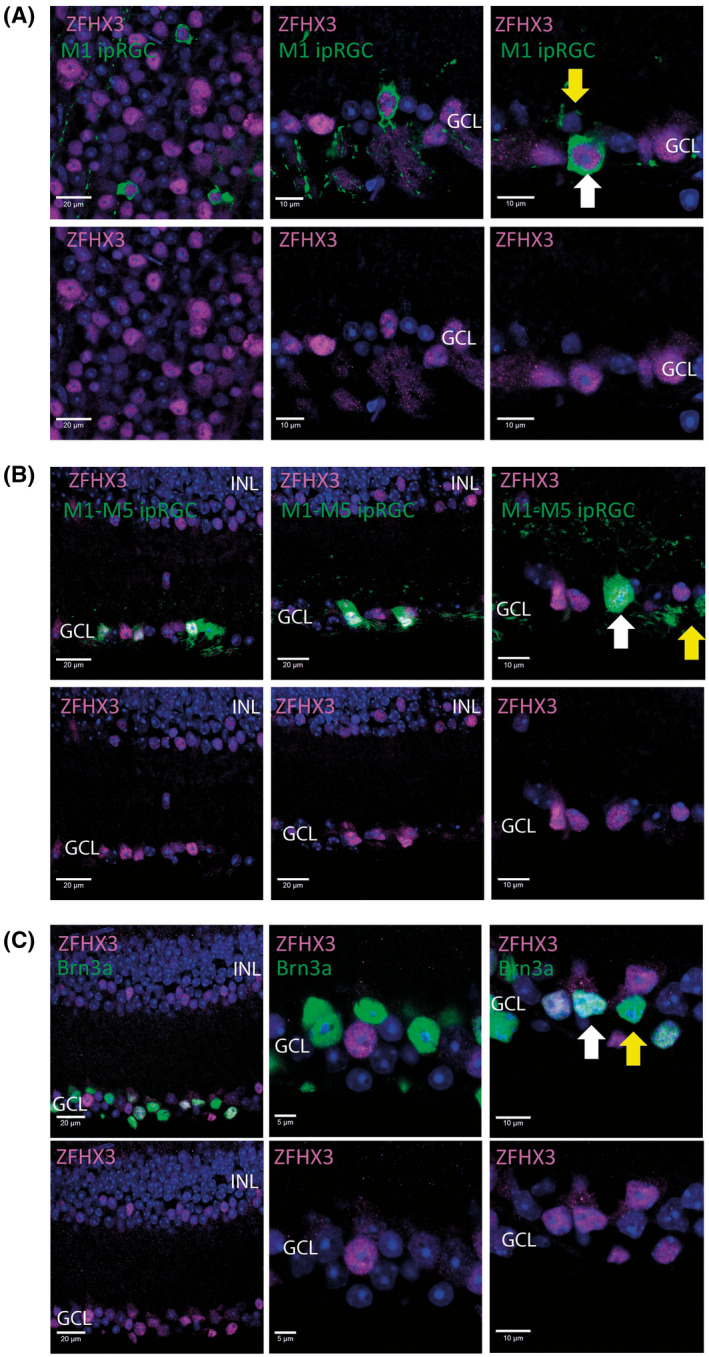
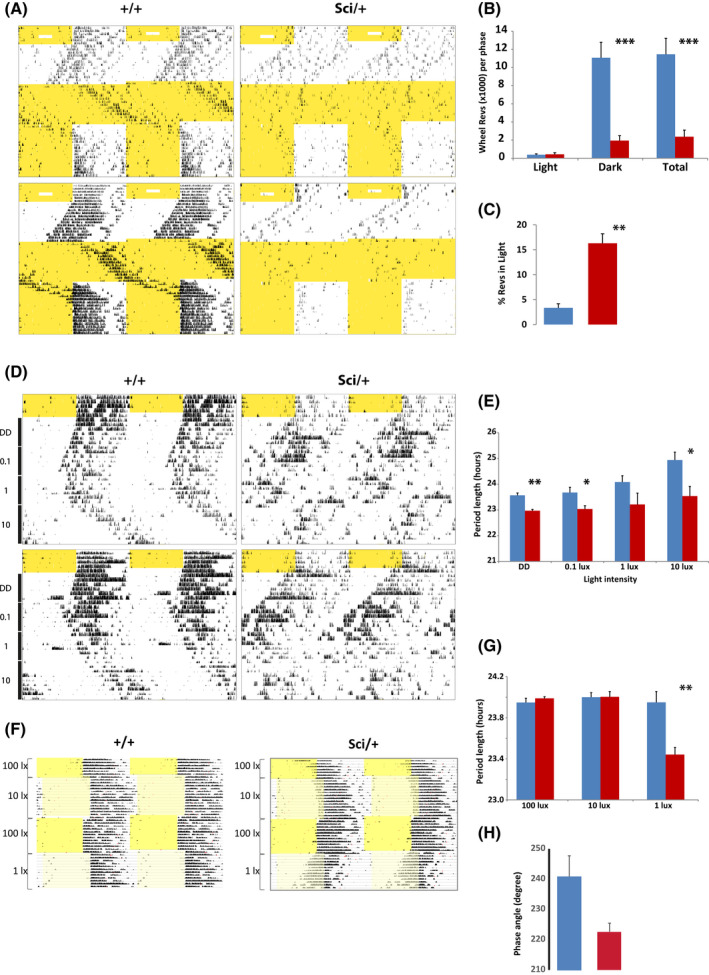
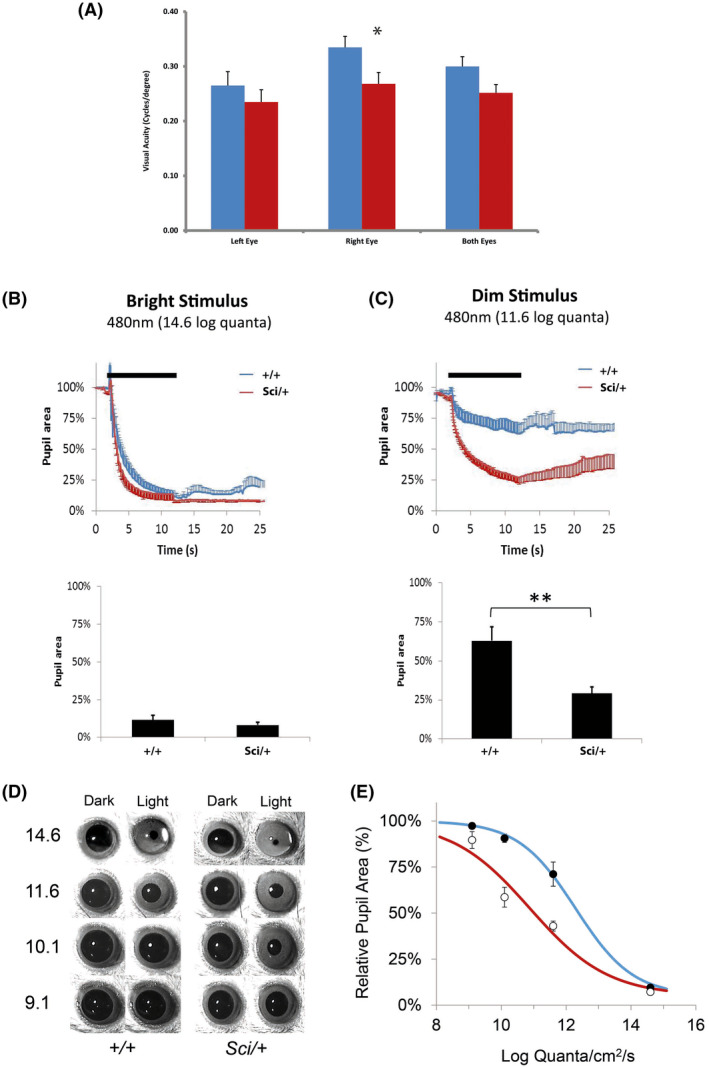
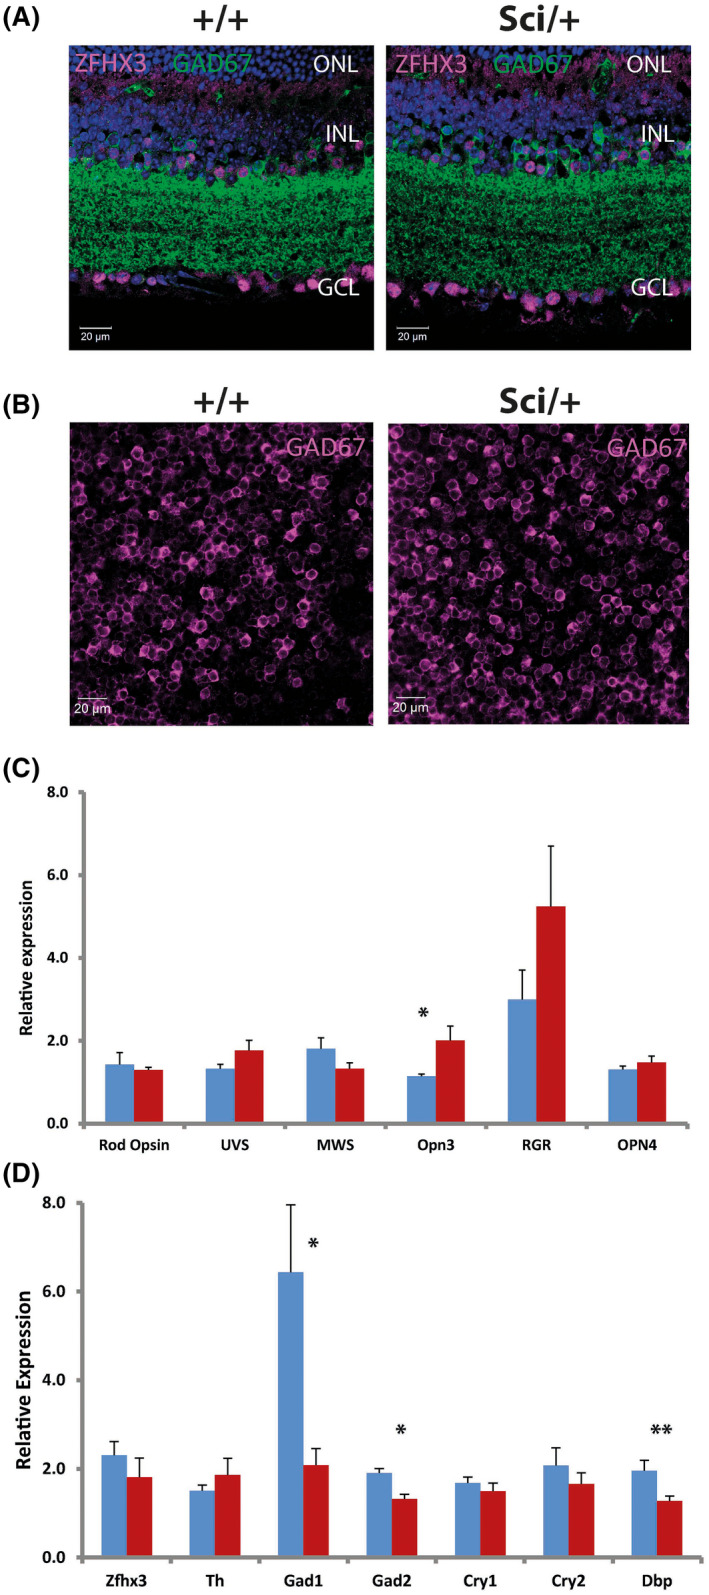
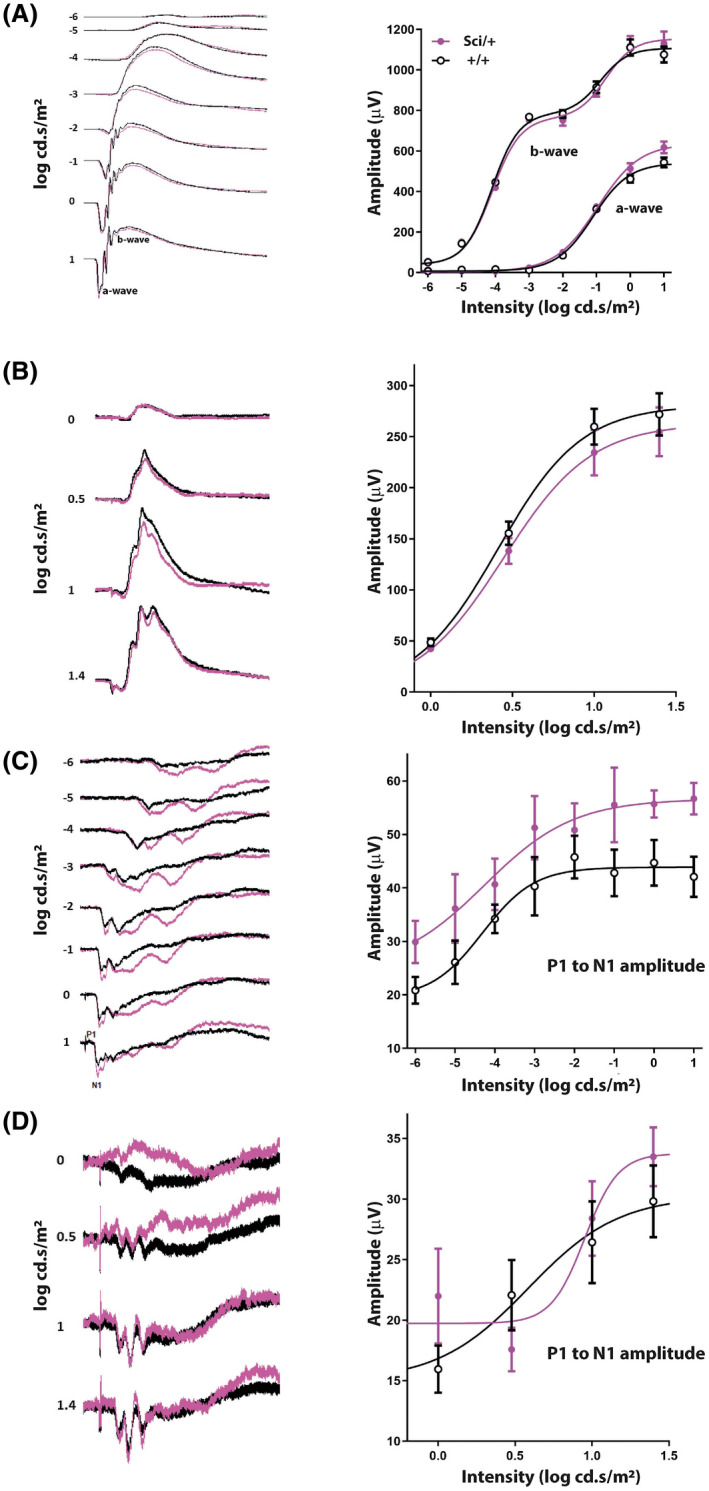
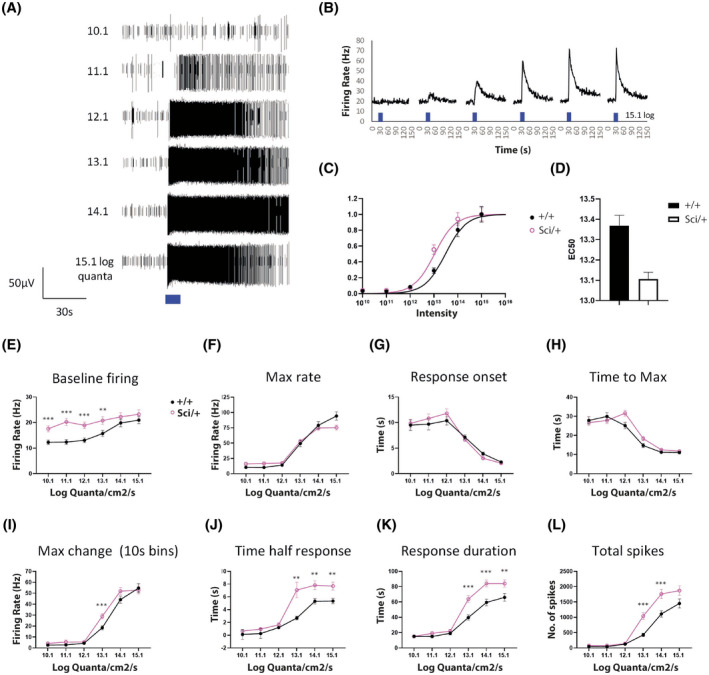
Mutations in transcription factors often exhibit pleiotropic effects related to their complex expression patterns and multiple regulatory targets. One such mutation in the zinc finger homeobox 3 (ZFHX3) transcription factor, short circuit (Sci, Zfhx3Sci/+ ), is associated with significant circadian deficits in mice. However, given evidence of its retinal expression, we set out to establish the effects of the mutation on retinal function using molecular, cellular, behavioral and electrophysiological measures. Immunohistochemistry confirms the expression of ZFHX3 in multiple retinal cell types, including GABAergic amacrine cells and retinal ganglion cells including intrinsically photosensitive retinal ganglion cells (ipRGCs). Zfhx3Sci/+ mutants display reduced light responsiveness in locomotor activity and circadian entrainment, relatively normal electroretinogram and optomotor responses but exhibit an unexpected pupillary reflex phenotype with markedly increased sensitivity. Furthermore, multiple electrode array recordings of Zfhx3Sci/+ retina show an increased sensitivity of ipRGC light responses.

Keywords: amacrine cell; light sensitivity; mutation; pleiotropy; pupillary reflex.


Conflict of interest statement

The authors declare no competing interests.

Figures

FIGURE 1
FIGURE 1
ZFHX3 is expressed in GAD67‐positive amacrine cells. A, Images from retina flat‐mounts (left) and retina sections showing the localization of ZFHX3 in adult mouse retina (age > P60), with ZFHX3 expressing cells located predominately on the inner surface of the INL and the GCL. B, Images showing the localization of ZFHX3 in the mouse retina throughout postnatal development (ages P0, P5 and P14), showing higher levels of ZFHX3 expression during early postnatal development. C, Images showing the co‐localization of ZFHX3 and the GABAergic amacrine cell marker GAD67 in adult mouse retina. D, Higher magnification of (C). ZFHX3 expression within the INL is predominately confined to GAD67 positive amacrine cells, with approximately 60% of GAD67 amacrine cells expressing detectable levels of ZFHX3. ZFHX3 expression was also detected within GAD67 positive amacrine cell located in the GCL. White arrows highlight examples of ZFHX3 expressing GAD67 amacrine cells. Yellow arrows show examples of GAD67 amacrine cells for which ZFHX3 was not detected. DAPI nuclear counter stain is shown in blue. INL, inner nuclear layer; IPL, inner plexiform layer; GCL, ganglion cell layer
FIGURE 2
FIGURE 2
ZFHX3 is expressed in diverse retinal ganglion cell layer subtypes. A, Images showing the co‐localization of ZFHX3 and βgal in the retina of adult Opn4+/−Lacz+/− mice showing consistent expression of ZFHX3 in M1 type ipRGCs. B, Images showing the co‐localization of ZFHX3 and eYFP in the retina of adult Opn4+/−Cre+/−eYFP+/+ mice showing expression of ZFHX3 in a subset of all ipRGCs (~40%), including cells with morphologies characteristic of non‐M1 ipRGCs. C, Images showing the co‐localization of ZFHX3 and the retinal ganglion cell marker BRN3A in adult mouse retina. White arrows highlight ZFHX3 positive cells. Yellow arrows show examples of cells for which ZFHX3 was not detected. DAPI nuclear counter stain is shown in blue. INL, inner nuclear layer; GCL, ganglion cell layer
FIGURE 3
FIGURE 3
Wheel running parameters in Zfhx3Sci/+ in altered light conditions and schedules. Two representative double‐plotted actograms for Zfhx3+/+ and Zfhx3Sci/+ animals (A). Animals were initially entrained to 12:12 light‐dark (LD) cycle for seven days, subjected to episodes of constant darkness (unshaded) and constant light (yellow shading) and subsequently returned to the original LD cycle. Shaded parts of actograms represent lights‐on, wheel‐running is represented as vertical black bars. B, Average wheel revolutions per phase under LD conditions for light phase, dark phase and entire 24‐hour interval in wild‐type (black, n = 6) and Zfhx3Sci/+ (red, n = 9) animals. Zfhx3Sci/+ animals show less robust wheel running overall but run more during the light phase. C, Percentage of total wheel revolutions in light phase for wild‐type (black) and Zfhx3Sci/+ (red) animals. D, Two representative double‐plotted actograms of Zfhx3+/+ and Zfhx3Sci/+ animals maintained for 5 days in 12:12 LD conditions, for 7 days in constant darkness and subsequently in constant light of increasing intensity (0.1, 1 and 10 lux) for 7 days under each condition. Shaded parts of actograms represent lights‐on, wheel‐running is represented as vertical black bars. E, Period of activity onsets in constant darkness and in constant light conditions of increasing intensity in Zfhx3+/+ (black, n = 6) and Zfhx3Sci/+ (red, n = 6) animals. F, Representative double‐plotted actograms of Zfhx3+/+ and Zfhx3Sci/+ animals in 12:12 LD conditions. Animals were initially maintained in a light‐dark cycle of 100 lux. After 7 days, light intensity was reduced to 10 lux while simultaneously delaying the phase of the LD cycle by 4 hours. Animals were subsequently returned to 100 lux conditions with a simultaneous phase advance of 4 hours and, finally, light intensity was reduced to 1 lux, again with a simultaneous phase delay of 4 hours. Shaded parts of actograms represent lights‐on, wheel‐running is represented as vertical black bars. G, Period of activity onsets in bright and dim light conditions in Zfhx3+/+ (black, n = 7) and Zfhx3Sci/+ (red, n = 7) animals. H, Phase angle of entrainment in Zfhx3+/+ and Zfhx3Sci/+ animals in 12:12 LD conditions at a light intensity of 10 lux. All values are expressed as mean ± SEM (*P < .05, **P < .01, ***P < .001)
FIGURE 4
FIGURE 4
Visual and non‐visual retinal assessment in mice. Determination of visual acuity in Zfhx3+/+ and Zfhx3Sci/+ animals using the optokinetic drum and measurements of reflexive head tracking (A). A significant difference in the visual acuity was detected between Zfhx3+/+ (blue, n = 9) and Zfhx3Sci/+ (red, n = 8) animals when comparing the right eye individually and the averaged visual acuity of both the left and right eyes (P = .037 and P = .051 respectively). No significant differences were observed between Zfhx3+/+ and Zfhx3Sci/+ when assessing the visual acuity of the left eye individually. B, Consensual pupillary response. Top panel. Traces showing change in pupil area (% of baseline) over time during and after a bright light stimulus (14.6 log quanta/cm2/s) in Zfhx3+/+ (blue, n = 7) and Zfhx3Sci/+ (red, n = 8). Bottom panel. Maximal pupil constriction in response to a bright light stimulus is equivalent in Zfhx3+/+ and Zfhx3Sci/+ animals, with pupil area reduced to approximately 10% of dark‐adapted values. C, Top panel. Traces showing the change in pupil area (% of baseline) during and following exposure to a dim light stimulus (11.6 log quanta/cm2/s). Zfhx3Sci/+ mice show an over constriction of the pupil in response to the dim light. Bottom panel. Maximal pupil constriction in response to a dim light stimulus. Zfhx3+/+ animals constrict to approximately 60% whereas Zfhx3Sci/+ animals constrict to approximately 25% (P = .0078). D, Representative images of the pupil area both before (Dark) and after (Light) stimulation for Zfhx3+/+ and Zfhx3Sci/+ animals. E, Relative percentage pupil area performed across four irradiances showing a shift in the irradiance response curve between Zfhx3+/+ and Zfhx3Sci/+ animals, equating to an approximately twenty‐fold increased sensitivity to light in mutants (1.36 log units). (*P < .05, **P < .01)
FIGURE 5
FIGURE 5
Anatomical, immunohistochemical and molecular characterization of Zfhx3Sci/+ retina. A, Images showing the co‐localization of ZFHX3 and GAD67 in Zfhx3Sci/+ and Zfhx3+/+ retina. No overt differences in expression or localization of ZFHX3 and GAD67 were observed between Zfhx3Sci/+ compared to Zfhx3+/+ control retina. B, Images showing flat‐mount expression of GAD67 in Zfhx3Sci/+ and Zfhx3+/+ retina. DAPI nuclear counter stain is shown in blue. ONL, outer nuclear layer; OPL, Outer plexiform layer; INL, inner nuclear layer; IPL—inner plexiform layer; GCL, ganglion cell layer. C, D, Relative expression of key genes in Zfhx3+/+ (blue) and Zfhx3Sci/+ (red) retina (n = 6, ZT 8). Mean ± SEM (*P < .05, **P < .01)
FIGURE 6
FIGURE 6
Assessment of visual pathways in Zfhx3+/+ and Zfhx3Sci/+ animals. A, Dark adapted ERG recordings reflecting the electrical activity of the retina. Raw data (left) and the amplitude of a‐waves and b‐waves (right) are shown across multiple light intensities. B, Light adapted ERG recordings showing raw data (left) and the amplitudes of b‐waves detected at various light intensities. C, Dark adapted VEP recordings (left) and intensity response curve effect on P1—N1 amplitude (right). D, Light adapted VEP recordings (left) and intensity response curve effect on P1 and N1 amplitude (right)
FIGURE 7
FIGURE 7
A, Raw spike data showing examples of melanopsin type responses recorded from ipRGCs stimulated with increasing intensities of 480 nm light (480 ± 10 nm, 10 seconds, ranging from 10.1‐15.1 log quanta). B, Graph showing changes in spike firing rate over time observed from an ipRGC stimulated with increasing intensities of 480 nm light. C, Intensity response curves plotted from mean normalized response amplitudes observed for each responsive electrode in Zfhx3+/+ and Zfhx3Sci/+ retina. D, Graph showing calculated EC50 values for melanopsin responses observed in Zfhx3+/+ and Zfhx3Sci/+ retina. E‐L, Graphs showing the properties of melanopsin light responses recorded from Zfhx3+/+ and Zfhx3Sci/+ retina. All data shown is generated from pooled analysis of individual responsive electrodes recorded from Zfhx3+/+ and Zfhx3Sci/+ retina (n = 96, and n = 131 electrodes, from N = 4‐5 retina). Asterisks denote the significance of post‐hoc t‐tests following analysis by 2‐way ANOVA (**P < .01, ***P < .001)

Similar articles

Cited by

References

    1. Felder‐Schmittbuhl M‐P, Buhr ED, Dkhissi‐Benyahya O, et al. Ocular clocks: adapting mechanisms for eye functions and health. Invest Ophthalmol Vis Sci. 2018;59:4856‐4870. - PMC - PubMed
    1. McMahon DG, Iuvone PM, Tosini G. Circadian organization of the mammalian retina: from gene regulation to physiology and diseases. Prog Retin Eye Res. 2014;39:58‐76. - PMC - PubMed
    1. Bedont J, LeGates T, Slat E, et al. Lhx1 controls terminal differentiation and circadian function of the suprachiasmatic nucleus. Cell Rep. 2014;7:609‐622. - PMC - PubMed
    1. Laranjeiro R, Whitmore D. Transcription factors involved in retinogenesis are co‐opted by the circadian clock following photoreceptor differentiation. Development. 2014;141:2644‐2656. - PMC - PubMed
    1. Villard J. Transcription regulation and human diseases. Swiss Med Wkly. 2004;134:571‐579. - PubMed

Publication types