. 2021 Aug 12;14(1):124.
doi: 10.1186/s13041-021-00837-z.

TPEN attenuates amyloid-β25-35-induced neuronal damage with changes in the electrophysiological properties of voltage-gated sodium and potassium channels

Affiliations

TPEN attenuates amyloid-β25-35-induced neuronal damage with changes in the electrophysiological properties of voltage-gated sodium and potassium channels

Wen-Bo Chen et al. Mol Brain. .

Abstract

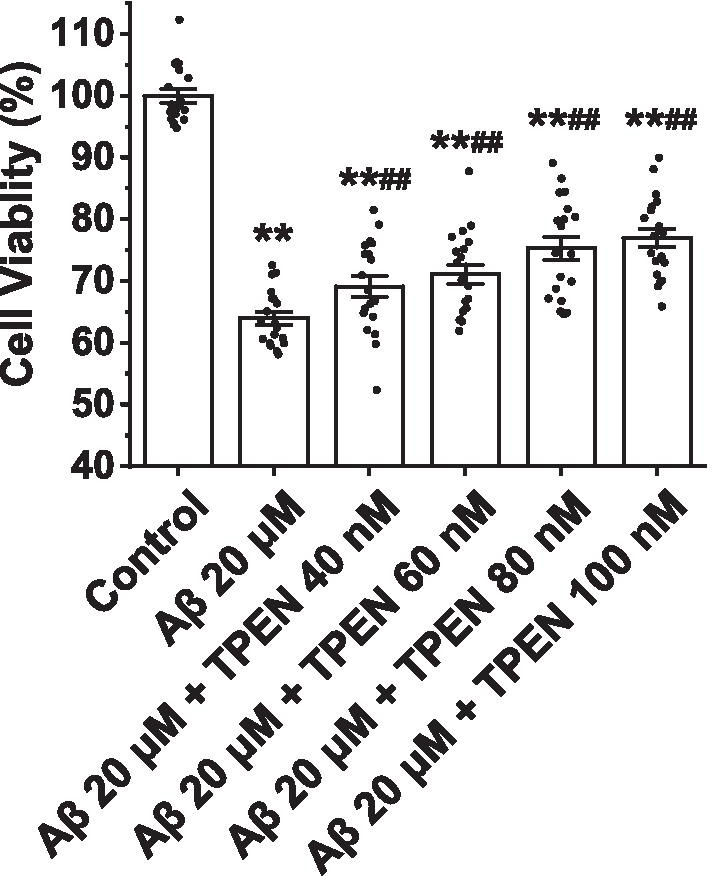
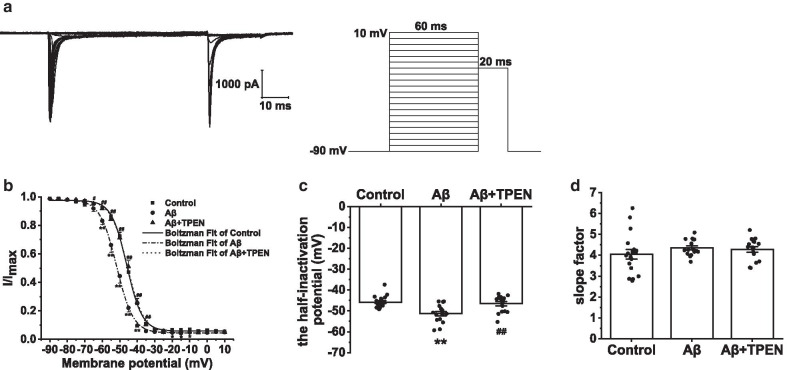
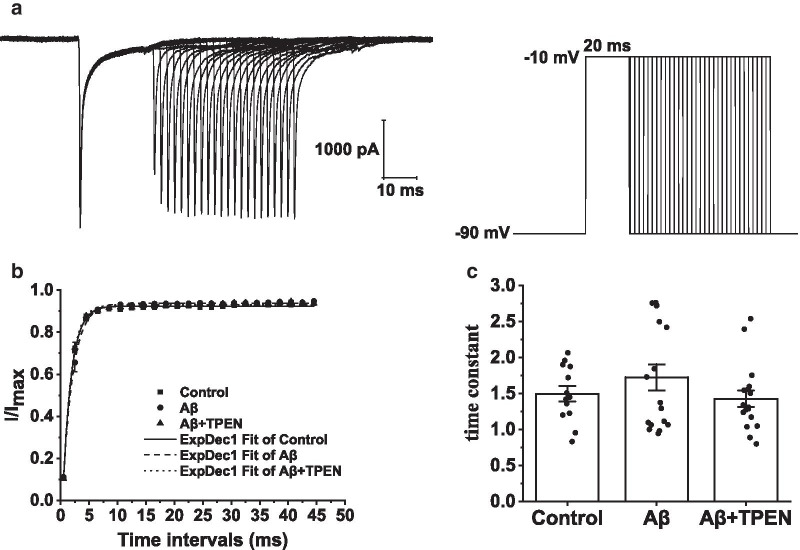
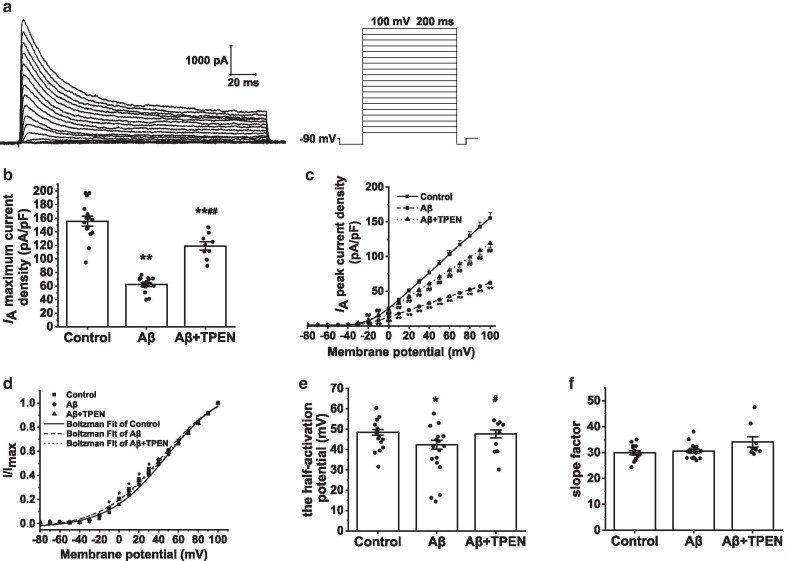
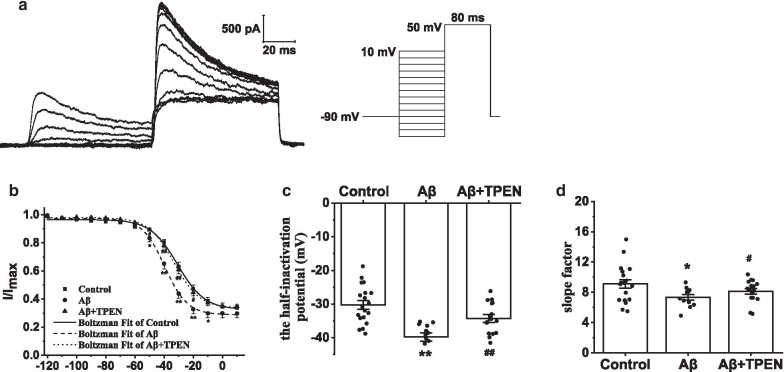
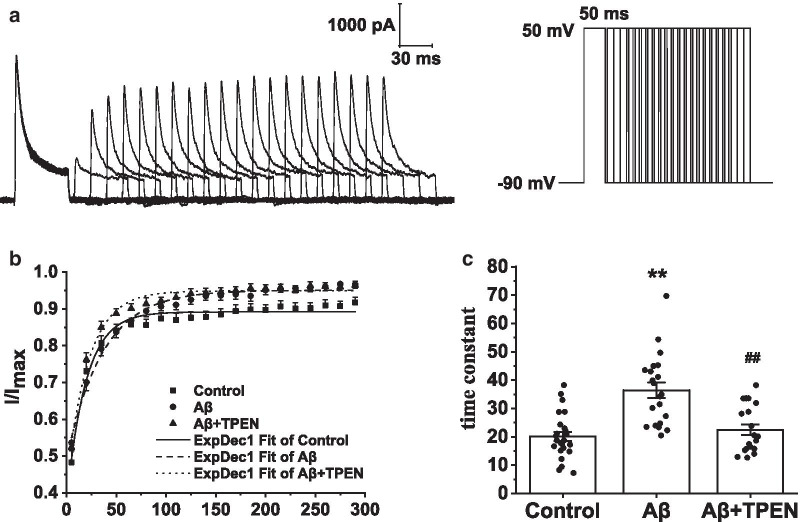
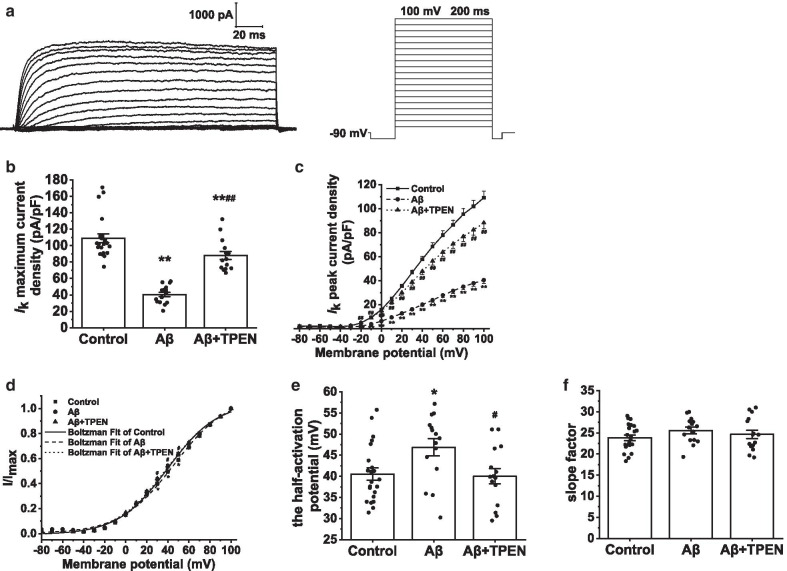
To understand the role of intracellular zinc ion (Zn2+) dysregulation in mediating age-related neurodegenerative changes, particularly neurotoxicity resulting from the generation of excessive neurotoxic amyloid-β (Aβ) peptides, this study aimed to investigate whether N, N, N', N'-tetrakis (2-pyridylmethyl) ethylenediamine (TPEN), a Zn2+-specific chelator, could attenuate Aβ25-35-induced neurotoxicity and the underlying electrophysiological mechanism. We used the 3-(4, 5-dimethyl-thiazol-2-yl)-2, 5-diphenyltetrazolium bromide assay to measure the viability of hippocampal neurons and performed single-cell confocal imaging to detect the concentration of Zn2+ in these neurons. Furthermore, we used the whole-cell patch-clamp technique to detect the evoked repetitive action potential (APs), the voltage-gated sodium and potassium (K+) channels of primary hippocampal neurons. The analysis showed that TPEN attenuated Aβ25-35-induced neuronal death, reversed the Aβ25-35-induced increase in intracellular Zn2+ concentration and the frequency of APs, inhibited the increase in the maximum current density of voltage-activated sodium channel currents induced by Aβ25-35, relieved the Aβ25-35-induced decrease in the peak amplitude of transient outward K+ currents (IA) and outward-delayed rectifier K+ currents (IDR) at different membrane potentials, and suppressed the steady-state activation and inactivation curves of IA shifted toward the hyperpolarization direction caused by Aβ25-35. These results suggest that Aβ25-35-induced neuronal damage correlated with Zn2+ dysregulation mediated the electrophysiological changes in the voltage-gated sodium and K+ channels. Moreover, Zn2+-specific chelator-TPEN attenuated Aβ25-35-induced neuronal damage by recovering the intracellular Zn2+ concentration.

Keywords: Aβ25–35; Channel currents; TPEN; Voltage-gated potassium channels; Voltage-gated sodium channels; Zinc ions.


Conflict of interest statement

The authors declare that they have no competing interests.

Figures

Fig. 1
Fig. 1
Effects of TPEN on the viability of the hippocampal neurons treated with Aβ25–35. The data are presented as means ± SEMs; **p < 0.01 versus the control group; ##p < 0.01 versus the Aβ group; n = 19. amyloid-β
Fig. 2
Fig. 2
Effects of TPEN on the intracellular Zn2+ concentration of the hippocampal neurons treated with Aβ25–35. a Representative confocal images showing FluoZin3 (green) staining under the different treatments. The scale bar is 50 μm. b Mean fluorescence intensity of FluoZin3 in the different groups. The data shown in b were obtained from three independent experiments, each examining 15–20 neurons for each condition. The data are presented as means ± SEMs; **p < 0.01 versus the control group; ##p < 0.01 versus the Aβ group. amyloid-β
Fig. 3
Fig. 3
Effects of TPEN on the frequency of APs in the hippocampal neurons treated with Aβ25–35. a Typical example of APs traces obtained in the hippocampal neurons under the different treatments. b The frequency of APs in the different treatments. The data are presented as means ± SEMs; **p < 0.01 versus the control group; #p < 0.05 versus the Aβ group; n = 8 for the control group; n = 23 for the Aβ group; n = 14 for the Aβ + TPEN group. Aβ, amyloid-β; APs, the evoked repetitive action potential
Fig. 4
Fig. 4
Effects of TPEN on the amplitudes and activation properties of INa in the hippocampal neurons treated with Aβ25–35. a Typical example of INa traces obtained in the hippocampal neurons (left) and record protocol (right). b Maximum current density of INa in the different treatments. c Current voltage (I-V) curves of INa in the different treatments. d Activation curves of INa in the different treatments. e Half-activation potential of INa in the different treatments. f Activation slope factor of INa in the different treatments. The data are presented as means ± SEMs; *p < 0.05 and **p < 0.01 versus the control group; #p < 0.05 versus the Aβ group; n = 21 for the control group; n = 16 for the Aβ group; n = 17 for the Aβ + TPEN group. amyloid-β, INa, voltage-gated Na+ channel curren
Fig. 5
Fig. 5
Effects of TPEN on the inactivation properties of Nav in the hippocampal neurons treated with Aβ25–35. a Typical example of Nav inactivation traces obtained in the hippocampal neurons (left) and record protocol (right). b Inactivation curves of Nav in the different treatments. c Half-inactivation potential of Nav in the different treatments. d Inactivation slope factor of Nav in the different treatments. The data are presented as means ± SEMs; *p < 0.05 and **p < 0.01 versus the control group; #p < 0.05 and ##p < 0.01 versus the Aβ group; n = 18 for the control group; n = 16 for the Aβ group; n = 16 for the Aβ + TPEN group. Nav, voltage-gated sodium channels; Aβ, amyloid-β
Fig. 6
Fig. 6
Effects of TPEN on the recovery of Nav from inactivation in the hippocampal neurons treated with Aβ25–35. a Typical example of Nav recovery traces from inactivation obtained in the hippocampal neurons (left) and record protocol (right). b Recovery curves of Nav from inactivation in the different treatments. c Time constant of the recovery curves for Nav in the different treatments. The data are presented as means ± SEMs; n = 13 for the control group; n = 17 for the Aβ group; n = 17 for the Aβ + TPEN group. Nav, voltage-gated sodium channels; Aβ, amyloid-β
Fig. 7
Fig. 7
Effects of TPEN on the amplitudes and activation properties of IA in the hippocampal neurons treated with Aβ25–35. a Typical example of IA traces obtained in the hippocampal neurons (left) and record protocol (right). b Maximum current density of IA in the different treatments. c Current voltage (I-V) curves of IA in the different treatments. d Activation curves of IA in the different treatments. e Half-activation potential of IA in the different treatments. f Activation slope factor of IA in the different treatments. The data are presented as means ± SEMs; *p < 0.05 and **p < 0.01 versus the control group; #p < 0.05 and ##p < 0.01 versus the Aβ group; n = 15 for the control group; n = 17 for the Aβ group; n = 9 for the Aβ + TPEN group. Aβ, amyloid-β; IA, transient outward potassium current
Fig. 8
Fig. 8
Effects of TPEN on the inactivation properties of IA in the hippocampal neurons treated with Aβ25–35. a Typical example of IA inactivation traces obtained in the hippocampal neurons (left) and record protocol (right). b Inactivation curves of IA in the different treatments. c Half-inactivation potential of IA in the different treatments. d Inactivation slope factor of IA in the different treatments. The data are presented as means ± SEMs; **p < 0.01 versus the control group; ##p < 0.01 versus the Aβ group; n = 19 for the control group; n = 12 for the Aβ group; n = 16 for the Aβ + TPEN group. Aβ, amyloid-β; IA, transient outward potassium current
Fig. 9
Fig. 9
Effects of TPEN on the recovery of IA from inactivation in the hippocampal neurons treated with Aβ25–35. a Typical example of IA recovery traces from inactivation obtained in the hippocampal neurons (left) and record protocol (right). b Recovery curves of IA from inactivation in the different treatments. c Time constant of the recovery curves for IA in the different treatments. The data are presented as means ± SEMs; *p < 0.05 and **p < 0.01 versus the control group; #p < 0.05 and ##p < 0.01 versus the Aβ group; n = 24 for the control group; n = 21 for the Aβ group; n = 20 for the Aβ + TPEN group. Aβ, amyloid-β; IA, transient outward potassium current
Fig. 10
Fig. 10
Effects of TPEN on the amplitudes and activation properties of IDR in the hippocampal neurons treated with Aβ25–35. a Typical example of IDR traces obtained in the hippocampal neurons (left) and record protocol (right). b Maximum current density of IDR in the different treatments. c Current voltage (I–V) curves of IDR in the different treatments. d Activation curves of IDR in the different treatments. e Half-activation potential of IDR in the different treatments. f Activation slope factor of IDR in the different treatments. The data are presented as means ± SEMs; *p < 0.05 and **p < 0.01 versus the control group; #p < 0.05 and ##p < 0.01 versus the Aβ group; n = 22 for the control group; n = 15 for the Aβ group; n = 15 for the Aβ + TPEN group. amyloid-β, IDR, outward-delayed rectifier potassium current

Similar articles

Cited by

References

    1. Hardy J, Selkoe DJ. The amyloid hypothesis of Alzheimer's disease: progress and problems on the road to therapeutics. Science. 2002;297(5580):353–356. doi: 10.1126/science.1072994. - DOI - PubMed
    1. Goedert M, Spillantini MG. A century of Alzheimer’s disease. Science. 2006;314(5800):777–781. doi: 10.1126/science.1132814. - DOI - PubMed
    1. Mawuenyega KG, Sigurdson W, Ovod V, Munsell L, Kasten T, Morris JC, et al. Decreased clearance of CNS beta-amyloid in Alzheimer’s disease. Science. 2010;330(6012):1774. doi: 10.1126/science.1197623. - DOI - PMC - PubMed
    1. Praticò D. Oxidative stress hypothesis in Alzheimer’s disease: a reappraisal. Trends Pharmacol Sci. 2008;29(12):609–615. doi: 10.1016/j.tips.2008.09.001. - DOI - PubMed
    1. Minkeviciene R, Rheims S, Dobszay MB, Zilberter M, Hartikainen J, Fülöp L, et al. Amyloid beta-induced neuronal hyperexcitability triggers progressive epilepsy. J Neurosci. 2009;29(11):3453–3462. doi: 10.1523/JNEUROSCI.5215-08.2009. - DOI - PMC - PubMed

Publication types

MeSH terms

LinkOut - more resources