Comparative Study
. 2021 Aug 12;14(1):125.
doi: 10.1186/s13041-021-00835-1.

Altered hippocampal transcriptome dynamics following sleep deprivation

Affiliations
Comparative Study

Altered hippocampal transcriptome dynamics following sleep deprivation

Marie E Gaine et al. Mol Brain. .

Abstract

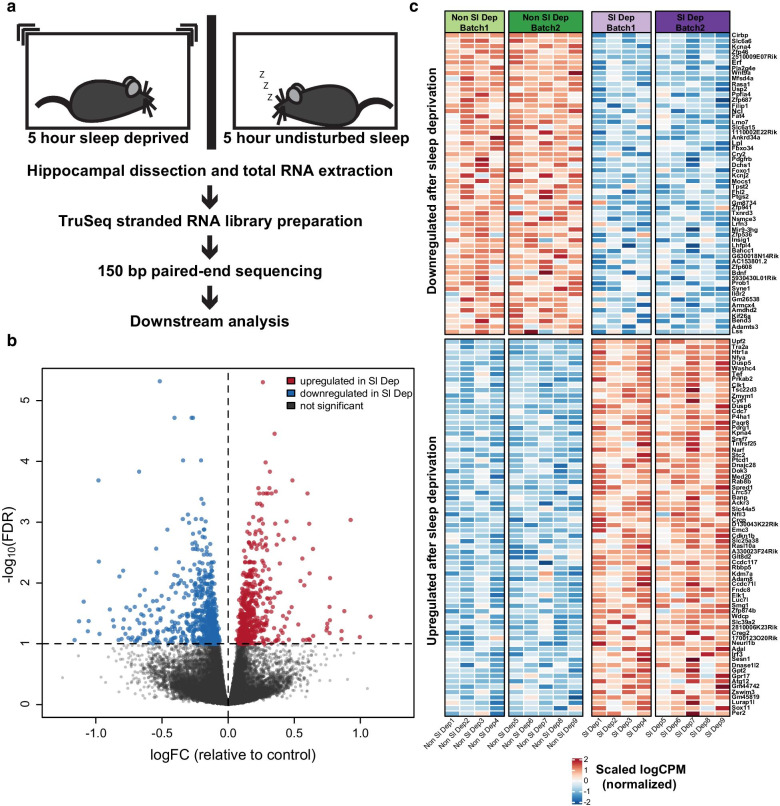
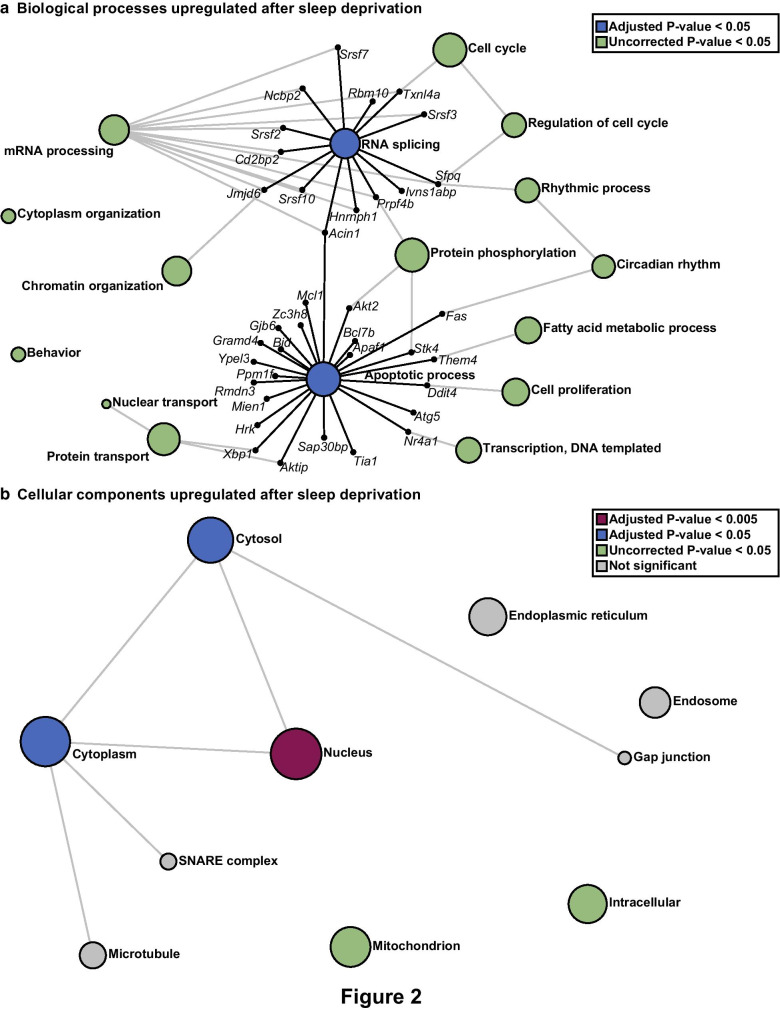
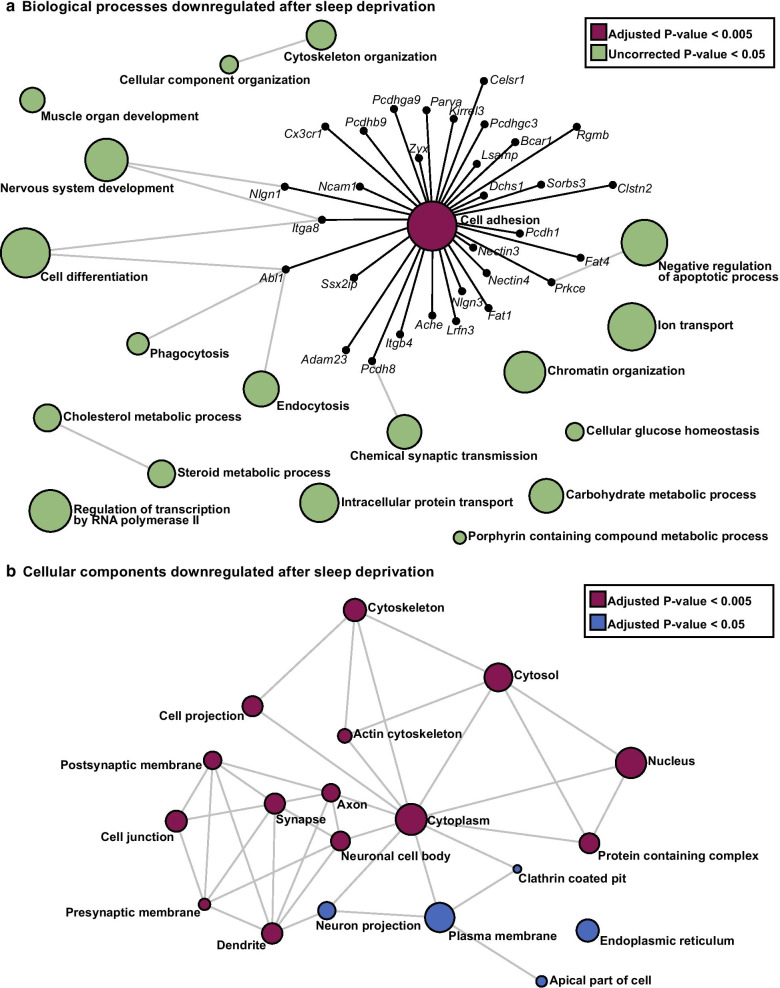
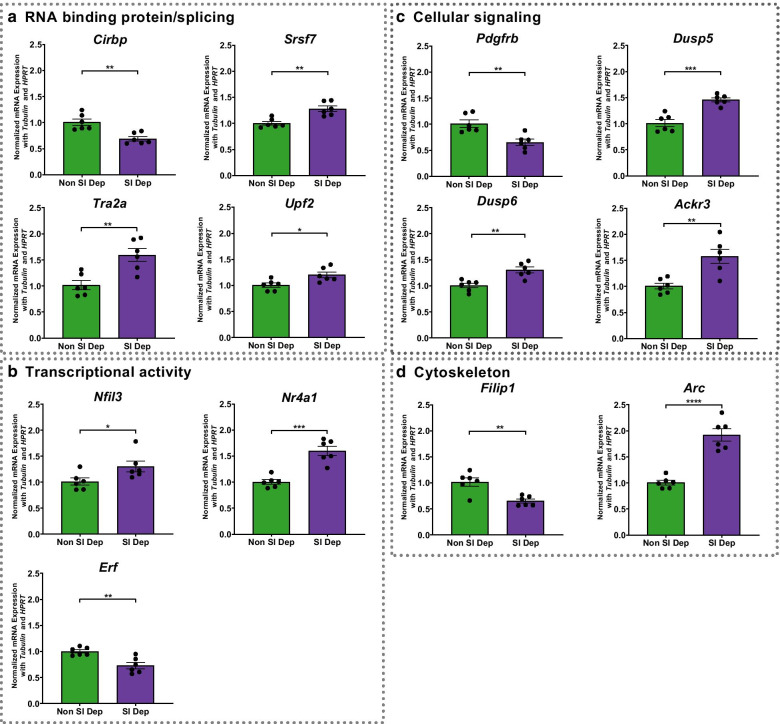
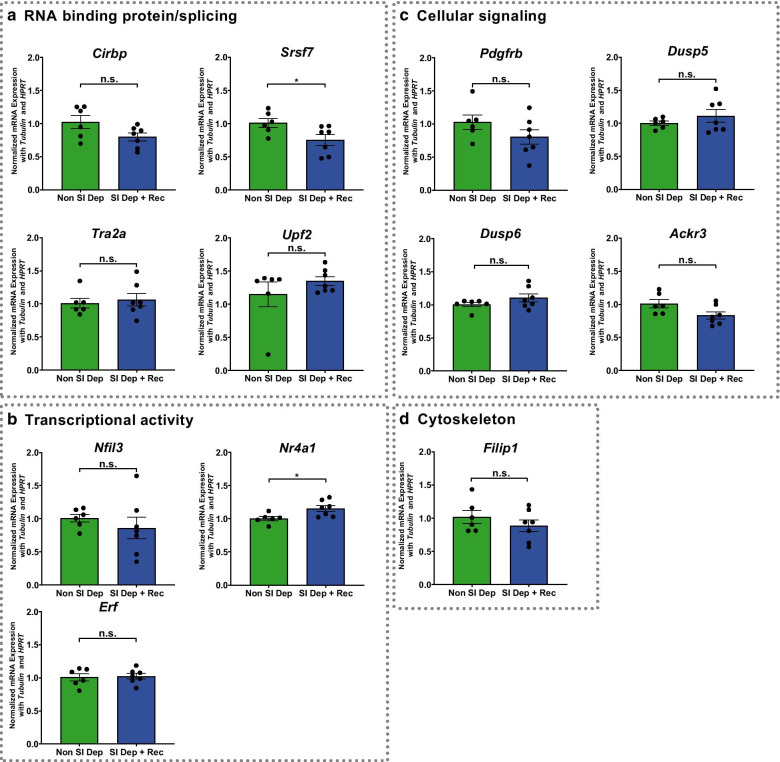
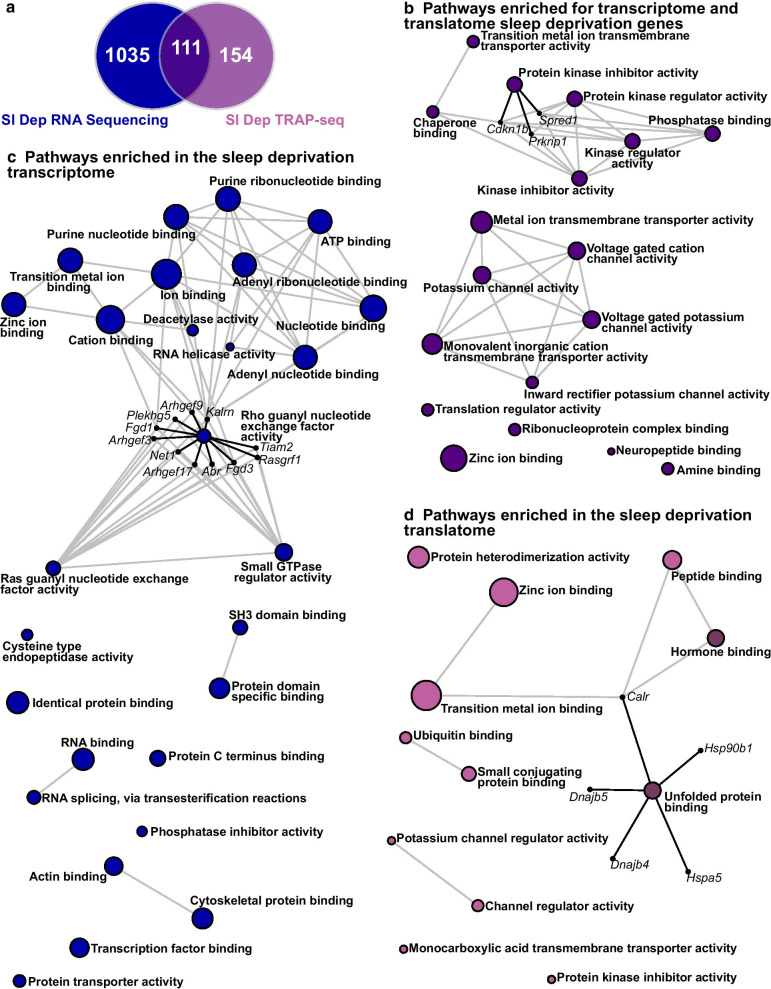
Widespread sleep deprivation is a continuing public health problem in the United States and worldwide affecting adolescents and adults. Acute sleep deprivation results in decrements in spatial memory and cognitive impairments. The hippocampus is vulnerable to acute sleep deprivation with changes in gene expression, cell signaling, and protein synthesis. Sleep deprivation also has long lasting effects on memory and performance that persist after recovery sleep, as seen in behavioral studies from invertebrates to humans. Although previous research has shown that acute sleep deprivation impacts gene expression, the extent to which sleep deprivation affects gene regulation remains unknown. Using an unbiased deep RNA sequencing approach, we investigated the effects of acute sleep deprivation on gene expression in the hippocampus. We identified 1,146 genes that were significantly dysregulated following sleep deprivation with 507 genes upregulated and 639 genes downregulated, including protein coding genes and long non-coding RNAs not previously identified as impacted by sleep deprivation. Notably, genes significantly upregulated after sleep deprivation were associated with RNA splicing and the nucleus. In contrast, downregulated genes were associated with cell adhesion, dendritic localization, the synapse, and postsynaptic membrane. Furthermore, we found through independent experiments analyzing a subset of genes that three hours of recovery sleep following acute sleep deprivation was sufficient to normalize mRNA abundance for most genes, although exceptions occurred for some genes that may affect RNA splicing or transcription. These results clearly demonstrate that sleep deprivation differentially regulates gene expression on multiple transcriptomic levels to impact hippocampal function.

Keywords: Gene expression; Hippocampus; Memory; RNA sequencing; Sleep deprivation; Transcription; Transcriptome; Translatome.


Conflict of interest statement

The authors declare that they have no competing interests.

Figures

Fig. 1
Fig. 1
Acute sleep deprivation causes substantial gene expression changes in the mouse hippocampus. a Schematic showing experimental procedure for RNA sequencing following acute sleep deprivation. C57BL/6 J male mice were either sleep deprived for 5 h (n = 9) or left undisturbed (n = 9). Immediately following sleep deprivation or undisturbed sleep, the whole hippocampus was dissected out and flash frozen. Total RNA was extracted and processed for RNA sequencing. b Volcano plot illustrating differentially expressed genes between non-sleep deprived and sleep deprived mice. Genes with a false discovery rate (FDR) < 0.1 are highlighted in red for significantly upregulated (507 genes) and blue for significantly downregulated (639 genes) after sleep deprivation. Genes that are not significantly differentially expressed in sleep deprived mice are in grey. c Heatmap showing the most differentially expressed genes filtered by FDR ≤ 0.01 and effect size >  ± 0.5 in each cohort. The top rows represent genes that are significantly downregulated after sleep deprivation. The bottom rows represent genes that are significantly upregulated after sleep deprivation. Each column represents one mouse and columns are grouped by batch. The scale represents log counts per million (logCPM), with red denoting upregulation and blue denoting downregulation after sleep deprivation. The most significantly upregulated gene after sleep deprivation was UPF2 Regulator of Nonsense Mediated MRNA Decay (Upf2; log fold change (LogFC) = 0.263, FDR = 5.01 × 10–6). The most significantly downregulated gene after sleep deprivation was Cold Inducible RNA Binding Protein (Cirbp; LogFC = − 0.516, FDR = 4.83 × 10–6)
Fig. 2
Fig. 2
Distinct biological processes and cellular components are enriched for genes upregulated after acute sleep deprivation. a Using Network Analyst software and the PANTHER: Biological Processes (BP) classification to perform overrepresentation analysis (ORA), pathways enriched for upregulated genes were identified. RNA splicing and Apoptotic Process were the most significantly enriched networks (Adjusted P-value = 0.025). These top networks have been expanded to show the genes that are involved and upregulated after sleep deprivation. b Using Network Analyst software and the PANTHER: Cellular Components (CC) classification to perform ORA we identified cellular components enriched for genes upregulated after sleep deprivation. The nucleus is the most significantly enriched (Adjusted P-value = 1.74 × 10–9). The size of each node represents the number of hits from the inputted gene list
Fig. 3
Fig. 3
Distinct biological processes and cellular components are enriched for downregulated genes after acute sleep deprivation. a Pathway analysis using the PANTHER:BP classification to perform ORA, pathways enriched for downregulated genes were identified. Cell adhesion is the most significantly enriched network (Adjusted P-value = 2.91 × 10–3). The cell adhesion network has been expanded to show the genes that are involved and downregulated after sleep deprivation. b Using Network Analyst software and the PANTHER:CC classification to perform ORA we identified enriched cellular components for genes downregulated after sleep deprivation. The dendrite and postsynaptic membrane are the most significantly enriched cellular components (Adjusted P-value = 4.28 × 10–7). The size of each node represents the number of hits from the inputted gene list
Fig. 4
Fig. 4
RT-qPCR validation of RNA-Seq results. From an independent cohort of mice (n = 6 in each group), RT-qPCR was used to validate the findings of chosen genes. a Four genes related to RNA binding proteins and/or splicing: Cirbp (P-value = 1.9 × 10–3), Srsf7 (P-value = 1.6 × 10–3), Tra2a (P-value = 3.0 × 10–3), and Upf2 (P-value = 0.0168); b three genes related to transcriptional activity: Nfil3 (P-value = 0.0388), Nr4a1 (P-value = 1.0 × 10–4), and Erf (P-value = 2.6 × 10–3); c four genes related to cellular signaling: Pdgfrb (P-value = 3.2 × 10–3), Dusp5 (P-value = 2.0 × 10–4), Dusp6 (P-value = 2.0 × 10–3), and Ackr3 (P-value = 2.8 × 10–3); and d two genes related to cytoskeleton: Filip1 (P-value = 2.1 × 10–3) and Arc (P-value < 0.0001). Data are presented as mean ± SEM and normalized against two housekeeping genes (Tubulin and Hprt). Differences are significant at * P ≤ 0.05, ** P ≤ 0.01, *** P ≤ 0.001, **** P < 0.0001, and evaluated using an unpaired t-test
Fig. 5
Fig. 5
RT-qPCR analysis of chosen genes following recovery from sleep deprivation. An independent cohort of mice were allowed to recover from acute sleep deprivation for 3 h (n = 7) and compared to non-sleep deprived mice (n = 6) using RT-qPCR analysis. a Four genes related to RNA binding proteins and/or splicing: Cirbp (P-value = 0.0674), Srsf7 (P-value = 0.0356), Tra2a (P-value = 0.6881), and Upf2 (P-value = 0.3009); b three genes related to transcriptional activity: Nfil3 (P-value = 0.4402), Nr4a1 (P-value = 0.0216), and Erf (P-value = 0.8060); c four genes related to cellular signaling: Pdgfrb (P-value = 0.1771), Dusp5 (P-value = 0.3339), Dusp6 (P-value = 0.1915), and Ackr3 (P-value = 0.0565); and d one related to cytoskeleton: Filip1 (P-value = 0.3342). Data are presented as mean ± SEM and normalized against two housekeeping genes (Tubulin and Hprt). Differences are significant at * P < 0.05 and evaluated using an unpaired t-test. n.s. denotes non-significant differences (P > 0.05)
Fig. 6
Fig. 6
Acute sleep deprivation causes distinct transcriptome and translatome patterns. a We compared the top RNA-seq genes (1,146 genes) to our previously generated TRAP-Seq sleep deprivation results (265 genes) and identified 1,035 genes only identified as differentially expressed using RNA-seq (transcriptome), 154 genes only identified as differentially expressed using TRAP-Seq (translatome), and 111 genes found in both. b Using Network Analyst software and the Gene Ontology (GO): Molecular Function (MF) classification, pathways enriched for genes found using both RNA-seq and TRAP-Seq. The most significant pathway was Protein kinase inhibitor activity (P-value = 2.01 × 10–3, Adjusted P-value = 0.366) and this network has been expanded to show the genes that are transcribed and translated after sleep deprivation. c Using Network Analyst software and the GO:MF classification, pathways enriched for genes found using only RNA sequencing. The most significant pathway was Rho guanyl nucleotide exchange factor activity (P-value = 3.07 × 10–4, Adjusted P-value = 0.119) and this network has been expanded to show the genes that are involved and transcribed after sleep deprivation. d Using Network Analyst software and the GO:MF classification, pathways enriched for genes found using only TRAP-Seq. The most significant pathway was Unfolded protein binding (Adjusted P-value = 0.021) and this network has been expanded to show the genes that are involved and translated after sleep deprivation. Networks that survive correction for multiple testing (Adjusted P-value < 0.05) are emphasized with dark pink. The size of each node represents the number of hits from the inputted gene list

References

    1. Chattu VK, Sakhamuri SM, Kumar R, Spence DW, BaHammam AS, Pandi-Perumal SR. Insufficient sleep syndrome: is it time to classify it as a major noncommunicable disease? Sleep Sci. 2018;11(2):56–64. doi: 10.5935/1984-0063.20180013. - DOI - PMC - PubMed
    1. Centers for Disease C, Prevention. Perceived insufficient rest or sleep among adults - United States, 2008. MMWR Morb Mortal Wkly Rep. 2009;58(42):1175–9. - PubMed
    1. Wheaton AG, Jones SE, Cooper AC, Croft JB. Short sleep duration among middle school and high school students - United States, 2015. MMWR Morb Mortal Wkly Rep. 2018;67(3):85–90. doi: 10.15585/mmwr.mm6703a1. - DOI - PMC - PubMed
    1. Liu Y, Wheaton AG, Chapman DP, Cunningham TJ, Lu H, Croft JB. Prevalence of healthy sleep duration among adults-United States, 2014. MMWR Morb Mortal Wkly Rep. 2016;65(6):137–141. doi: 10.15585/mmwr.mm6506a1. - DOI - PubMed
    1. Gronli J, Soule J, Bramham CR. Sleep and protein synthesis-dependent synaptic plasticity: impacts of sleep loss and stress. Front Behav Neurosci. 2013;7:224. - PMC - PubMed

Publication types

MeSH terms