

Identification of subgroups along the glycolysis-cholesterol synthesis axis and the development of an associated prognostic risk model
- PMID: 34384498
- PMCID: PMC8359075
- DOI: 10.1186/s40246-021-00350-3
Identification of subgroups along the glycolysis-cholesterol synthesis axis and the development of an associated prognostic risk model
Abstract
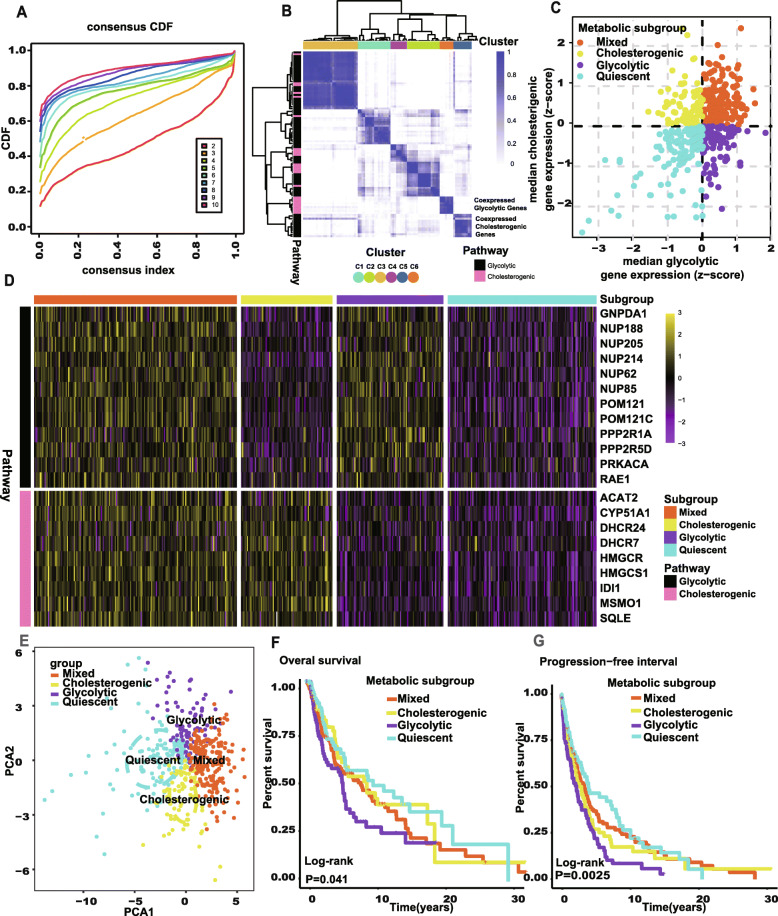
Background: Skin cutaneous melanoma (SKCM) is one of the most highly prevalent and complicated malignancies. Glycolysis and cholesterogenesis pathways both play important roles in cancer metabolic adaptations. The main aims of this study are to subtype SKCM based on glycolytic and cholesterogenic genes and to build a clinical outcome predictive algorithm based on the subtypes.
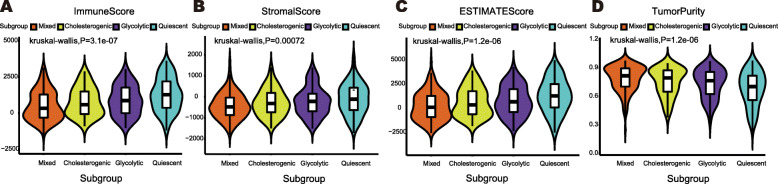
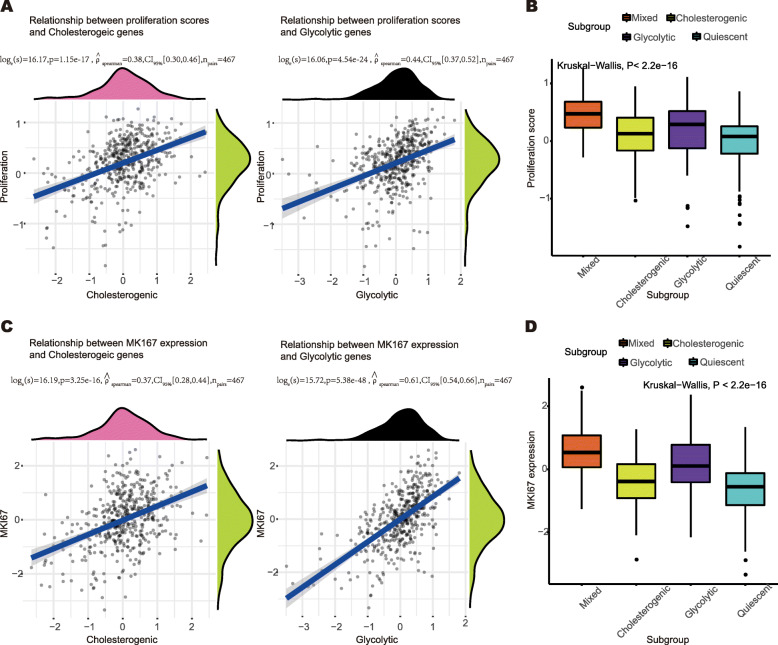
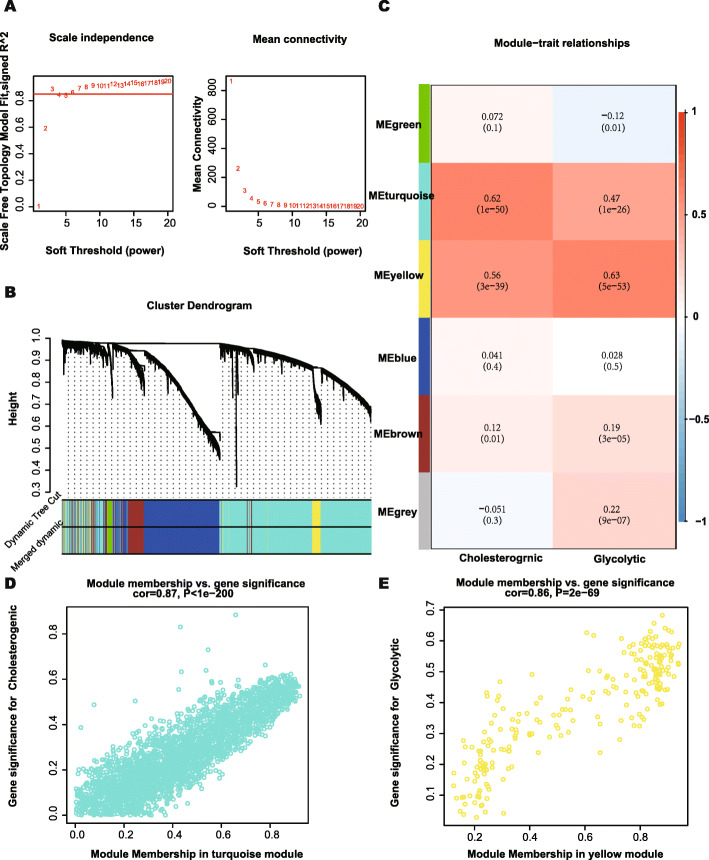
Methods: A dataset with 471 SKCM specimens was downloaded from The Cancer Genome Atlas (TCGA) database. We extracted and clustered genes from the Molecular Signatures Database v7.2 and acquired co-expressed glycolytic and cholesterogenic genes. We then subtyped the SKCM samples and validated the efficacy of subtypes with respect to simple nucleotide variations (SNVs), copy number variation (CNV), patients' survival statuses, tumor microenvironment, and proliferation scores. We also constructed a risk score model based on metabolic subclassification and verified the model using validating datasets. Finally, we explored potential drugs for high-risk SKCM patients.
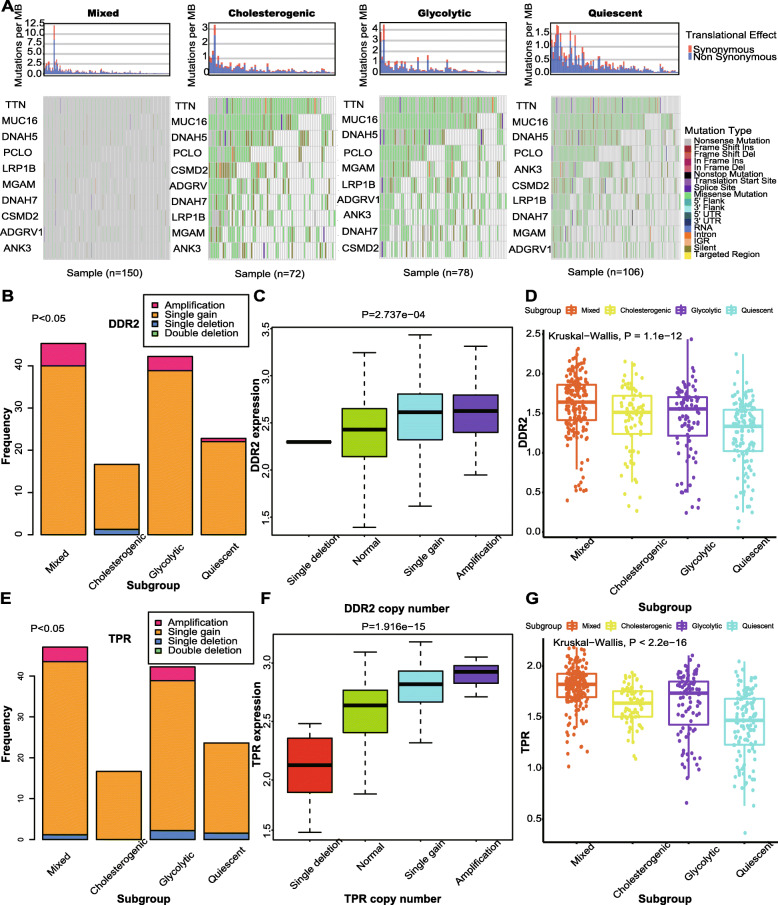
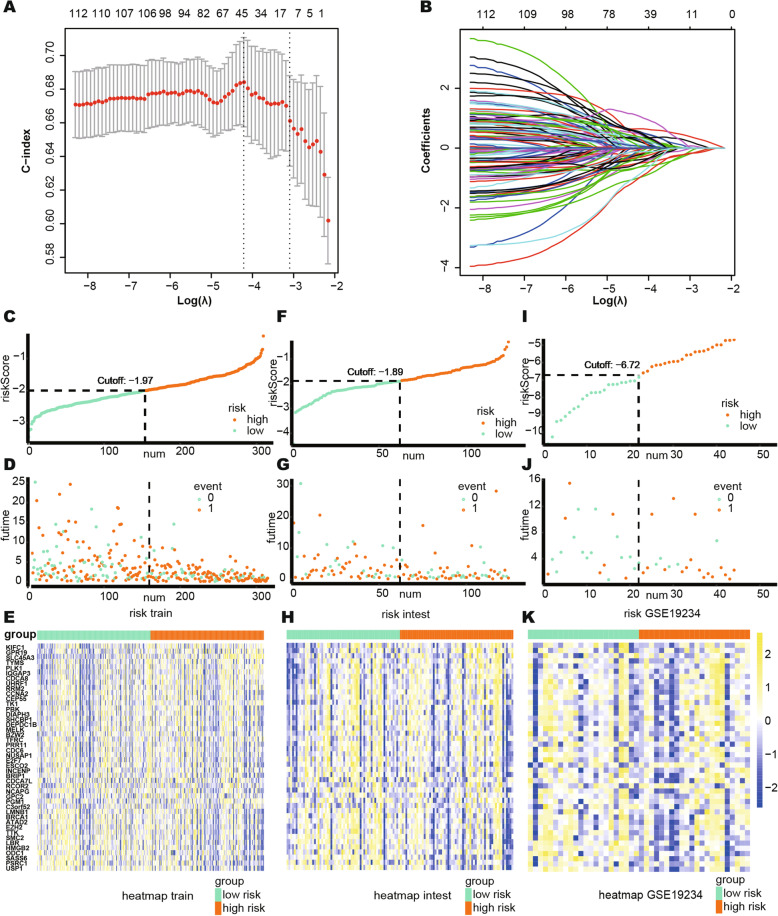
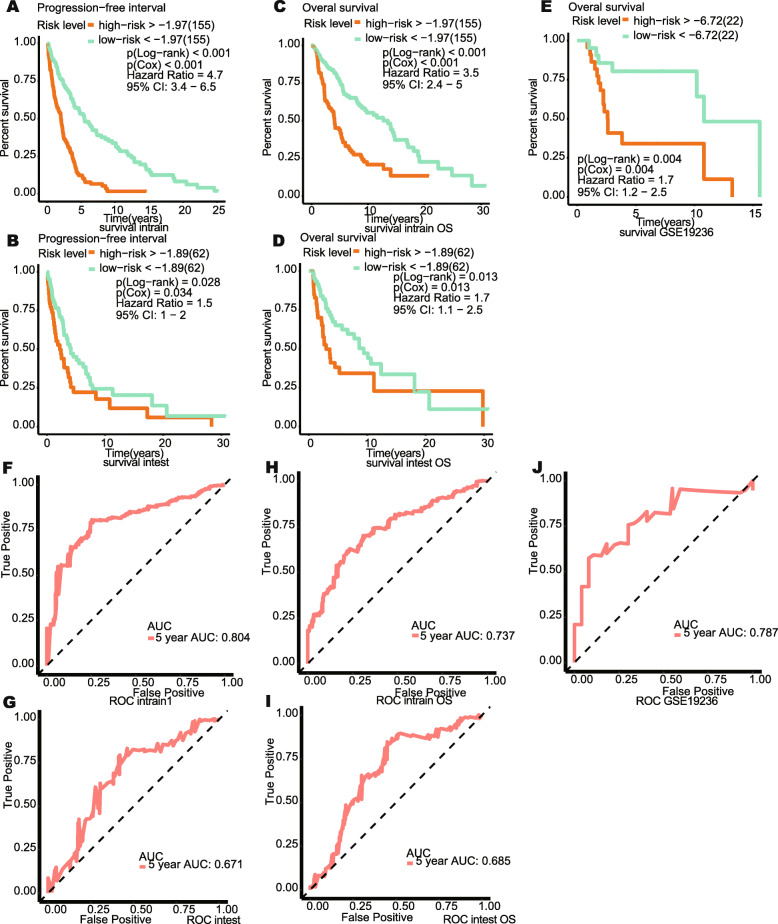
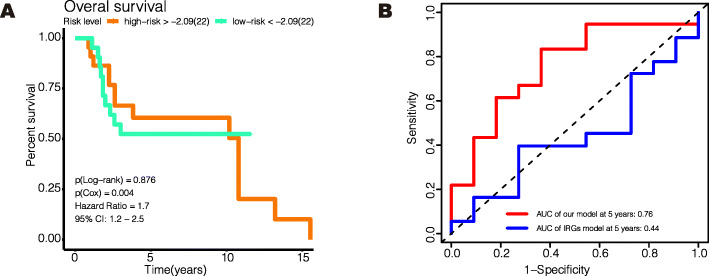
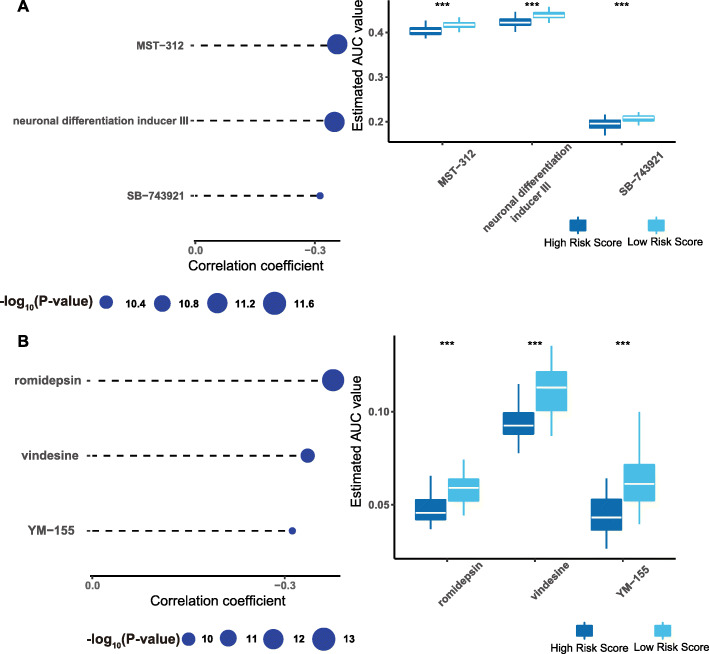
Results: SKCM patients were divided into four subtype groups: glycolytic, cholesterogenic, mixed, and quiescent subgroups. The glycolytic subtype had the worst prognosis and MGAM SNV extent. Compared with the cholesterogenic subgroup, the glycolytic subgroup had higher rates of DDR2 and TPR CNV and higher proliferation scores and MK167 expression levels, but a lower tumor purity proportion. We constructed a forty-four-gene predictive signature and identified MST-321, SB-743921, Neuronal Differentiation Inducer III, romidepsin, vindesine, and YM-155 as high-sensitive drugs for high-risk SKCM patients.
Conclusions: Subtyping SKCM patients via glycolytic and cholesterogenic genes was effective, and patients in the glycolytic-gene enriched group were found to have the worst outcome. A robust prognostic algorithm was developed to enhance clinical decisions in relation to drug administration.
Keywords: Machine learning; Melanoma; Metabolic; Predictive model.
© 2021. The Author(s).
Conflict of interest statement
The authors declare that they have no competing interests.
Figures
Similar articles
-
Identification of subgroups and development of prognostic risk models along the glycolysis-cholesterol synthesis axis in lung adenocarcinoma.Sci Rep. 2024 Jun 26;14(1):14704. doi: 10.1038/s41598-024-64602-7. Sci Rep. 2024. PMID: 38926418 Free PMC article.
-
Alteration in glycolytic/cholesterogenic gene expression is associated with bladder cancer prognosis and immune cell infiltration.BMC Cancer. 2022 Jan 3;22(1):2. doi: 10.1186/s12885-021-09064-0. BMC Cancer. 2022. PMID: 34980012 Free PMC article.
-
Identification of four gastric cancer subtypes based on genetic analysis of cholesterogenic and glycolytic pathways.Bioengineered. 2021 Dec;12(1):4780-4793. doi: 10.1080/21655979.2021.1956247. Bioengineered. 2021. PMID: 34346836 Free PMC article.
-
Copy number variations in malignant melanoma: genomic regions, biomarkers, and therapeutic targets.Neoplasma. 2024 Apr;71(2):143-152. doi: 10.4149/neo_2024_240207N58. Neoplasma. 2024. PMID: 38766854 Review.
-
The regulatory roles and clinical significance of glycolysis in tumor.Cancer Commun (Lond). 2024 Jul;44(7):761-786. doi: 10.1002/cac2.12549. Epub 2024 Jun 8. Cancer Commun (Lond). 2024. PMID: 38851859 Free PMC article. Review.
Cited by
-
Creatine kinase mitochondrial 2 promotes the growth and progression of colorectal cancer via enhancing Warburg effect through lactate dehydrogenase B.PeerJ. 2024 Jun 28;12:e17672. doi: 10.7717/peerj.17672. eCollection 2024. PeerJ. 2024. PMID: 38952967 Free PMC article.
-
The Genetic Architecture of Vitamin D Deficiency among an Elderly Lebanese Middle Eastern Population: An Exome-Wide Association Study.Nutrients. 2023 Jul 20;15(14):3216. doi: 10.3390/nu15143216. Nutrients. 2023. PMID: 37513634 Free PMC article.
-
Interaction between glycolysis‒cholesterol synthesis axis and tumor microenvironment reveal that gamma-glutamyl hydrolase suppresses glycolysis in colon cancer.Front Immunol. 2022 Dec 7;13:979521. doi: 10.3389/fimmu.2022.979521. eCollection 2022. Front Immunol. 2022. PMID: 36569910 Free PMC article.
-
Research on molecular characteristics of ADME-related genes in kidney renal clear cell carcinoma.Sci Rep. 2024 Jul 22;14(1):16834. doi: 10.1038/s41598-024-67516-6. Sci Rep. 2024. PMID: 39039118 Free PMC article.
-
Comprehensive analysis of a glycolysis and cholesterol synthesis-related genes signature for predicting prognosis and immune landscape in osteosarcoma.Front Immunol. 2022 Dec 23;13:1096009. doi: 10.3389/fimmu.2022.1096009. eCollection 2022. Front Immunol. 2022. PMID: 36618348 Free PMC article.
References
-
- Amaria RN, Menzies AM, Burton EM, Scolyer RA, Tetzlaff MT, Antdbacka R, Ariyan C, Bassett R, Carter B, Daud A, Faries M, Fecher LA, Flaherty KT, Gershenwald JE, Hamid O, Hong A, Kirkwood JM, Lo S, Margolin K, Messina J, Postow MA, Rizos H, Ross MI, Rozeman EA, Saw RPM, Sondak V, Sullivan RJ, Taube JM, Thompson JF, van de Wiel BA, Eggermont AM, Davies MA, Ascierto PA, Spillane AJ, van Akkooi ACJ, Wargo JA, Blank CU, Tawbi HA, Long GV, Andrews MC, Berry DA, Block MS, Boland GM, Bollin KB, Carlino MS, Carvajal RD, Cohen J, Davar D, Delman KA, Dummer R, Farwell MD, Fisher DE, Fusi A, Glitza IC, de Gruijl TD, Gyorki DE, Hauschild A, Hieken TJ, Larkin J, Lawson DH, Lebbe C, Lee JE, Lowe MC, Luke JJ, McArthur GA, McDermott DF, McQuade JL, Mitchell TC, Petrella TM, Prieto PA, Puzanov I, Robert C, Salama AK, Sandhu S, Schadendorf D, Shoushtari AN, Sosman JA, Swetter SM, Tanabe KK, Turajlic S, Tyler DS, Woodman SE, Wright FC, Zager JS Neoadjuvant systemic therapy in melanoma: recommendations of the international neoadjuvant melanoma consortium. Lancet Oncol (2019) 20(7):e378-ee89. Epub 2019/07/04. doi: 10.1016/s1470-2045(19)30332-8. PubMed PMID: 31267972. - PubMed
-
- Tasdogan A, Faubert B, Ramesh V, Ubellacker JM, Shen B, Solmonson A, et al. Metabolic heterogeneity confers differences in melanoma metastatic potential. Nature (2020) 577(7788):115-120. Epub 2019/12/20. doi: 10.1038/s41586-019-1847-2. PubMed PMID: 31853067; PubMed Central PMCID: PMCPMC6930341. - PMC - PubMed
MeSH terms
Substances
LinkOut - more resources
Full Text Sources
Medical
